There is a lot of focus on Gold at the moment but I think the little brother, Silver, is worth keeping an eye on too; especially if the US$ continues to weaken. In this post I consider the chart of Silver metal, XAG/USD, a Silver ETF, SLV, and two Silver stocks, First Majestic (NYSE:AG) and South32 (ASX: S32).
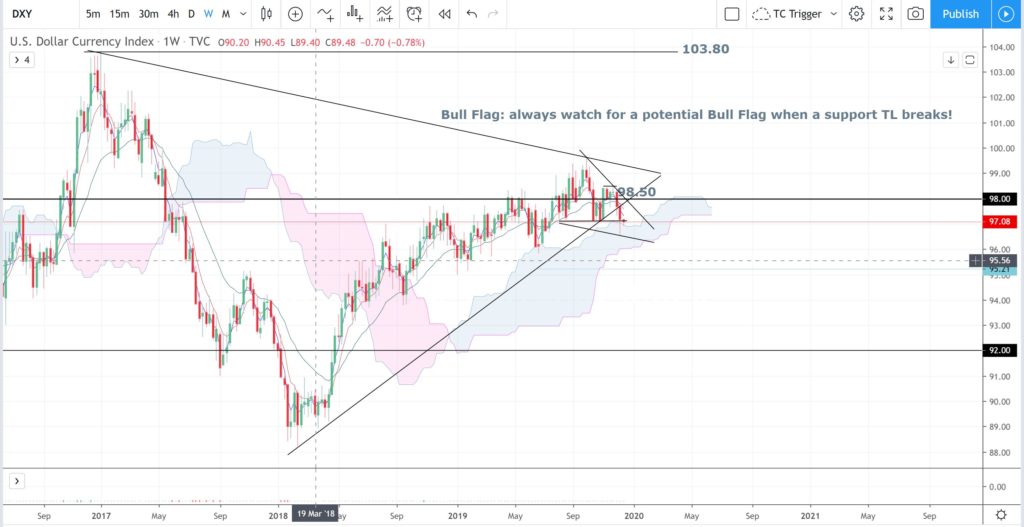
DXY: Traders of Gold and Silver need to keep an eye on the US$ index. The index is currently weaker and below a 2-year support trend line BUT you need to watch for any Bull Flag recovery here. However, continued weakness might underpin Gold and Silver!
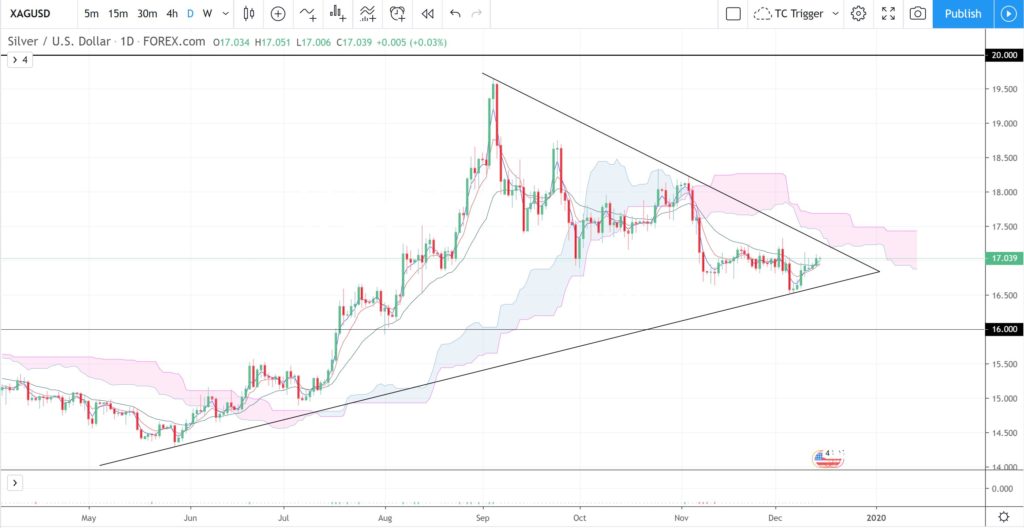
Silver daily: Silver is still consolidating in a triangle under the whole-number $20 level for now:
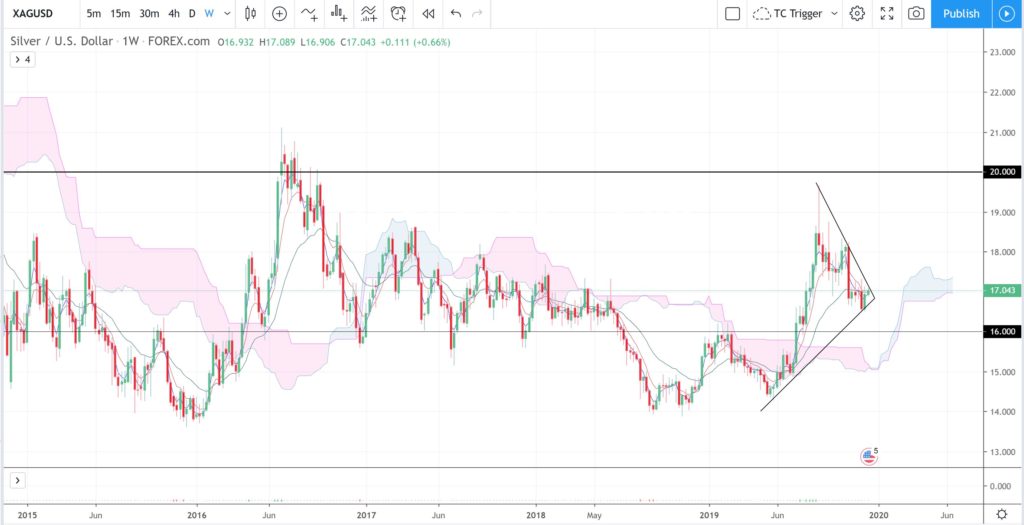
Silver weekly: the $20 is a bit of an S/R zone:
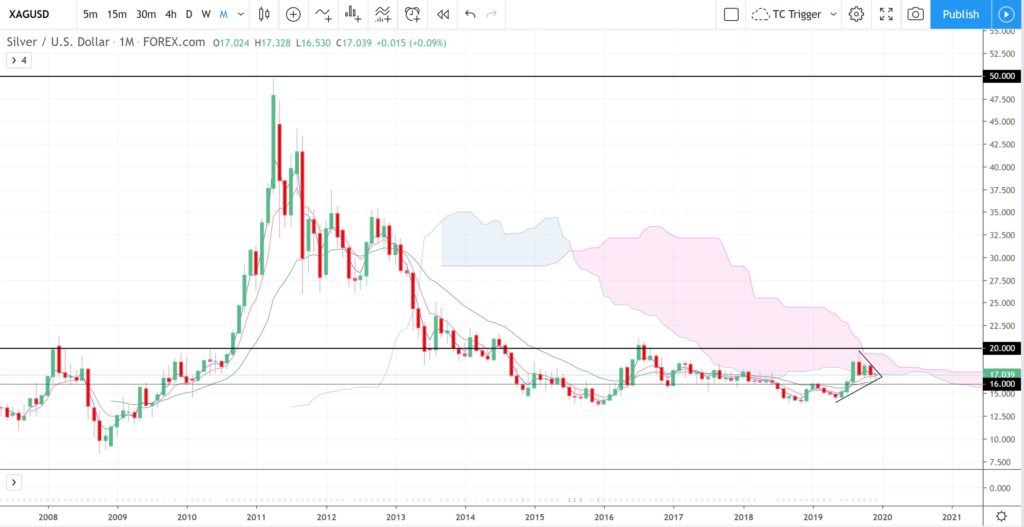
Silver monthly: this S/R zone of $20 is more obvious on the monthly chart:
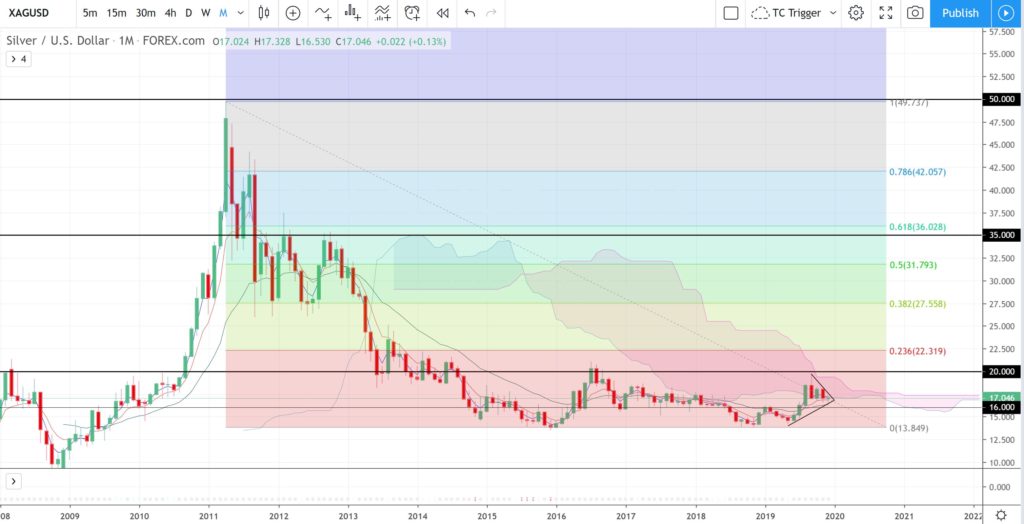
Silver monthly + fibs: any break and hold above $20 would bring $35 into focus, for me at least, as this is near the weekly 61.8% fib and is also previous S/R:
SLV: the Silver ETF might be an easier vehicle for some to trade if Silver does catch a new bid.
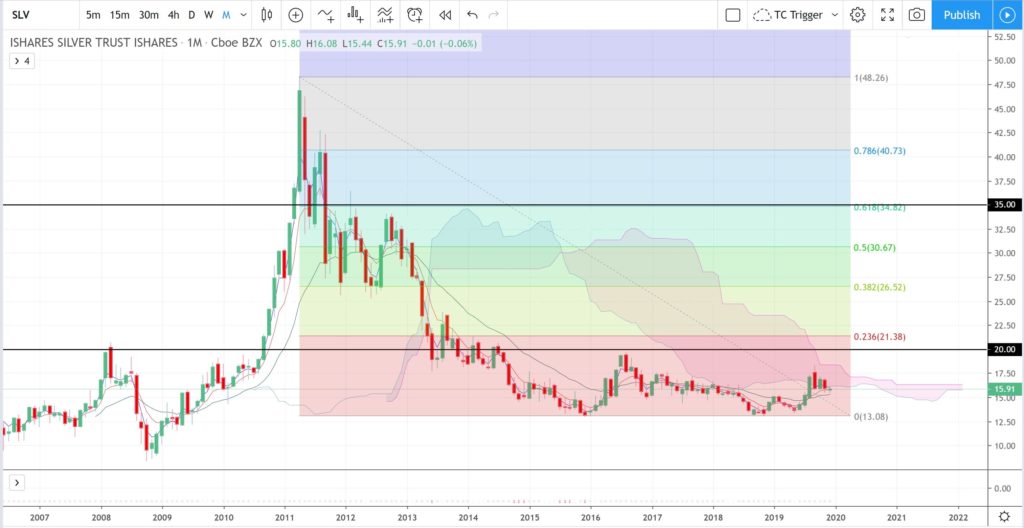
SLV monthly + fibs: note the same levels appear on SLV as for the spot metal. So, some might prefer to wait for a close and hold above $20, on SLV, to then target $35:
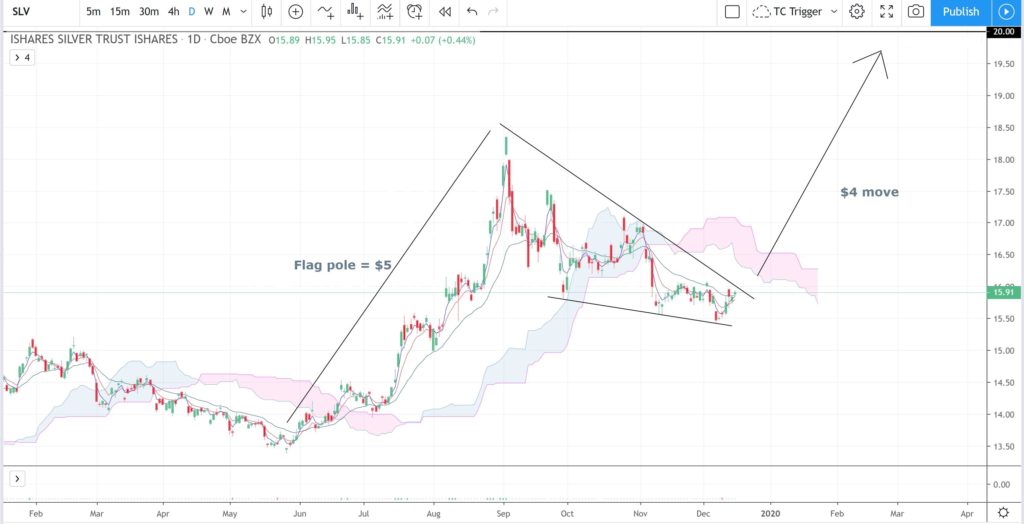
SLV daily: However, note the pattern on the daily chart! It looks a bit Bull Flag like. The Flag pole is about $5 and it would take a move of just less than this, on any Flag breakout, to reach this $20 S/R zone. Monitoring for any Bull Flag breakout might be worth the while too!
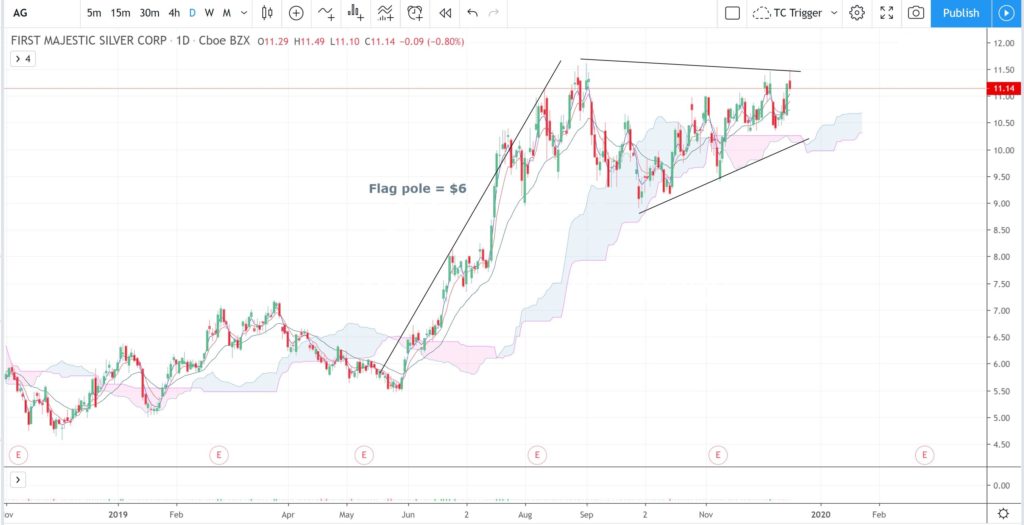
AG daily: this Silver stock is setting up with a possible Bull Flag as well so watch for any trend line breakout!
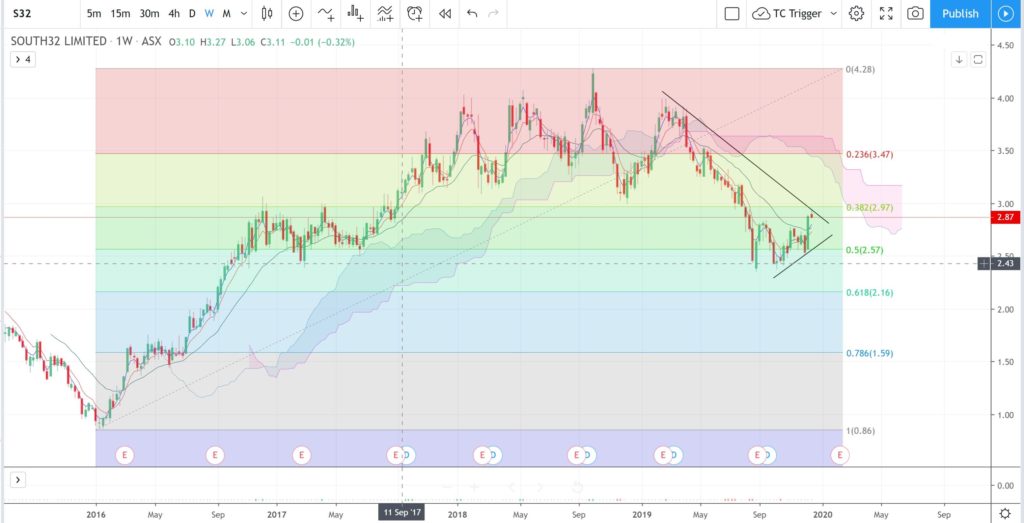
S32 weekly: this Silver stock is consolidating in a triangle for now so watch for any trend line breakout!


