There has been a bit of talk about Silver stocks potentially getting caught up in the WSB meme stock activity. With this in mind I thought I’d check in to see how the charts for the metal are shaping up; from a technical perspective.
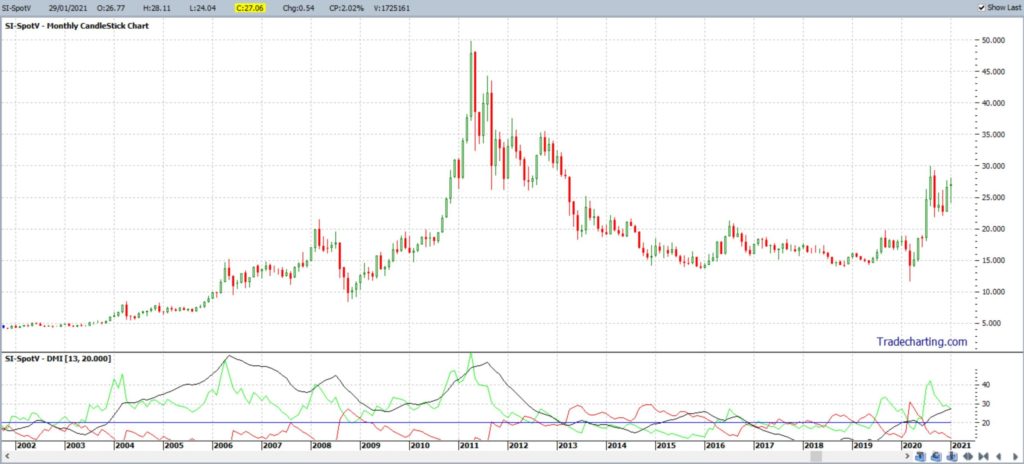
Silver monthly: Silver closed out January with a Doji style candle, one having a long lower shadow, and this type of candle reflects indecision. The long lower shadow reveals that sellers had some initial control but buyers made a decent comeback:
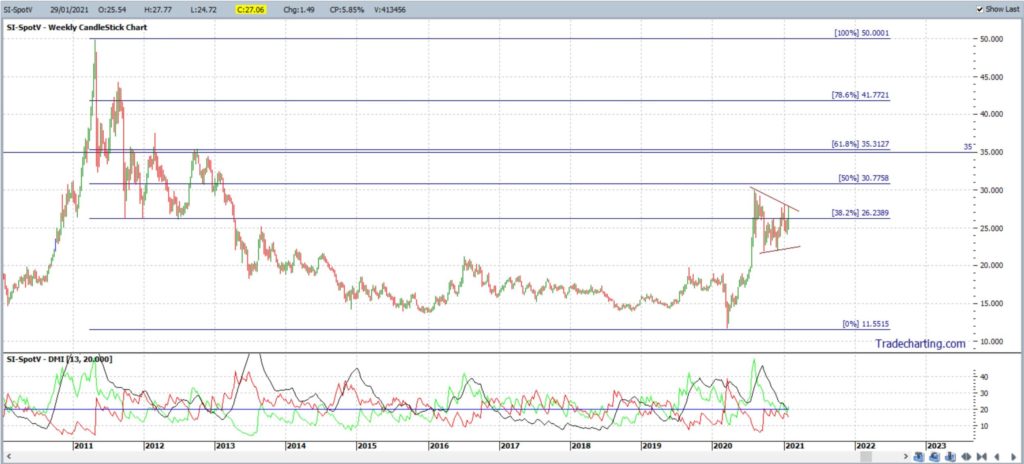
Silver weekly (expanded): this expanded weekly chart has a Fibonacci retracement tool applied and this maps from the High of 2011 to the Low of 2020. Note how the popular 61.8% Fibonacci level is near the $35 region and how this is also a zone of some decent reaction over the years. $35 would be one target level for any bullish continuation.
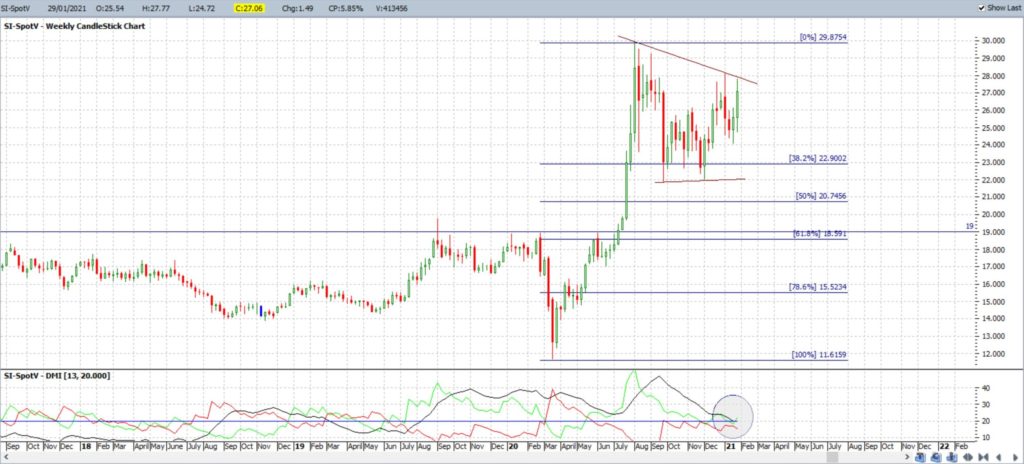
Price action looks to be in a Bull Flag of sorts so watch for any momentum breakout from this 6-month congestion pattern. The ADX indicator below reveals that ADX momentum is currently low and declining BUT note how the bullish +DMI is starting to edge upwards and is above the threshold 20 level:
Silver weekly: this close-up view of the weekly Flag has been overlaid with a Fibonacci retracement tool and this maps from the Low of March 2020 to the High of August 2020. Note how the popular 61.8% Fibonacci level is down near the $19 region which is also a zone of some decent reaction over recent months. $19 would be a target level for any bearish pullback.
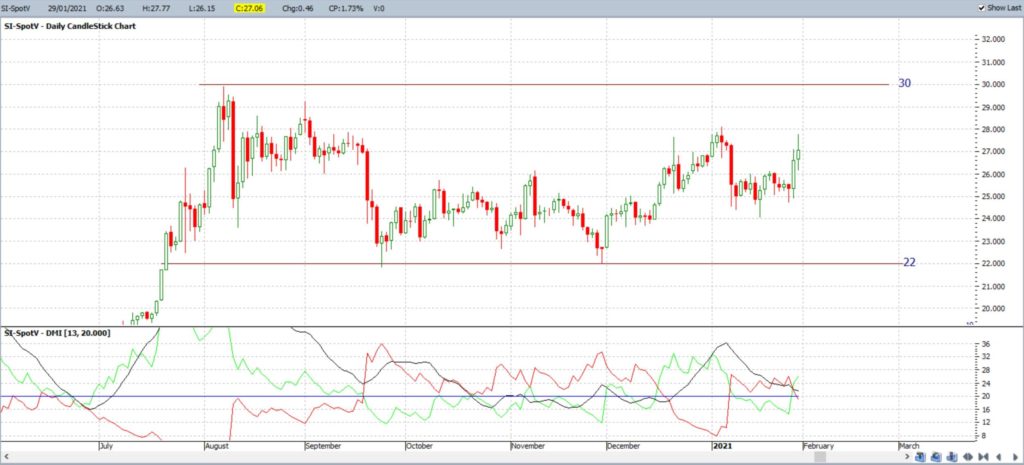
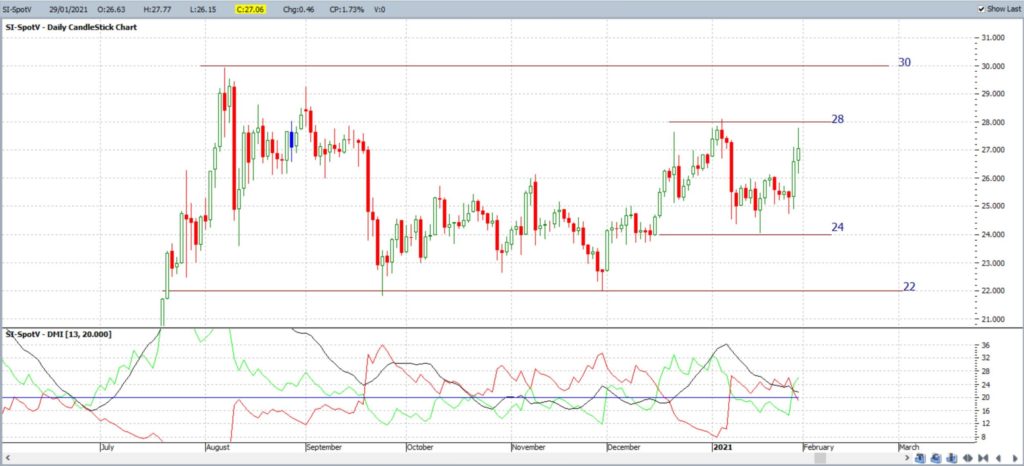
Silver daily: On this expanded daily chart I have identified the Horizontal Support and Resistance levels that stand out for me. The congestion pattern here is of about 6-months duration too; similar to the Bull Flag noted in the above charts.
The upper Resistance level to beat looks to be $30 and the lower Support level to beat looks to be $22.
There is a similar Momentum pattern here with overall ADX momentum declining but bullish +DMI momentum on the rise:
Silver daily: drilling down to some closer Support and Resistance zones identifies $28 above and $24 below.
Concluding Thoughts:
Silver metal is trading well below its all time High of circa $50 and has been on the rise since the $11+ Lows of March 2020. Price action has been experiencing broad and sideways consolidation for much of the last 6 months but weekly and daily chart bullish +DMI momentum is on the rise. Traders need to watch out for any uptick with the overall ADX momentum indicator. There are Bull Flag trend lines and specific Support and Resistance levels to monitor for any new momentum breakout: either up or down.
NB:
- The information on this blog is intended as educational and learning material only and should not be construed as Investment, Financial Product, or Trading Advice or as any form of Recommendation.
- The AIM of this site is to promote the theory and practice of technical analysis and to assist followers with becoming more knowledgeable and better able to apply technical analysis in their study of price action charts.
- This website does not constitute financial product advice and should not be taken as such.
- Traders MUST obtain their own private financial advice before engaging in any trading activity or making any decisions about the suitability of different financial products.
- Never trade with money you cannot afford to lose.
- Users of this website acknowledge that all Investment & Trading involves considerable Risk. Manage Your Risk Appropriately and Trade At Your Own Risk.


