I have been asked to review the charts of Silver Lake Resources Limited: Ticker: SLR.ASX. Despite the Silver in the name, the company is primarily involved in the exploration and production of gold and copper deposits within Australia. I start my technical chart analysis with a look at how Gold is performing and, then, offer a top-down view of the charts of SLR.
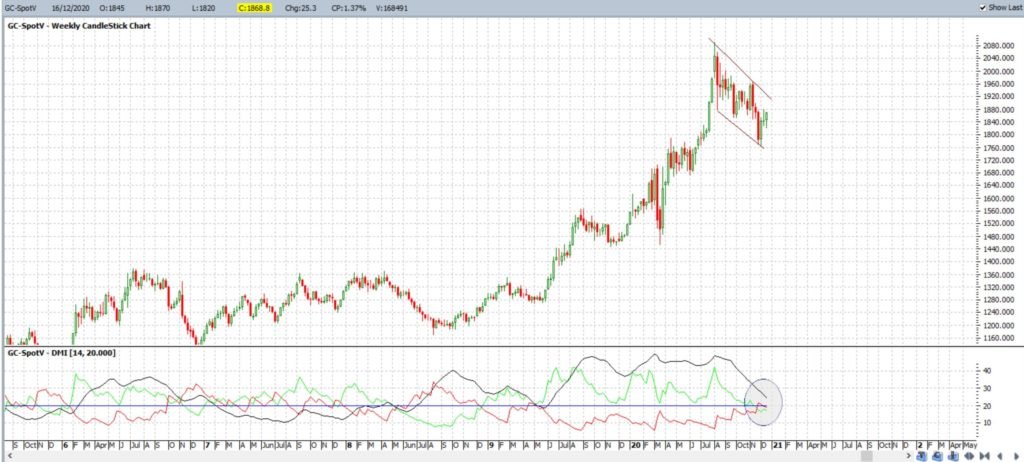
Gold weekly: the weekly chart shows that recent price action for Gold is that of consolidation within a bit of a Bull Flag style formation. Note how the ADX indicator also shows consolidation with the black ADX line trending lower. Traders would be best advised to watch for any Bull Flag trend line breakout that triggers with an uptick in the ADX above 20.
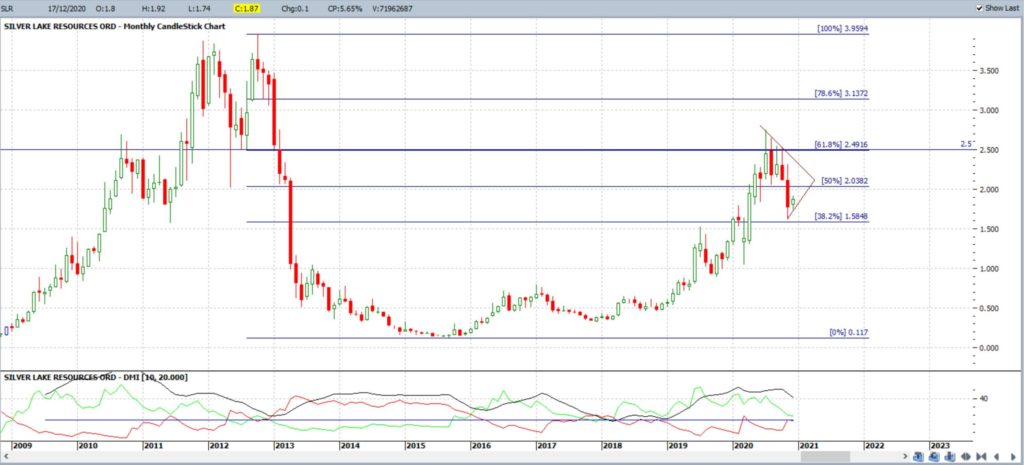
SLR monthly: The monthly chart of SLR shows a similar profile to that of Gold above; with a recent Bull Flag style formation. Note how the latest rally paused at the 61.8% Fibonacci level; near $2.50. This is another one for the Fibonacci folk! Price action is consolidating within a Bull Flag style pattern on declining ADX momentum.
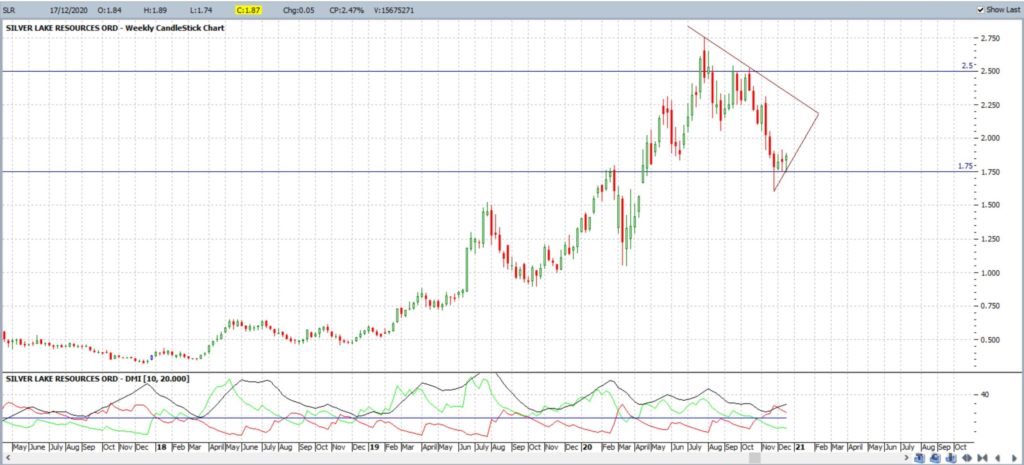
SLR weekly: the weekly chart reveals that momentum has been bearish of late BUT note also how the $1.75 seems to have held thus far. IMHO: this would be the support level to monitor here.
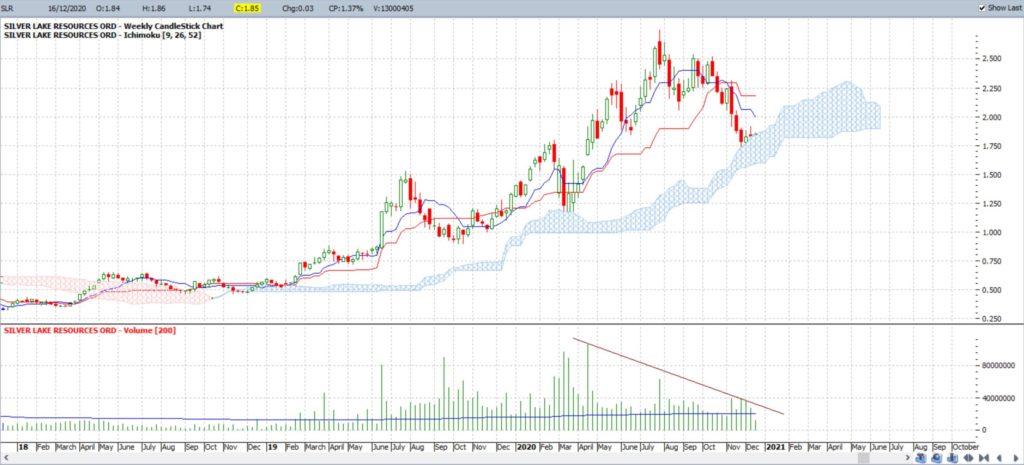
SLR weekly + Volume: there is also support from the weekly Ichimoku Cloud here:
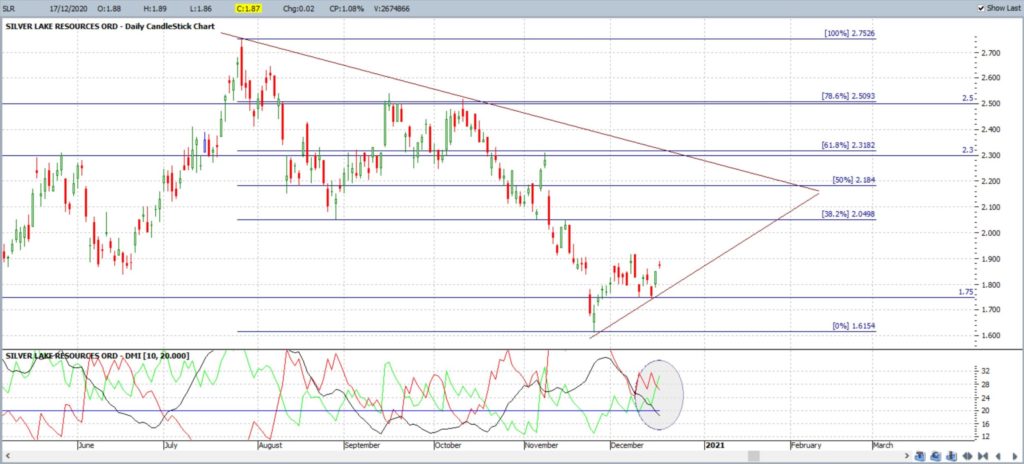
SLR daily: the daily chart reveals that bullish momentum (+DMI) is on the rise but this is yet to be supported by the ADX. Note how the 61.8% Fibonacci of this recent swing Low is up near $2.30 so that would be one bullish target followed by $2.50.
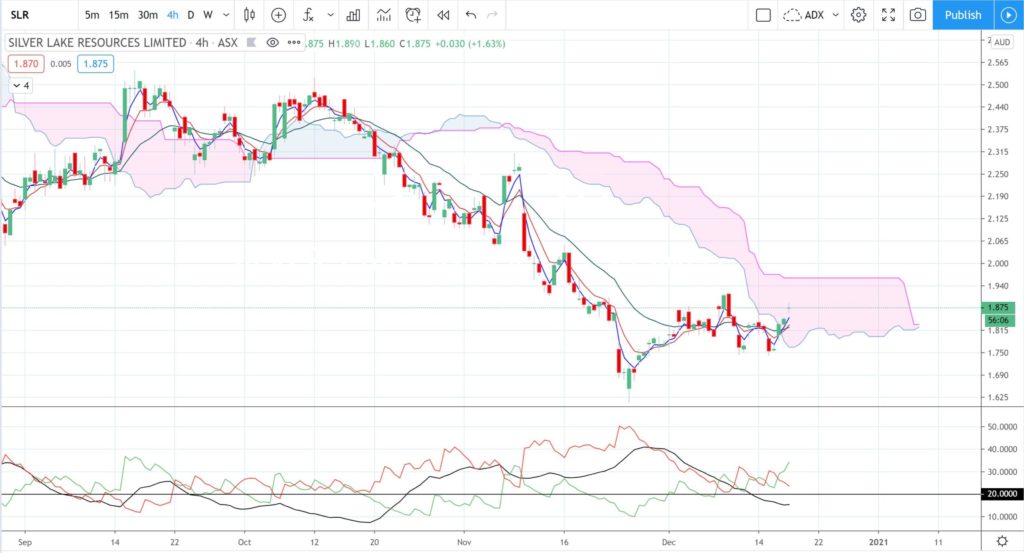
SLR 4hr: the 4 hr chart shows price action has edged up into the resistance of the 4hr Ichimoku Cloud. Any new close and hold above the 4hr Cloud would support a bullish continuation thesis. Note how the ADX remains below the threshold 20 level here for now. Watch for any new break above the 4hr Cloud that is supported by an ADX momentum move above 20. Bullish targets for SLR would be the daily chart’s 61.8% Fibonacci, near $2.30, followed by the monthly chart’s 61.8% Fibonacci, near $2.50.
Summing Up:
- SLR price action looks to be consolidating under the $2.50 level.
- $1.75 is recent Support and the level to watch.
- Price action looks to be trying to recover off the $1.75 level and any close above the 4hr Cloud would support a renewed bullish bias.
- Bullish targets for a break and hold above the 4hr Cloud are $2.30 and $2.50.


