A fellow trader recently claimed to a gathered trading group that the trading of Naked Puts is a VERY dangerous strategy. Another trader and I tried to inform them that the risk profile for Naked Puts is the same as that for Covered Calls but, sadly, to no avail. In this article I outline the Profit and Loss profile for each type of Option trade showing how the risk for each trade is, essentially, the same.
Definition of Terms: an understanding of the following terms would be useful before reading this article:
- Option: an agreement between two parties to facilitate a transaction on a a security at an agreed price at an agree time.
- Option Contract size: 100 shares.
- Strike Price: the ‘agreed price’ of a security negotiated in an option contract.
- Call Option:
- Call buyer: has the right, but no obligation, to buy a security for an agreed price at an agreed time.
- Call seller: has the obligation to sell a security for an agreed price at an agreed time.
- Put Option:
- Put Buyer: has the right, but no obligation, to sell a security for an agreed price at an agree time.
- Put Seller: has the obligation to buy a security for an agreed price at an agreed time.
- Option Buyers: have rights.
- Option Sellers: have obligations.
Assumptions: There are a couple of assumptions made in this article:
- Trade commissions: for the sake of simplifying the maths in the explanation trade commissions have not been included.
- Option expiry: all Options in this article are assumed to trade to expiry. In reality, experienced Option traders might ‘roll’ their trades to avoid assignment but this strategy is not considered in this article.
- Strike Price: for the sake of direct comparison: both of these trade use Options at the same Strike Price. Also, the strike prices used are at the the same price as the stock price and this is refereed to as At The Money (ATM). In reality though, CSNP traders might sell their Options at a strike price lower than the current stock price, referred to as Out of the Money (OTM), in an effort to get some downside protection.
Covered Call
A Covered Call is a trade involving the sale of a Call Option over an owned stock. Selling an Option gives the seller obligations whereas buying an Option gives the buyer rights.
Example: Here is an example of such a trade using a stock, XYZ, priced at $20.
NB: Option trades operate on bundles of 100 shares of stock; that is buying or selling one Option contract requires 100 shares of stock. So these examples use a bundle of 100 shares.
Stock purchase: The trader will buy 100 shares of $20 XYZ stock. This total cost is 100 x $20 = $2,000.
Sold Call Option: The trader will sell a Call option at the strike price of $20. For this sale they receive $2 per share. The total premium received = 100 x $2 = $200.
Why would someone want to do this? They do this to earn regular premium on stocks they may already own or on stocks they plan to buy to trade purely to gather Option premium.
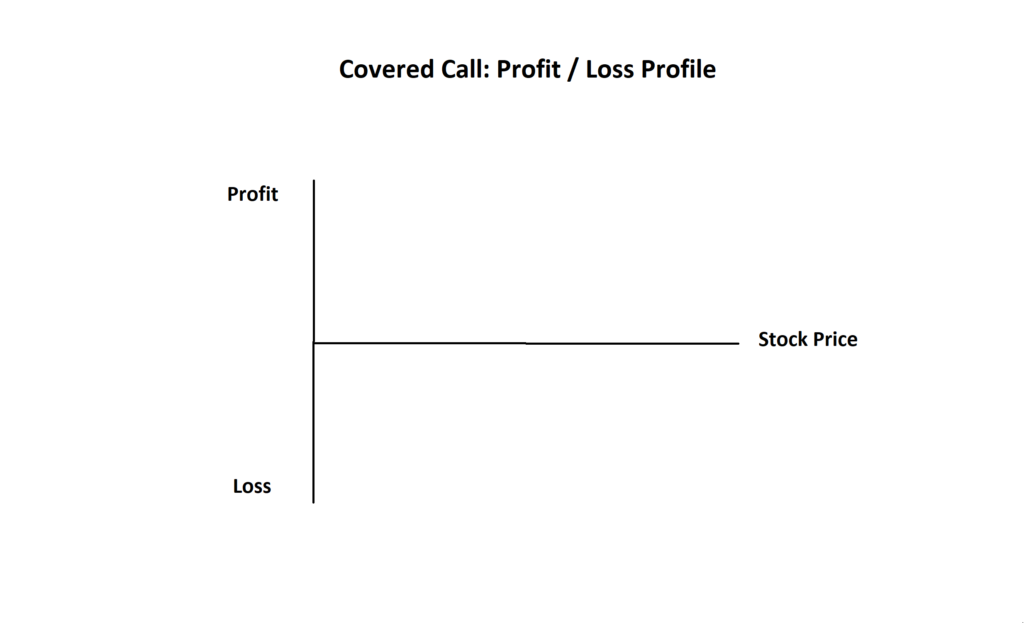
To map the Profit and Loss with this trade we need to consider the profile below:
- The Horizontal X axis maps the stock price.
- The vertical Y axis maps the Profit and Loss.
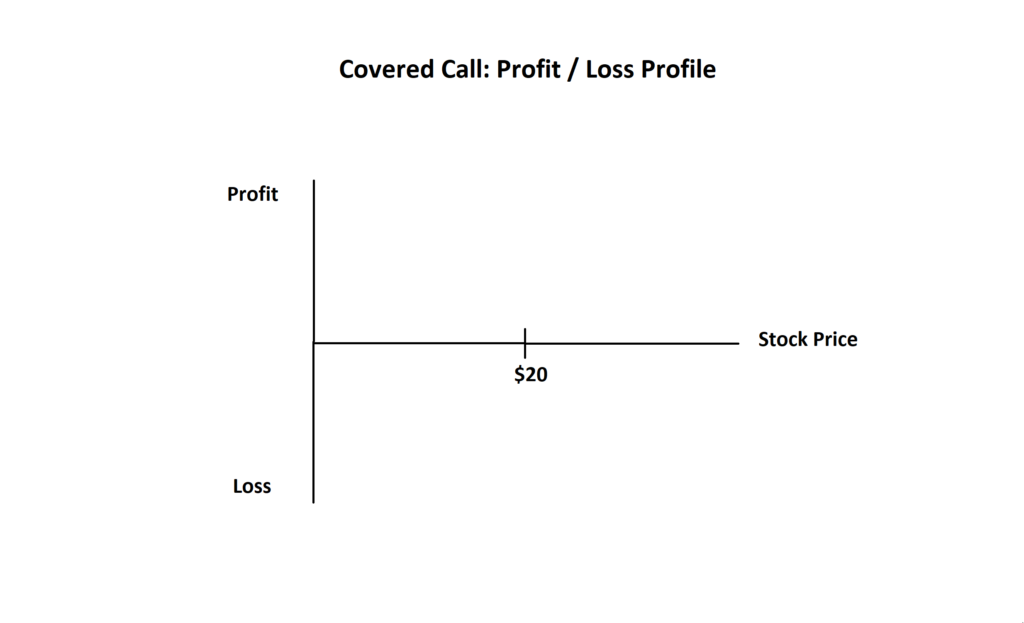
On the chart below I have updated to note the share price of the stock along the X axis continuum.
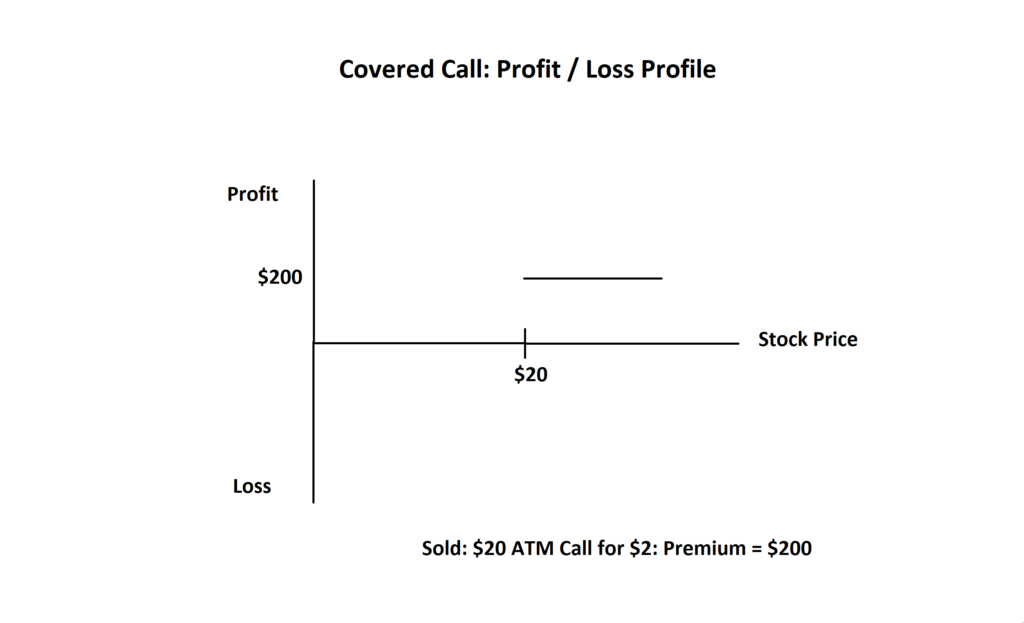
This next chart shows the maximum profit the trader can achieve through the sale of the $20 Call Option over their 100 shares. The premium received for this trade was was $200: $2 per share x 100 shares.
There are two main scenarios that can result with this Option trade:
1. Stock at or above $20 at end of Option contract: If, at the end of the contract time, stock XYZ is $20 or above then the trader would have the stock called away from them and they would be left with their $200 premium as profit. Note the horizontal line marking the maximum profit for this trade as $200.
The second scenario is a follows:
2. Stock below $20 at end of Option contract: If, at the end of the contract time, stock XYZ is below $20 then the trader keeps the stock, and can then go on to sell more Call Options, but they also keep the $200 premium as profit.
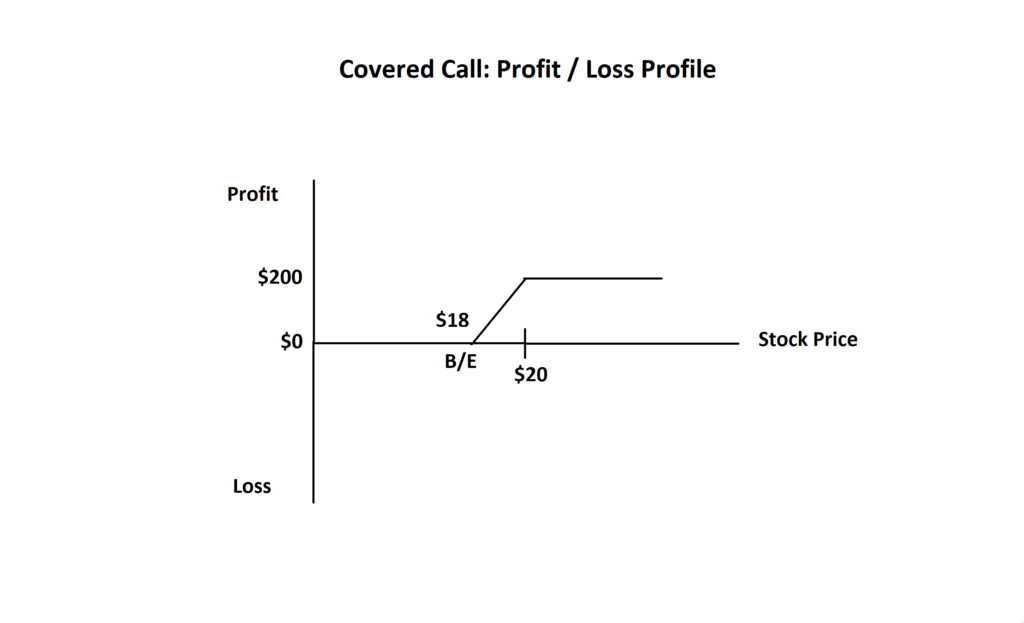
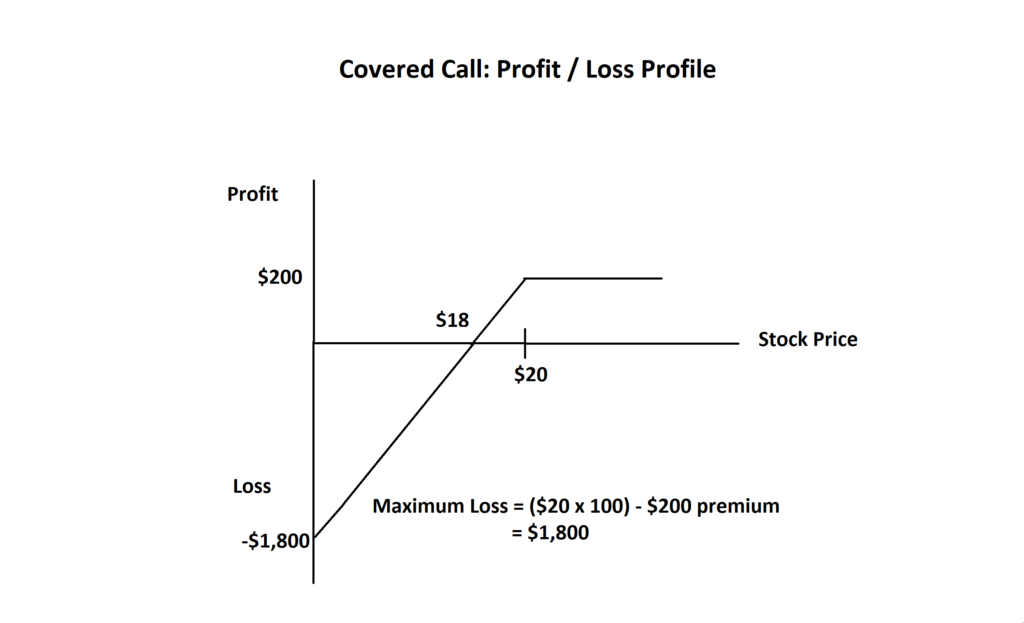
The next part of this profile to map is the Break Even point. This is the point where there is no profit but no loss. The stock was purchased for $20 but the trader received a $2 premium per share for selling the Call Option. Thus, the break even point is $20 – $2 =$18. If the stock falls below the $20 strike price there will be a sliding scale of loss but there will be a point at which the trade reaches break even. Note, on the graph below, how if the price of the stock declines to $18 at the end of the Option contract then the trade is break even or $0 Profit/Loss.
The next part of this Profit Loss profile is to map out the worst case scenario for maximum loss. This would be the situation where your $20 stock goes to $0.
Your maximum loss is calculated by calculating the money spent to buy the stock and subtracting the Premium received for the Option trade.
Maximum Loss = ($20 stock cost x 100 shares) – ($2 Premium x 100 shares)
= $2000 – $200
= $1,800.
The profile below shows that as stock price falls then the loss increases. The intersection of these two lines, the graph line with the axis, would be at -$1,800:
Summing Up:
Maximum Profit:
- Option Premium received.
- For this Covered Call trade = $200
Maximum Loss:
- (Stock price x No of shares) – Option Premium received.
- For this Covered Call trade = $1,800
Cash Secured Naked Put
A Naked Put is a trade involving the sale of a Put Option on a stock that is not owned. However, the seller will need to have the cash in their account to cover the cost of the stock and the value being traded. This is why these trades are referred to as Cash Secured Naked Puts (CSNP).
As noted above, selling an Option gives the seller obligations whereas buying an Option gives the buyer rights.
Example: Here is an example of such a trade using a stock, XYZ, priced at $20. The Option trader does not need to own the stock but they need cash in their account to cover the cost of XYZ.
Sold Put Option: The trader will sell a Put option at the strike price of $20. For this sale they receive $2 per share. The total premium received = 100 x $2 = $200
When selling a Put Option the seller has the obligation to buy the stock if the stock is at or below the Strike price at the end of the Option contract.
Why would someone want to do this? They do this to earn regular premium. Some traders do this to try and buy a stock at a discount to its current trading price.
Note how in this trade there is only one trade transaction but how with the Covered Calls there were two: the buying of the stock and selling the Call Option. Thus, CSNP trades are cheaper to initiate than Covered Call trades.
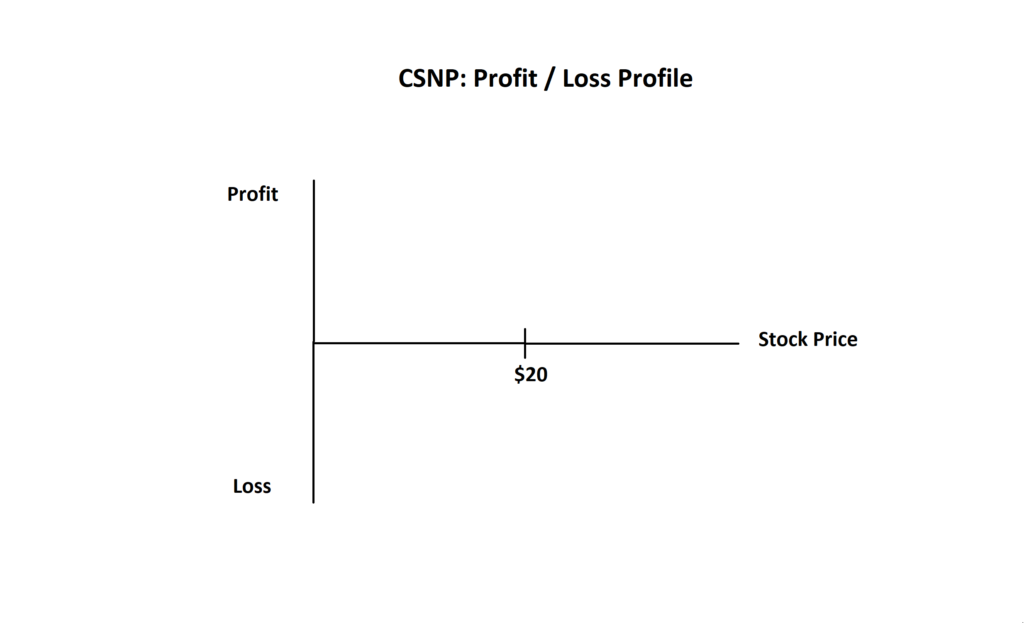
On the chart below I have noted the share price of the stock along the continuum.
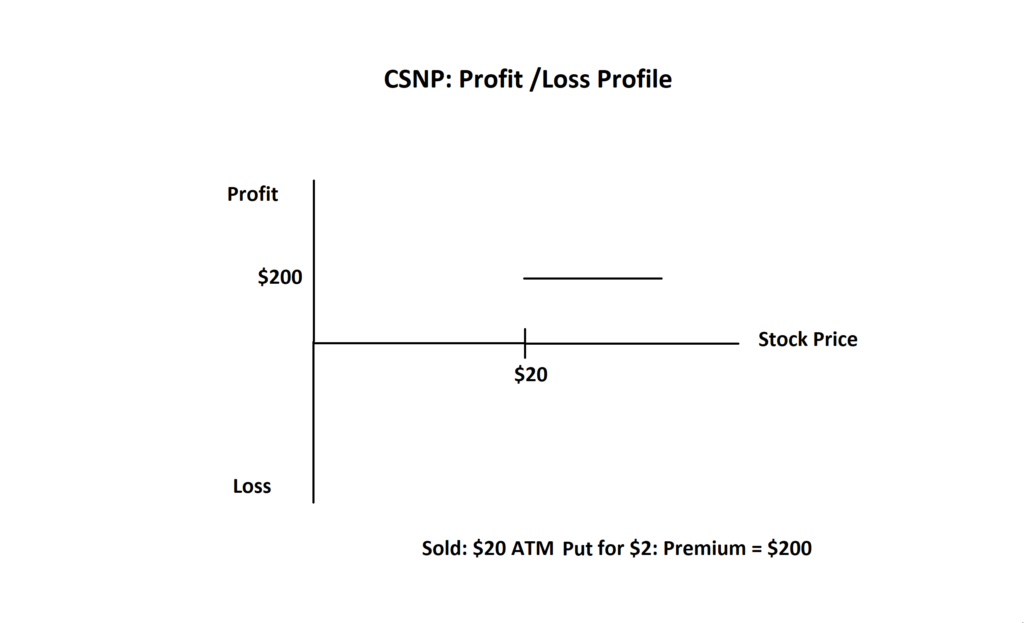
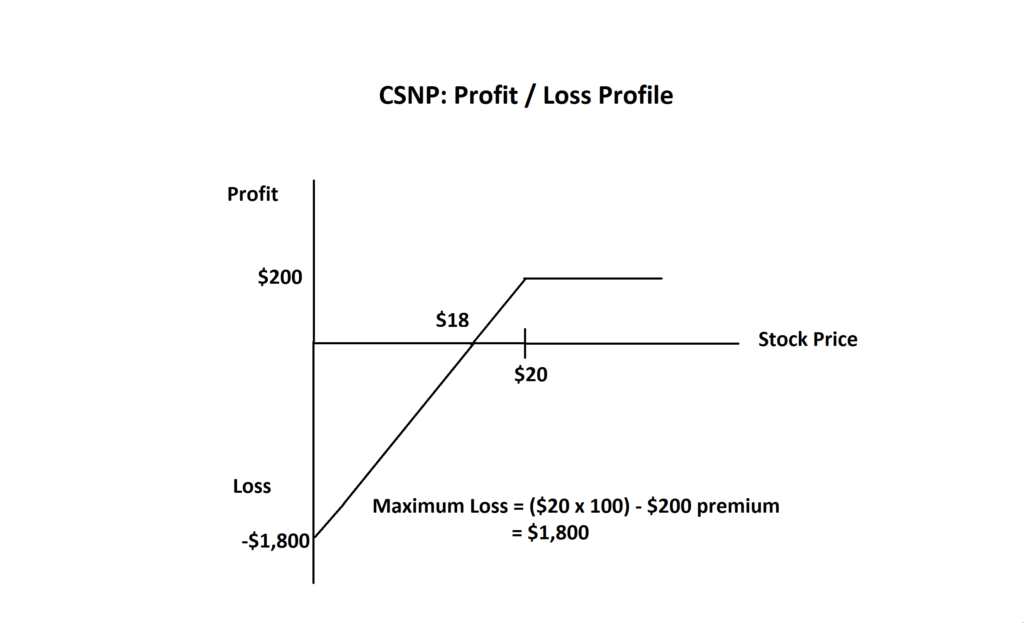
This next chart shows the maximum profit the trader can achieve through the sale of the $20 Put Option over XYZ stock. The premium received for this trade was was $200: $2 per share x 100 shares.
There are two main scenarios that can result with this Option trade:
1. Stock above $20 at end of Option contract: If at the end of the contract time stock XYZ is above $20 then the trader would not have to buy the stock and they would be left with their $200 premium as profit. Note the horizontal line marking the maximum profit for this trade as $200.
The second scenario is a follows:
2. Stock at or below $20 at end of Option contract: If at the end of the contract time stock XYZ is at or below $20 then the trader would be assigned the stock for the strike price of $20, even if the actual price is below this value. They also keep the $200 premium as profit.
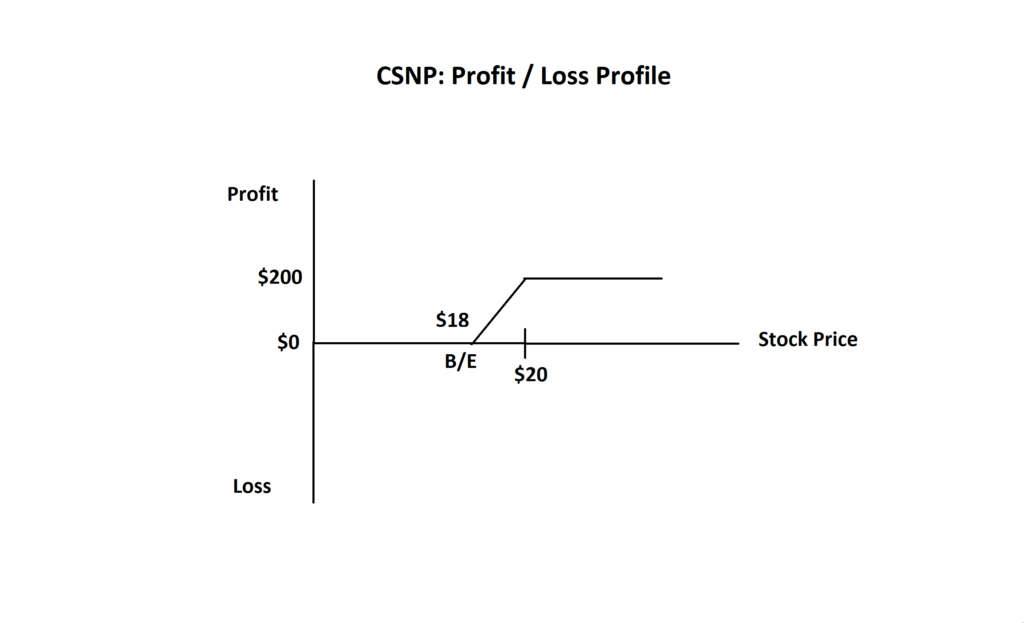
The next part of this profile to map is the Break Even point. This is the point where there is no profit but no loss. If the stock falls below the $20 strike price there will be a sliding scale of loss but there will be a point at which the trade reaches break even.
The Option trader received a $2 premium per share for selling the Put Option. Thus, if the stock was to fall $2 below the $20 strike price then the trade would end at break even. The break even point is $18= $20 -$2.
Note, on the graph below, how if the price of the stock declines to $18 at the end of the Option contract then the trade is break even.
The next part of this Profit / Loss profile is to map out the worst case scenario for maximum loss. This would be the situation where you were assigned the stock at a price of $20 but the stock falls to $0.
Your maximum loss is calculated by calculating the money spent to pay for the assigned stock and subtracting the Premium received for the Option trade.
Maximum Loss = ($20 cost of assigned stock x 100 shares) – ($2 Premium x 100 shares)
= $2000 – $200
= $1,800.
The profile below shows that as stock price falls then the loss increases. The intersection of these two lines, the graph line with the axis, would be at -$1,800:
Summing Up:
Maximum Profit:
- Option Premium received.
- For this CSNP trade = $200
Maximum Loss:
- (Cost of assigned Stock price x No of shares) – Option Premium received.
- For this CSNP trade = $1,800
Conclusion: In this article I have illustrated how the risk profile for a Covered Call trade and Cash Secured Naked Put trade is essentially the same.
The trader who commented to our group that Naked Put trades were very risky was not entirely wrong though. I would add to this however, that ALL trading is risky BUT it is how you manage your risk that matters. No one can guarantee the outcome of a trade; the ONLY aspect of a trade that can be managed is the risk exposure and that is entirety up to the individual trader.
There is a common saying among experienced Option traders that you should only trade Options on stocks you would be prepared to own, and, at strike prices that you would be happy to own them. This is one filter that some Option traders use for selecting their candidates but there are many others.
The individual trader needs to create, and then manage, their own stock selection criteria for what ever type of trading they carry out; that might be Buy and Hold, Covered Calls or CSNP.
I reiterate: It is not the trading strategy that is risky; it is how the individual trader selects their trading instruments (Stocks, Forex & CFDs etc) and then manages their trading strategy (Stock, Options or Futures etc).
On this note I’ll finish with a Tweet I found on Twitter this weekend. This guy summed it all up:
Some useful links: for traders wishing to learn more about trading / investing using Covered Calls or CSNP:
Covered Call / CSNP Group: this is a free online group run out of the USA where the focus is on US stocks and Options:
- Run: by Mike Artobello
- Link to website: here
Covered Call / CSNP Candidates: this is a popular resource used by many US Option traders as it focuses on stocks with good dividend history:
- US Dividend Champions: here
A group member presentation: by Paul Grems Duncan:
- Link to 100 min video presentation: here
- Accompanying notes: here


