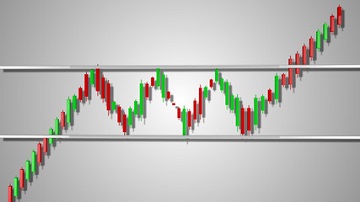
One of my followers recently asked me to better explain what I meant by the phrase ‘watch for any trend line breakout‘ and this article is an attempt to outline what I mean when I promote this strategy. The material in this article is educational and intended to help traders and investors identify momentum-based breakout opportunities.
For those of you visiting my site for the first time I would advise that you refer to my earlier articles where I explain my Trade Charting approach to Technical Analysis, the importance of understanding Support and Resistance and Fibonacci and how I use ADX momentum to evaluate trend line or range breakout trading opportunities.
The strategy of monitoring for a momentum-based trend line breakout can be applied to any time frame. The overall strategy involves applying trend lines, or support and resistance levels, to one time frame and, then, dropping down to a lower time frame to monitor for any new breakout move. The advantage of dropping down to a lower time frame to monitor for any new breakout means that often the move can be caught with the application of a smaller STOP.
Some traders might monitor weekly chart patterns and, then, drop down to the daily chart to watch for clues about any new breakout. The two examples below show chart patterns profiled on the 4hr time frame but then monitored for any new breakout on the 30 chart time frame.
EUR/USD
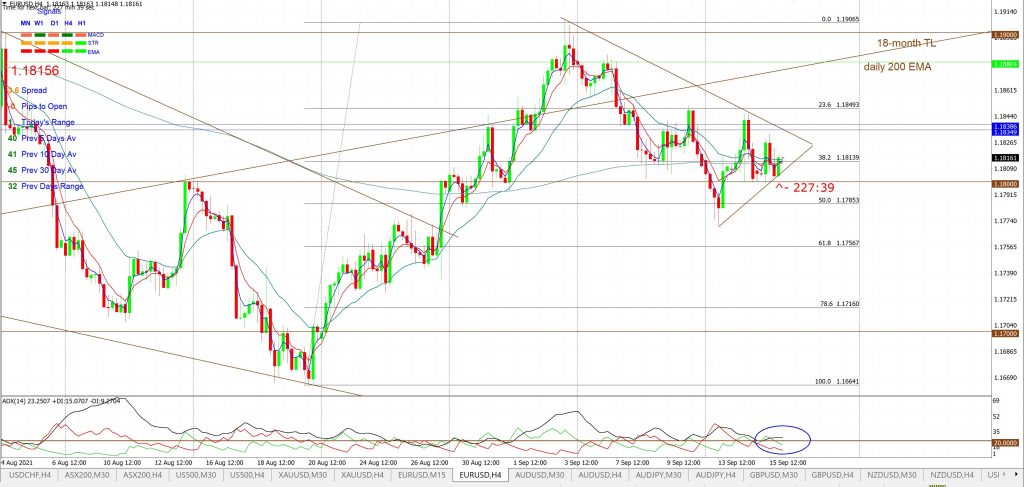
EUR/USD 4hr: the chart below was posted for my subscribers on Thursday 16th September 2021, prior to the release US Retail Sales data. I had urged traders to watch for any new trend line breakout:
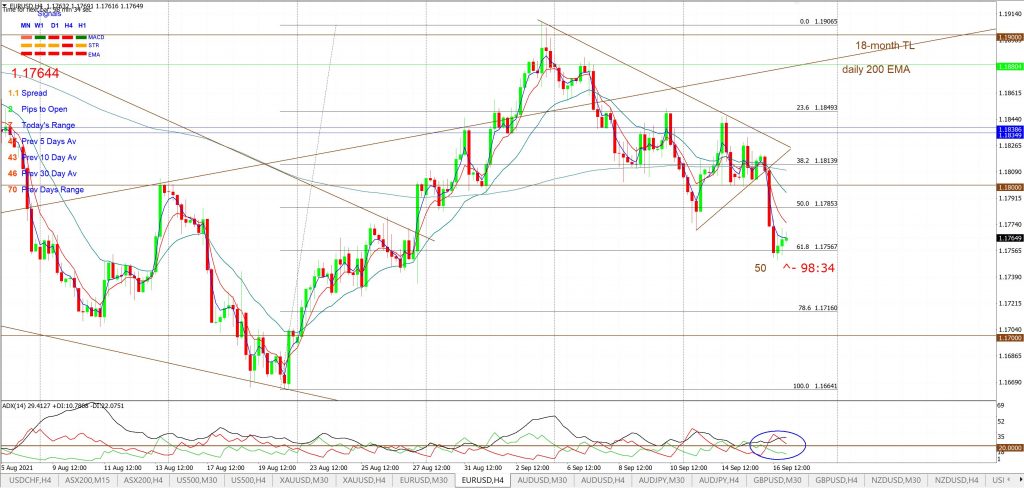
EUR/USD 4hr: this was the chart as of the next day, on Friday 17th September, showing that there had been a trend line breakout. This move was supported by a strengthening US$ following upbeat US Retail Sales data. Note where price action paused though! Right at the 61.8% Fibonacci retracement of the recent swing High move:
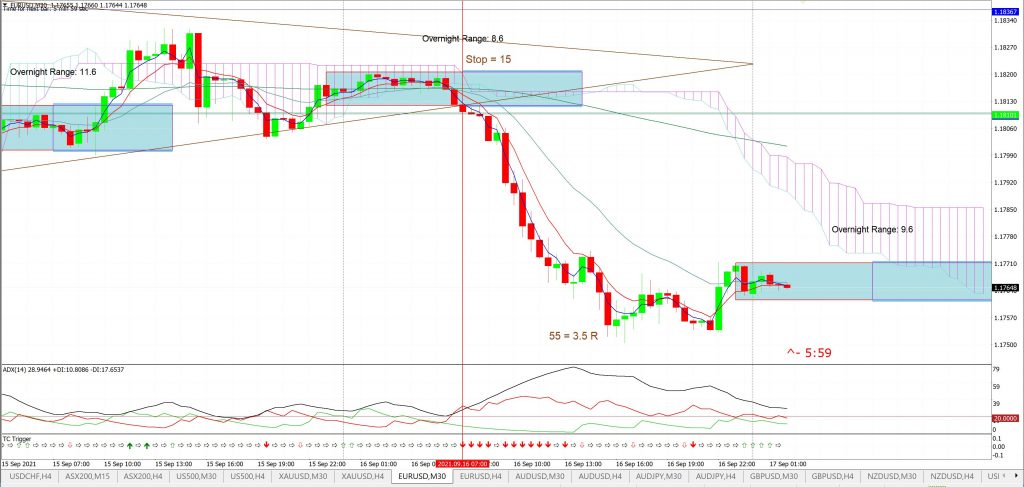
EUR/USD 30 min: the 30 min chart below shows how this trend line breakout triggered at the end of the Asian trading session. The Asian trading range is roughly shown in the first rectangular blue box and the early European session is roughly shown in the second rectangular blue box.
Note how the ADX indicator, in the lower pane of the chart, gave a good clue about the bearish momentum supporting this bearish trend line breakout: The ADX (black line) trended upwards and the bearish DMI (red line) rose above 20. The Risk for this trade was 15 pips and the maximum move was 55 pips giving a Return on Risk of around 3.5 R:
Gold
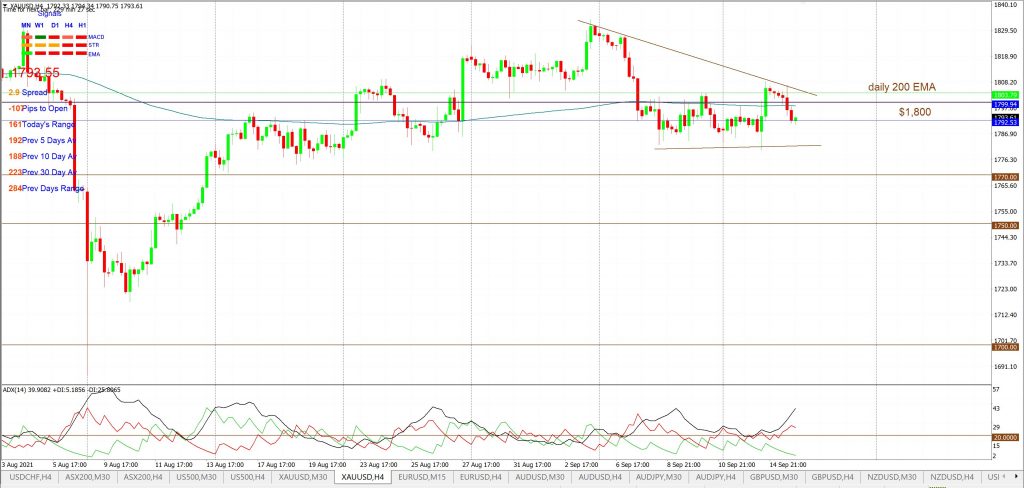
Gold 4hr: the chart below was also posted for my subscribers on Thursday 16th September 2021, prior to the release US Retail Sales data. I had urged traders to watch for any new trend line breakout:
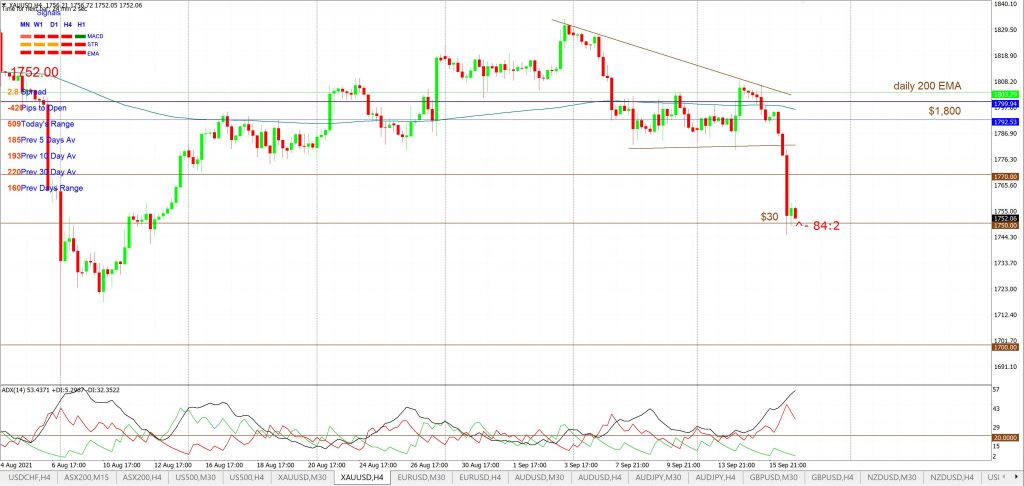
Gold 4hr: this was the chart as of the next day, on Friday 17th September, showing that there had been a trend line breakout. This shift was also supported by the strengthening US$ following upbeat US Retail Sales. Price action paused at the S/R level of $1,750:
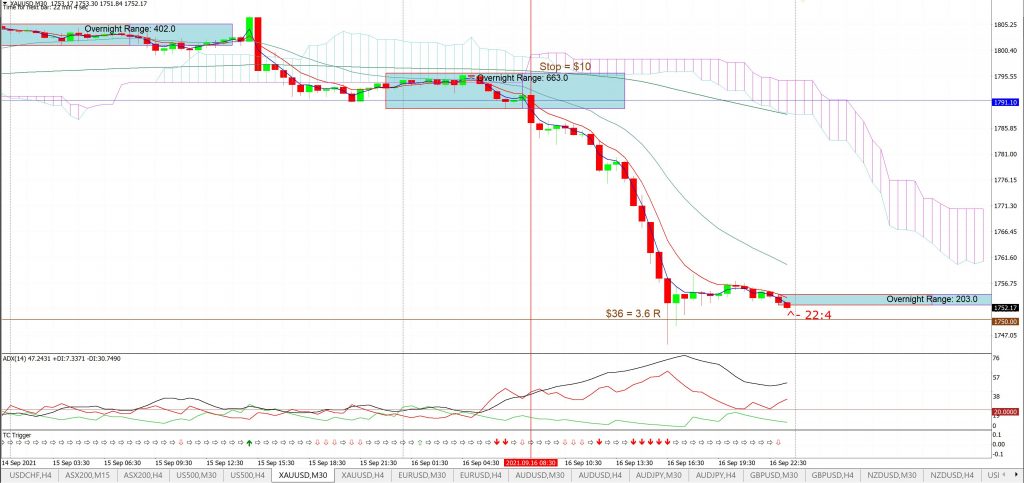
Gold 30 min: the 30 min chart below shows that there was a great range breakout opportunity at the end of the Asian trading session. Note how the ADX indicator also gave a good clue here about the bearish momentum supporting this bearish range breakout: The ADX (black line) trended upwards and the bearish DMI (red line) rose above 20 and trended higher. The Risk for this trade was about $10 and the maximum move was around $36 giving a Return on Risk of around 3.6 R:
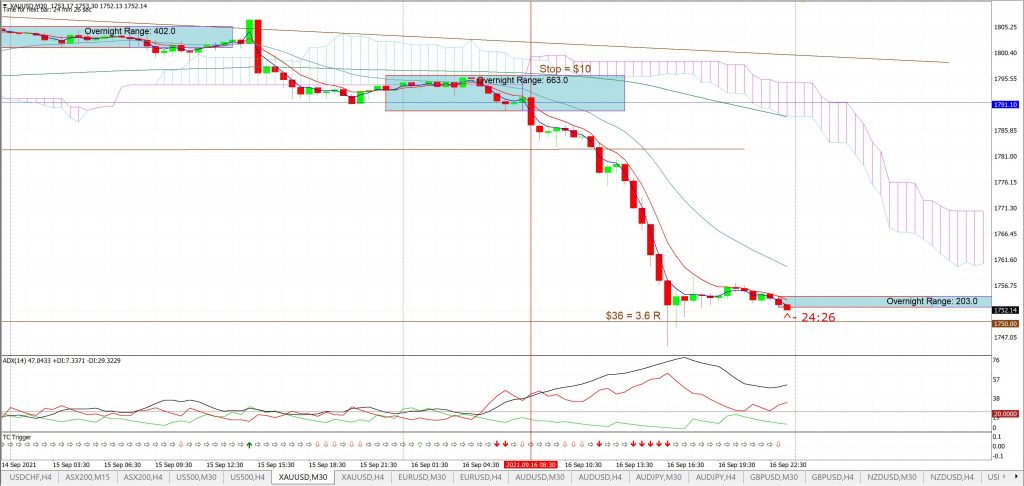
Gold 30 min: this 30 min chart shows the 4hr chart trend lines and that waiting for a trend line breakout would have worked here as well. However, the initial Stop value would have needed to be larger which would have impacted the Return on Risk value:
Final comments: There are many varied and successful technical trading strategies. The educational material offered in this article promotes one such method of monitoring for any momentum-based trend line breakout. This involves the application of trend lines, and / or support and resistance levels, to one time frame chart and then monitoring a lower time frame chart for any new momentum-based trend line breakout.
As always, traders need to manage their initial RISK and to only ever trade with funds you can afford to lose.


