Last week: There were seemingly paradoxical moves last week with US stock indices displaying a risk-on shift whilst the US posted the worst unemployment data since the 1930s Great Depression and with the BoE forecasting potential of the worst recession for the UK in over 300 years. There are multiple reasons offered for this latest stock move but I still consider the next few weeks might be pivotal in helping traders to understand whether this recent bullish shift is a V-shaped recovery or a dead cat bounce.
Technical Analysis: As noted over recent weeks, it is important to keep in mind that this analysis is Technical and chart-based but that any major Fundamental news items, as recently seen with Coronavirus, have the potential to quickly undermine identified chart patterns. This is why it is critical that traders appropriately manage their trade exposure and risk per trade during these volatile market conditions.
Trend line breakouts and TC signals: There were a few Bull Flag-style breakouts last week but it was generally slim pickings apart from that. Articles published during the week can be found here, here, here and here:
- AUD/USD: a Bull Flag style TL b/o move for 100 pips:
- AUD/JPY: a Bull Flag style TL b/o move for 120 pips.
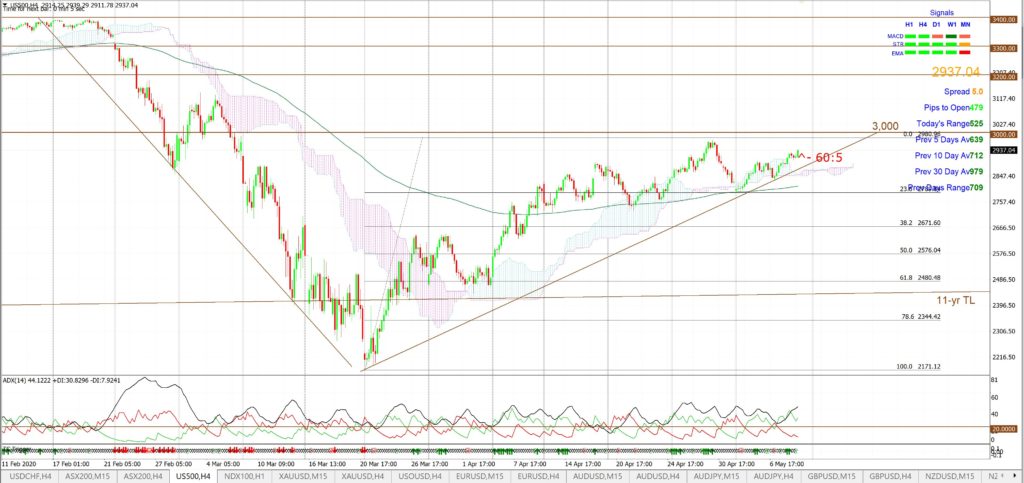
- S&P500: a Bull Flag style TL b/o for 60 points:
This Week: (click on images to enlarge):
-
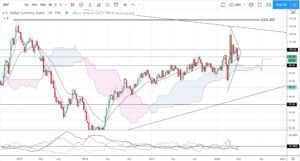
- DXY: US$ Index: The US$ index closed with a bullish weekly candle but remains under the key 100 level and still trading on low levels of momentum. A more detailed analysis of the FX Indices can be found through this link:
DXY weekly:
-
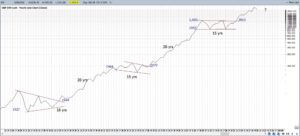
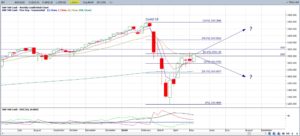
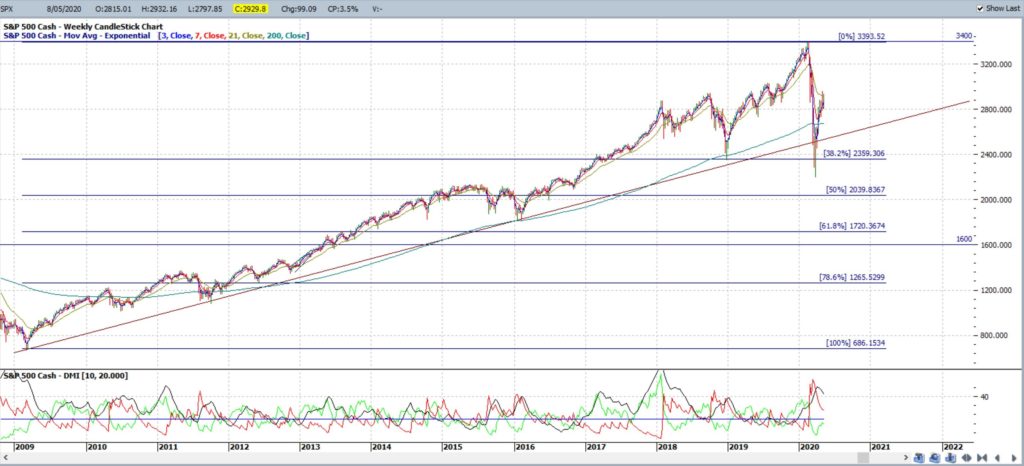
- S&P500: Keep the bigger picture in perspective with this recent pullback:
S&P500 yearly: keep this latest move lower in perspective:
-
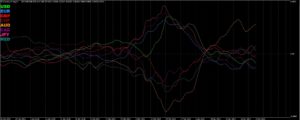
- Currency Strength Indicator: It is worth noting that the Aussie dollar is still punching above its weight:
Currency Strength Indicator (daily):
-
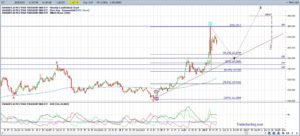
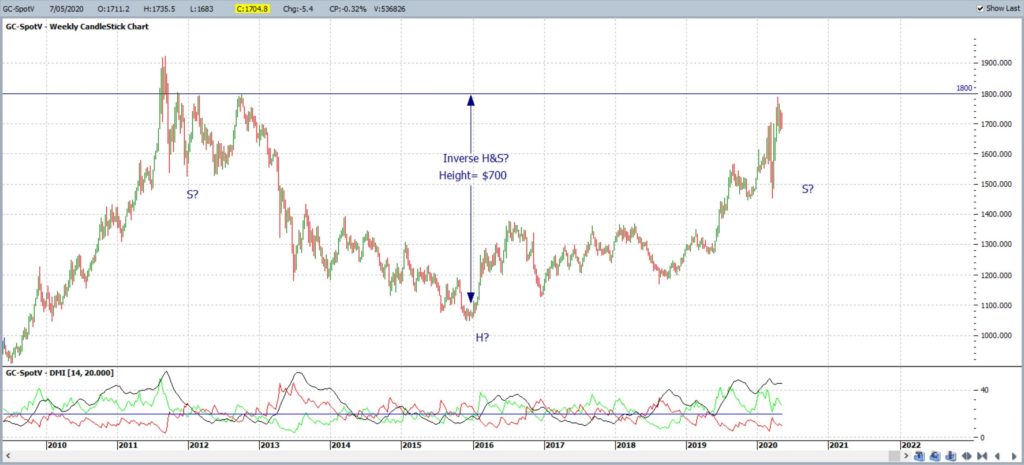
- Gold: is still shaping up in a weekly chart Inverse H&S so watch the $1,800 breakout level.
-
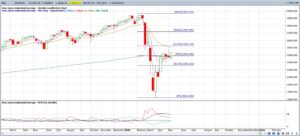
- DJIA weekly: The DJIA closed with a bullish weekly candle and still under the 61.8% Fibonacci so watch this level for any new make or break:
DJIA weekly:
-
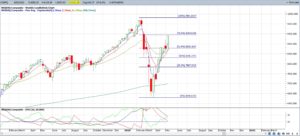
- NASDAQ composite: The NASDAQ Composite Index also closed with a large bullish, almost ‘engulfing’, weekly candle and is now in positive territory for 2020. Watch for any push to the previous all-time High, circa 10,000:
NASDAQ weekly:
-
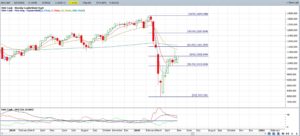
- DAX weekly: The DAX closed with a bullish weekly candle and back just under the 50% Fibonacci level so watch this region for any new make or break:
DAX weekly:
-
- Russell-2000: The Russell-2000 is often viewed as the ‘Canary in the Coal Mine’ for US stocks. The index closed with a bullish weekly candle and just under the 50% fib so watch this region for any new make or break:
RUT weekly:
-
- Bonds / TLT: The Bond ETF, TLT, closed with a bearish weekly candle as risk appetite improved and money flowed into stocks. Note the pullback that is still being suggested by the Elliott Wave indicator:
TLT weekly:
-
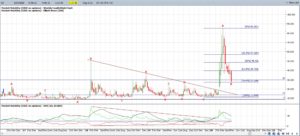
- VIX: the Fear index closed with a large bearish Engulfing weekly candle and back below the key 30 S/R level. Watch this region for any new make or break:
VIX weekly: watch 30 S/R for any new make or break:
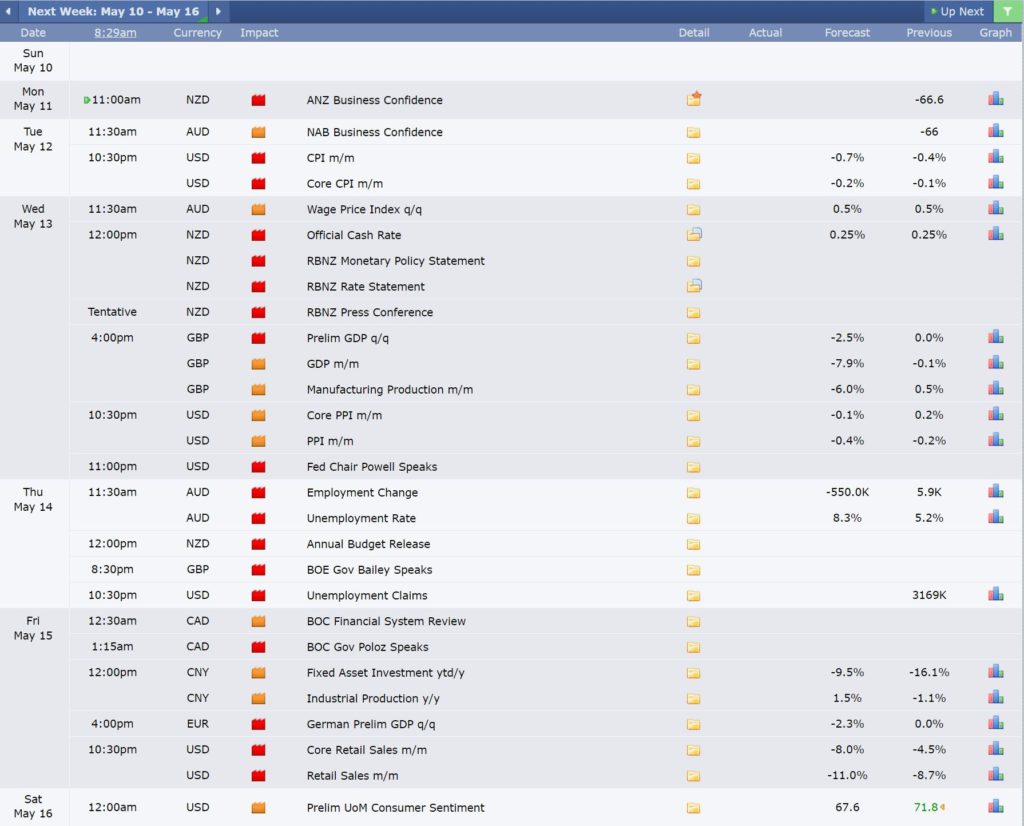
Calendar: Courtesy of Forex Factory: there is one Central Bank update: from the RBNZ (NZD):
Earnings: Courtesy of Earnings Whispers: another full and busy week:
Market Analysis:
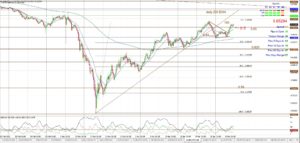
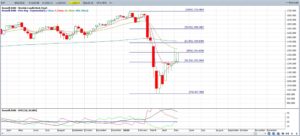
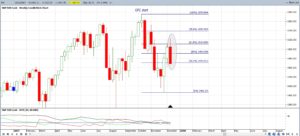
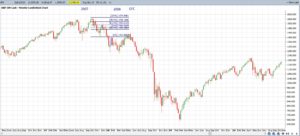
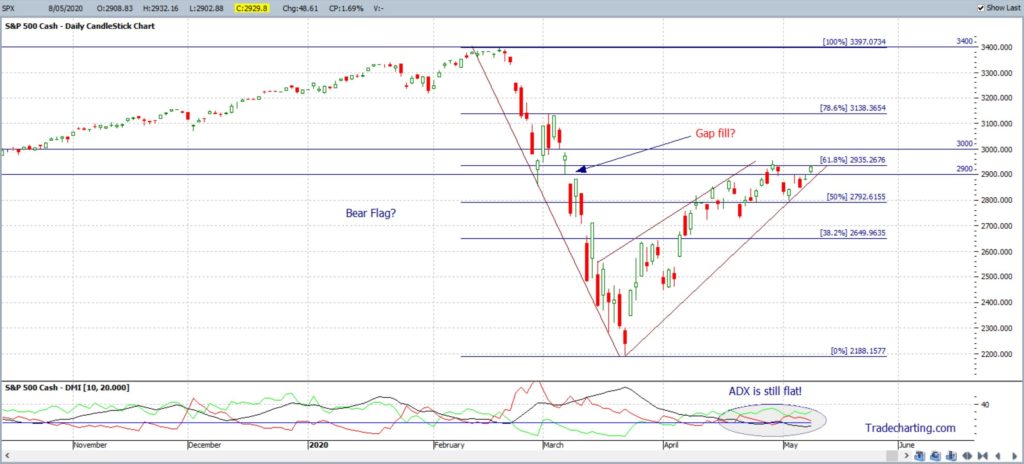
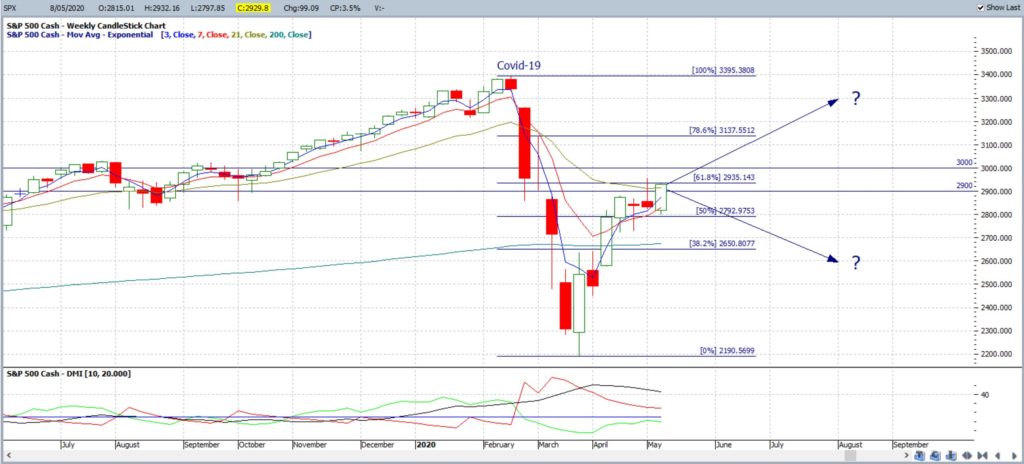
S&P500: SPX: The S&P500 closed with a bullish, almost ‘engulfing’, weekly candle and right up at the weekly chart’s 61.8% Fibonacci level. The big test will be to see where the next weekly candle closes following this bullish close at the key Fibonacci level. Back in the Global Financial Crisis (GFC) there was a bullish weekly candle close up under the weekly 61.8% Fibonacci before price closed bearish the following week and, then, continued to fall well away; as the following series of charts reveal:
S&P500 weekly & Covid-19: note there has now been a bullish candle close right up at the 61.8% region:
S&P500 weekly & GFC: note how the next weekly candle was bearish after the bullish weekly candle test of the 61.8% Fibonacci during the GFC:
Back in the GFC era, the S&P500 eventually moved much lower after this test of the 61.8% fib as the following statistics and chart reveal:
- S&P 500 high: 1565.15, Oct. 9, 2007
- S&P 500 low: 682.55, March 5, 2009
- S&P 500 loss: 56.4 percent
- Duration: 17 months
S&P500 weekly & GFC: price action moved lower after the first bounce and test of the 61.8% fib with the GFC:
As mentioned over recent weeks:
- The big question remains: Will current price action mirror that seen during the GFC? That is, will price action fall away now that there has been a bullish candle close right up under this 61.8% Fibonacci? No one can know for sure but the next couple of weekly candles will be critical to aid our understanding of what might be to follow.
- I am still watching for any broader pullback down to the 61.8% Fibonacci of the 2009-2020 swing High move and this level is down near 1,700 / 1,600. This is a region of some confluence as it is the previous upper level from the 2013 channel breakout. The 61.8% Fibonacci zone was also tested in the 1987 and GFC market pullbacks, as described in this post. For the moment though, the index has only pulled back to around 45% of this 2009-2020 swing High move so keep this move in perspective as technical theory would suggest the uptrend is intact until the 61.8% fib is broken!
There are revised trend lines on the 4hr chart to monitor for any new breakout.
Bullish targets: any bullish 4hr chart breakout above 3,000 would bring whole-numbers on the way back to 3,400 into focus.
Bearish targets: any bearish 4hr chart support trend line breakout would bring the recently broken 11-yr support TL back into focus as this is also near the 4hr chart’s 61.8% fib and, after that, the recent Low, near 2,200.
- Watch for any momentum-based 4hr chart trend line breakout:
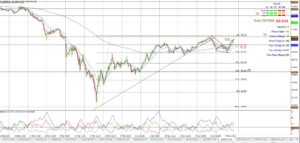
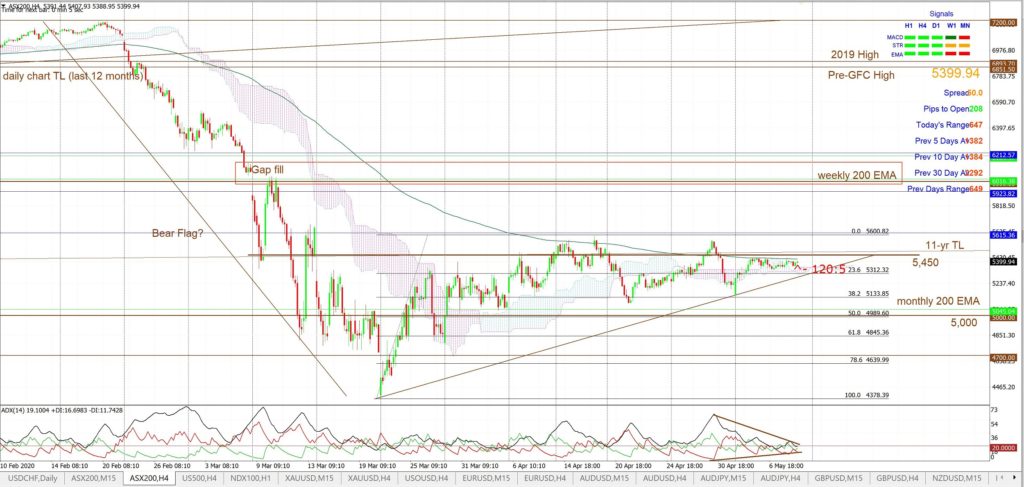
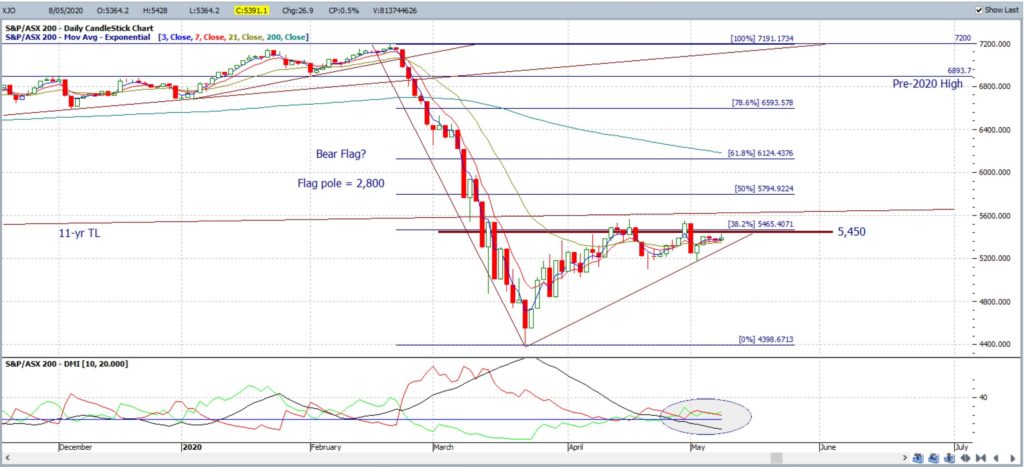
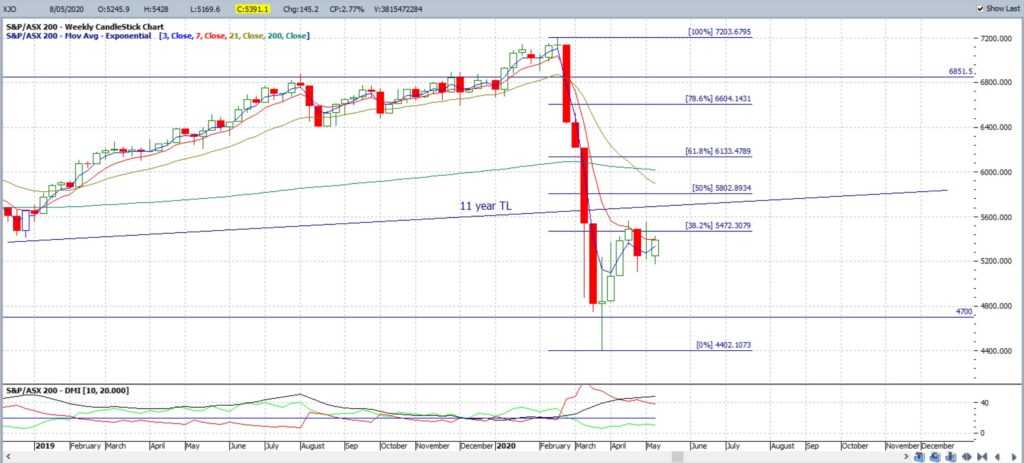
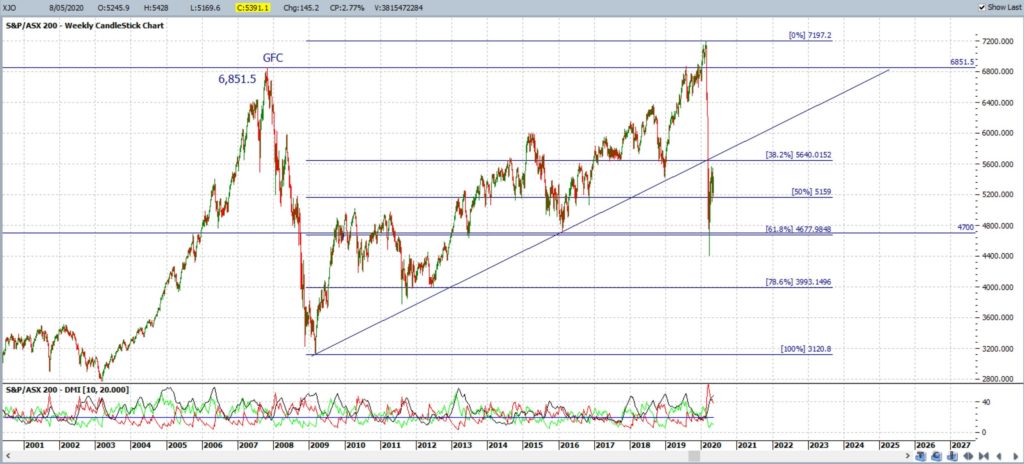
ASX-200: XJO: The ASX-200 closed with a small, bullish weekly candle but the index continues to struggle under the 5,450 S/R level and recently broken 11-year support trend line.
The broader Index picture has not changed much this week and the two scenarios, described over recent weeks, remain valid this week:
- Bullish: any breakout and hold above 5,450 would support a V-shaped recovery.
- Bearish: the revised 4hr chart trend lines are still shaping up in a potential Bear Flag so keep an open mind for any breakout: up or down! The Flag pole here is large and would predict the index falling to down near 2,000 so let’s hope this pattern fails! However, the impact from the economic fallout due to Covid-19 is still uncertain but could take an enormous toll if the situation continues out to the end of the year. Recall though that the index continues to hold above the support from the weekly 61.8% fib; a key S/R region that was previously highlighted in articles here and here.
An important point to note is that momentum on the 4hr and daily charts continue to decline so traders need to watch out for any uptick with ADX momentum and there are revised 4hr chart trend lines to monitor for any new momentum breakout.
Bullish targets: Any bullish 4hr chart recovery above 5,450 would bring the daily chart’s 61.8% fib level, just above the psychological and whole-number 6,000 level, into focus.
Bearish targets: Any bearish 4hr chart support trend line breakdown would bring the 5,000 level into focus and, then, weekly chart’s 61.8% fib, near 4,600/4,700, followed by the recent Low, near 4,400.
- Watch for any new 4hr chart trend line breakout:
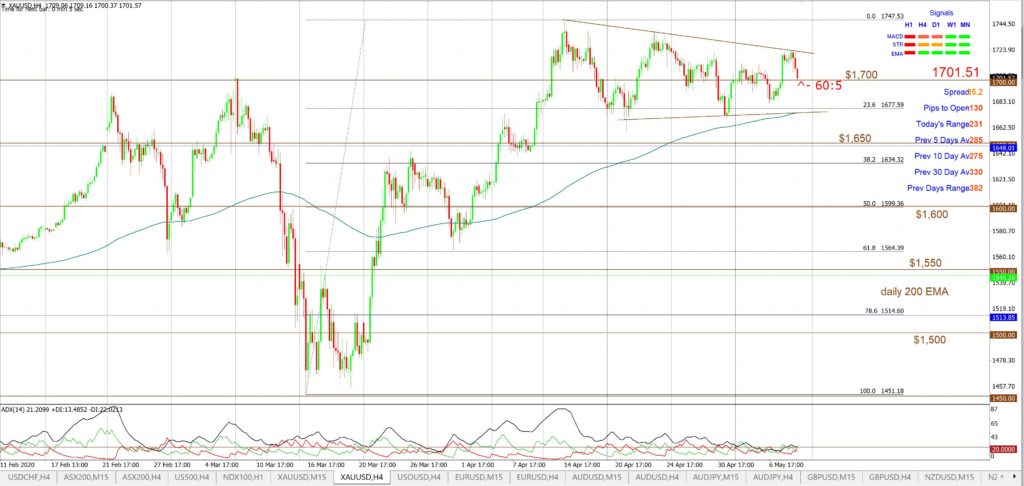
Gold: Gold closed with a bearish-coloured Spinning Top weekly candle and just above the $1,700 level keeping this as the one to watch for any new make or break.
Weekly chart: As mentioned over recent weeks, the weekly chart has the look of a broad Inverse H&S pattern or some may see this as a broad Cupping style pattern. Both are rather similar though as they are bullish patterns and suggest follow-through to the order of magnitude of the depth of the Cup / height of Head. In this case, that move is of around $700 so it is a longer-term pattern worth monitoring. The upper breakout region for this pattern is $1,800 which is still a way off yet.
There are revised 4hr chart trend wedge lines to monitor in the mean time until this $1,800 breakout region might be reached.
Bullish targets: any bullish 4hr chart wedge breakout would bring $1,800 S/R into focus.
Bearish targets: any bearish 4hr chart wedge breakout would bring $1,650, $1,600 and, then, $1,550 into focus as the latter is near the 4hr chart’s 61.8% Fibonacci level.
- Watch $1,700 S/R and for any 4hr chart wedge breakout:
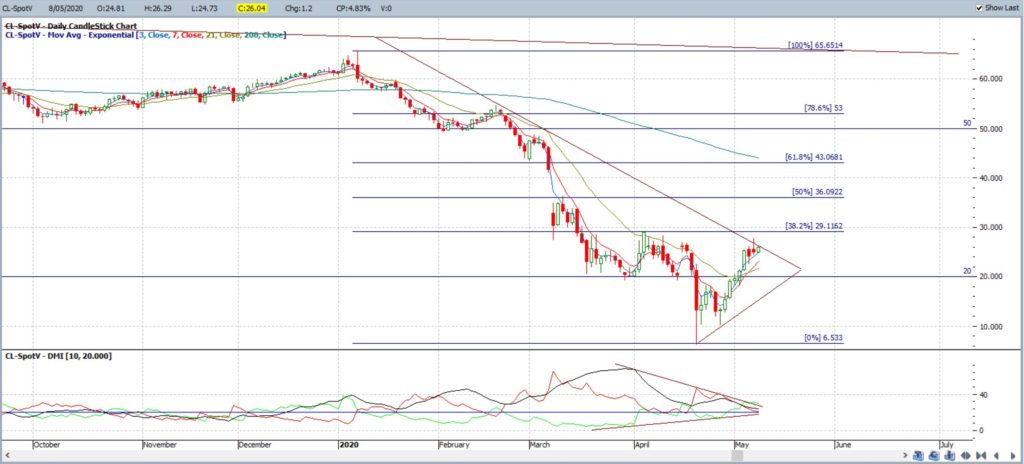
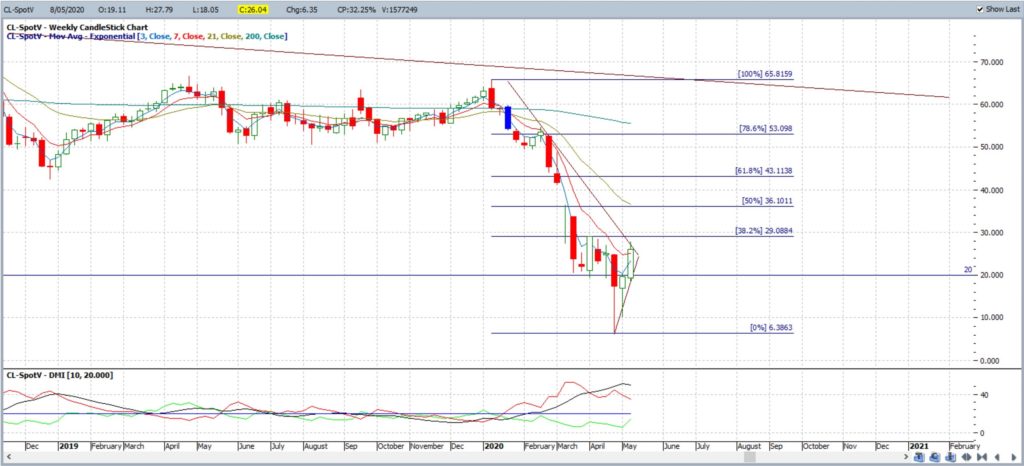
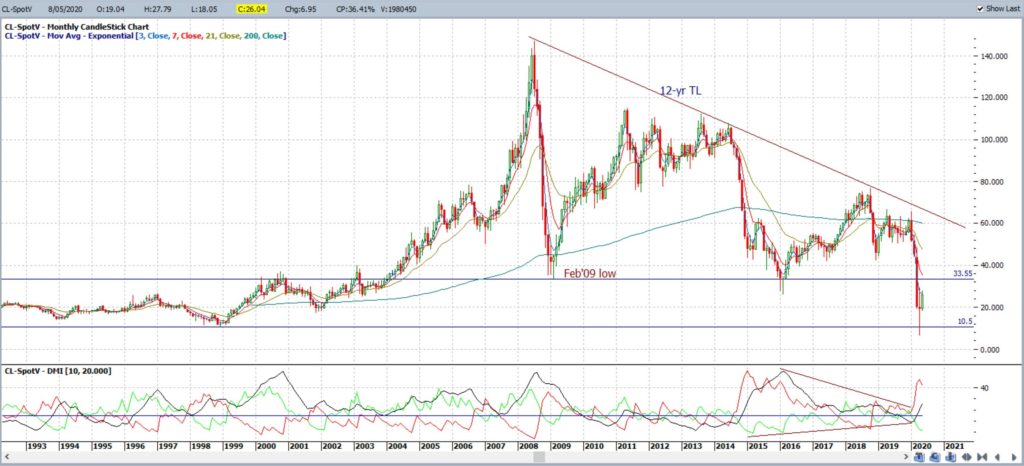
Oil: Oil closed with a bullish weekly candle following last week’s bullish-reversal Hammer weekly candle. There has now been a weekly close back above the key $20 keeping this as the main S/R level to watch for any new make or break.
There are revised triangle trend lines on the daily chart to monitor for any potential momentum-based breakout. Note, also, the bullish-reversal Morning Star pattern shaping up on the monthly chart.
Bullish targets: any bullish daily chart triangle breakout would bring $30 S/R into focus followed by the $41 / $43 region as the latter represents a Gap Fill region and is near the 61.8% fib of the recent swing Low move.
Bearish targets: any bearish daily chart triangle breakout below $20 would bring the recent Low, near $6.50, into focus.
- Watch for any daily chart momentum-based triangle breakout:
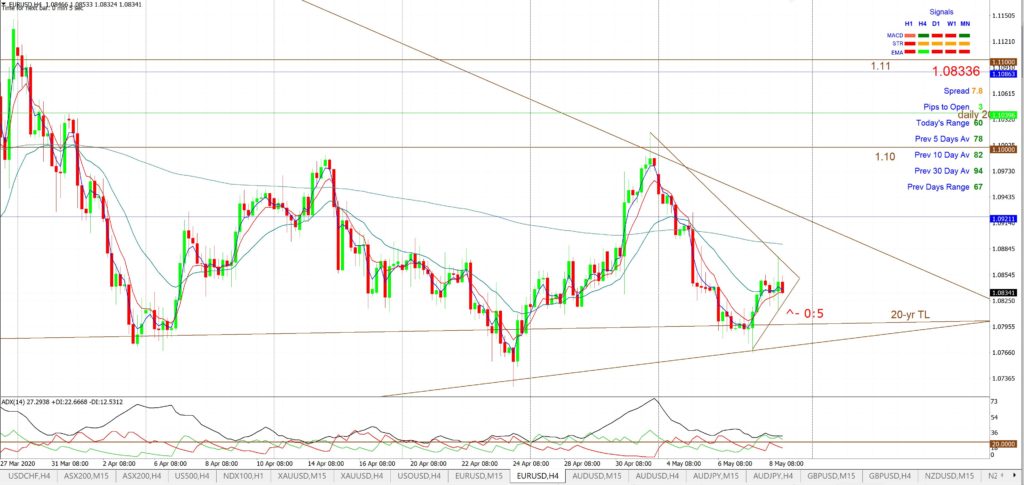
EUR/USD: The EUR/USD closed with a bearish weekly candle and retreated from the 1.10 S/R region moving back down to the 20-year support trend line.
This price action has shaped up into a new 4hr chart triangle giving traders trend lines to monitor for any momentum breakout. Watch to see how Tuesday’s US CPI data might impact this chart pattern.
Bullish targets: Any bullish 4hr chart triangle breakout would bring another 4hr chart TL followed by 1.10 into focus.
Bearish targets: Any bearish 4hr chart triangle breakout would bring the 20-year support trend line followed by the recent Low, near 1.065, into focus.
- Watch for any 4hr chart triangle breakout:
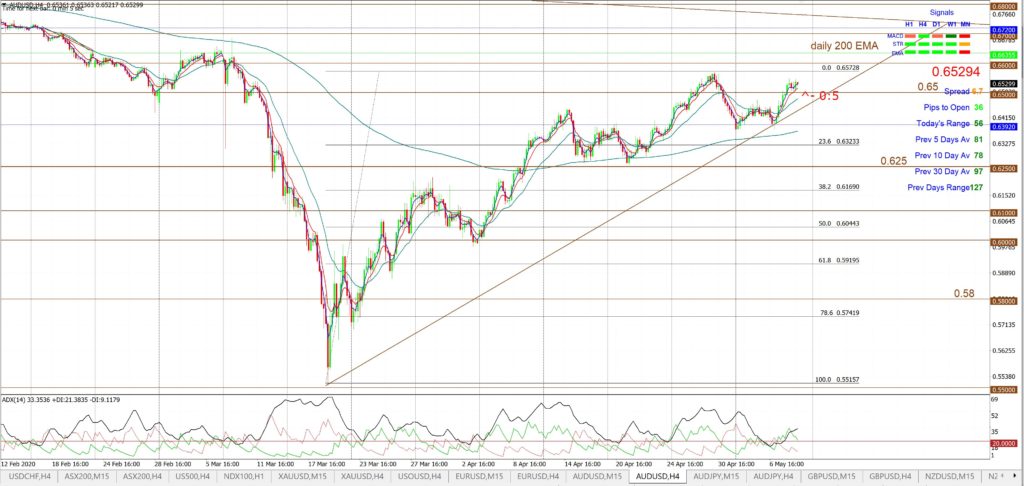
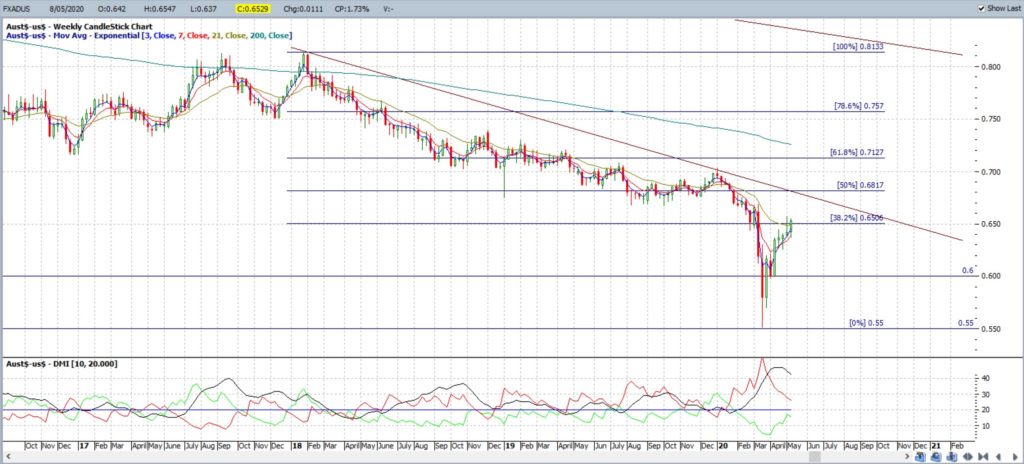
AUD/USD: The Aussie closed with a bullish weekly candle and under the 0.66 S/R level making this the next resistance region to watch for any new make or break; especially with this week’s AUD Employment data update.
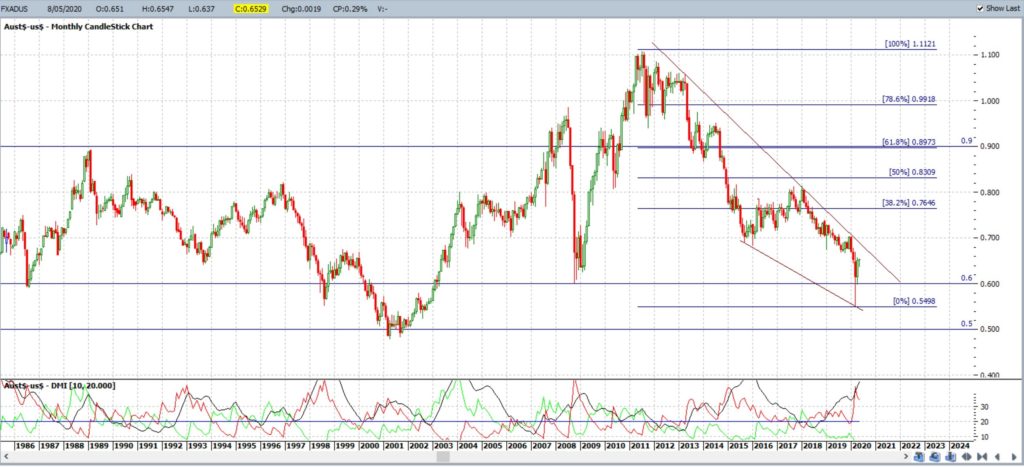
Recall, the monthly chart still shows a rather bullish pattern developing; a bullish-reversal Descending Wedge.
There are revised 4hr chart trend lines to monitor for any new momentum breakout.
Bullish targets: Any bullish 4hr chart trend line breakout above 0.66 would bring the recent High, near 0.67 S/R, into focus.
Bearish targets: Any bearish 4hr chart support trend line breakdown would bring 0.64 and 0.625 S/R into focus followed by whole-numbers on the way down to the recent Low, near 0.55 S/R.
- Watch for any 4hr chart 0.66 S/R or support trend line breakout; especially with this week’s AUD Employment data update.:
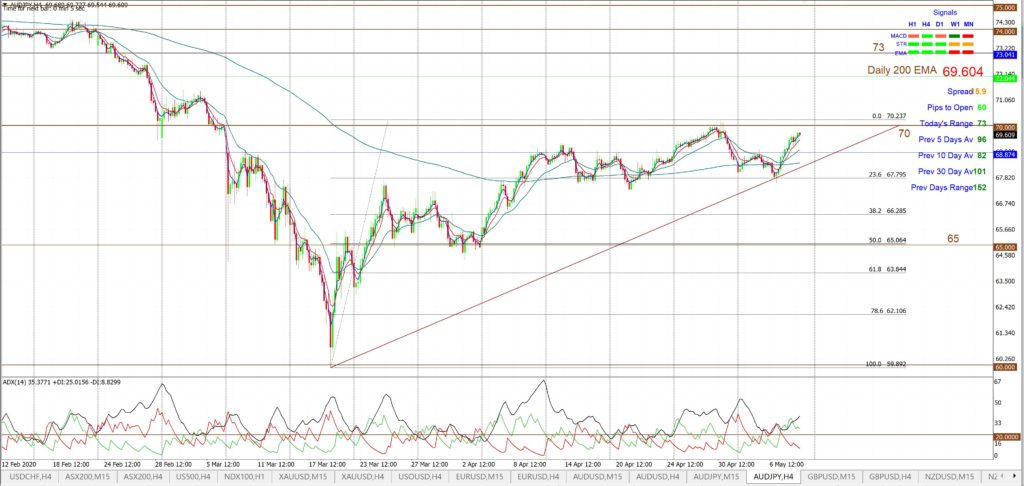
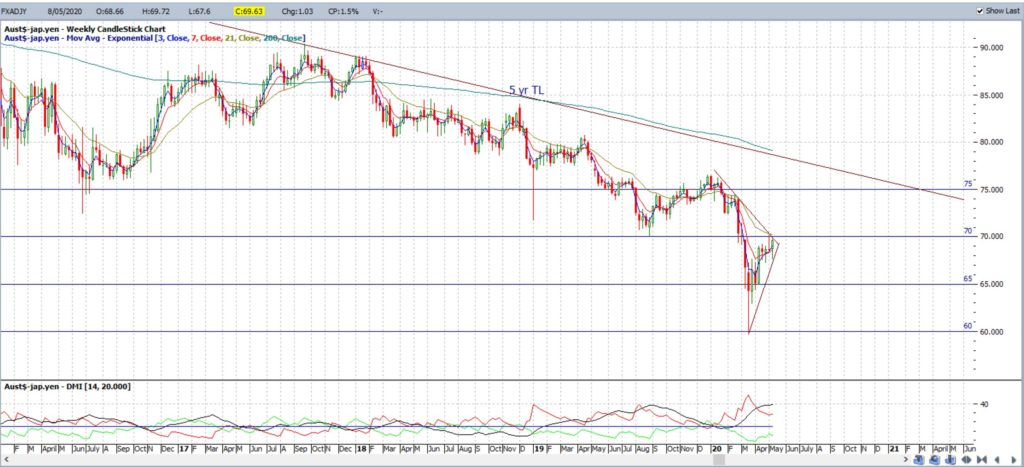
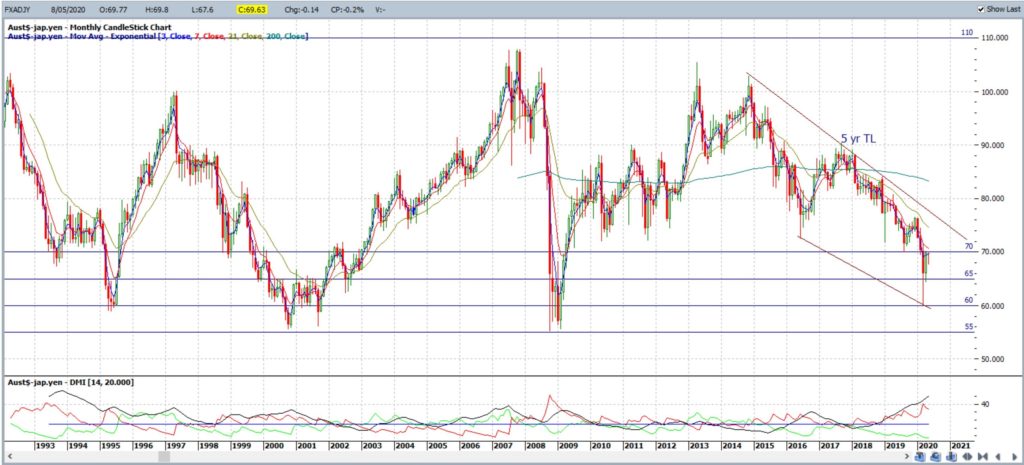
AUD/JPY: The AUD/JPY closed with a small bullish weekly candle and just under the 70 S/R level (see monthly chart) making this the region to watch for any new make or break.
There are revised 4hr chart trend lines to monitor for any momentum breakout.
Bullish targets: Any 4hr chart trend line breakout above 70 S/R would bring whole-number levels up to 75 S/R into focus.
Bearish targets: Any bearish 4hr chart support trend line breakdown would bring 65 S/R back into focus followed by 60 S/R.
- Watch for any 4hr chart trend line breakout:
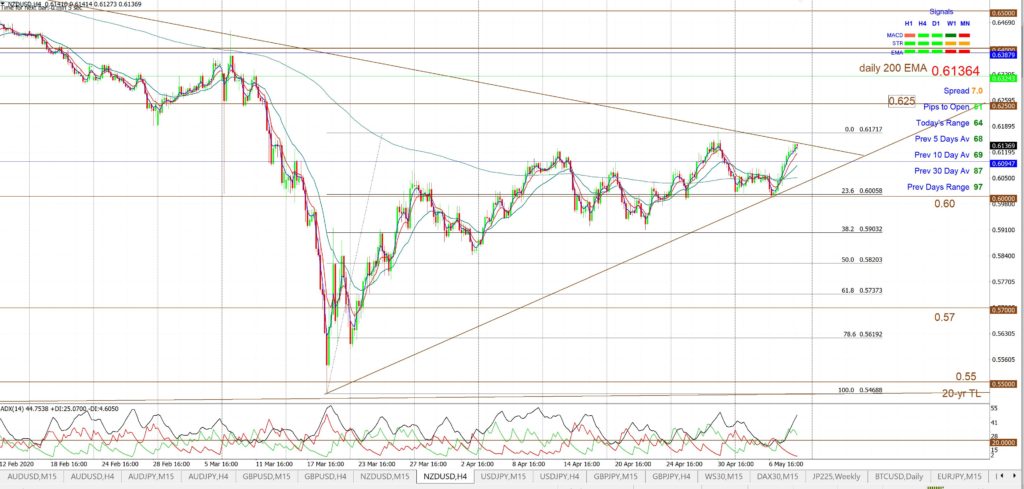
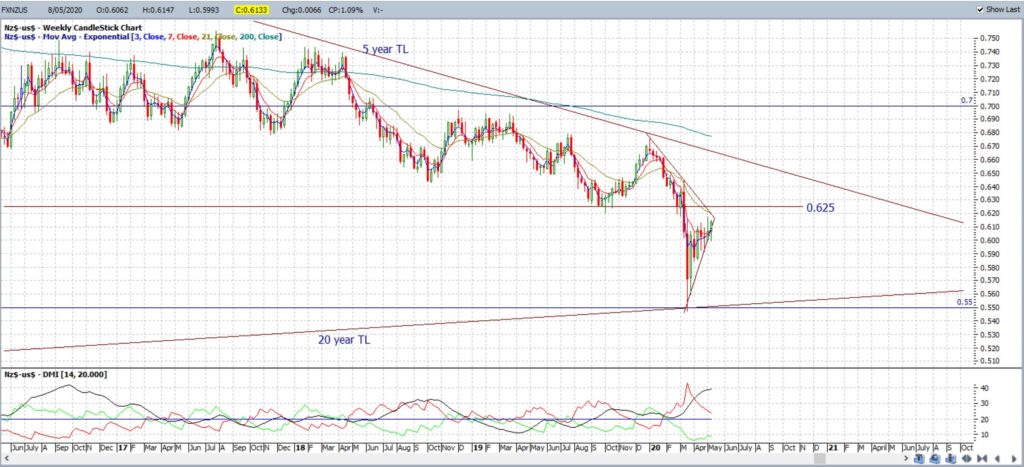
NZD/USD: The Kiwi closed with another small, bullish weekly candle, above 0.61 S/R and is looking rather bullish ahead of this week’s RBNZ interest rate update.
Price action is trading within a revised 4hr chart triangle giving traders trend lines to monitor for any new momentum breakout.
Bullish targets: Any bullish 4hr chart triangle breakout would bring 0.625 into focus followed by the recent High, near 0.64 S/R.
Bearish targets: Any bearish triangle breakout would bring 0.60 followed by 0.57 S/R back into focus as the latter is still near the 4hr chart’s 61.8% fib.
- Watch for any 4hr chart triangle breakout; especially with this week’s RBNZ interest rate update:
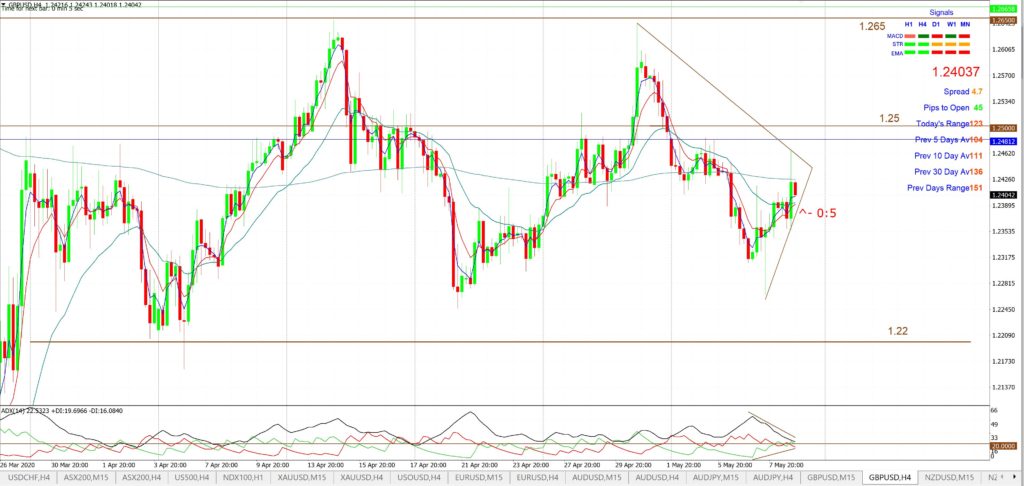
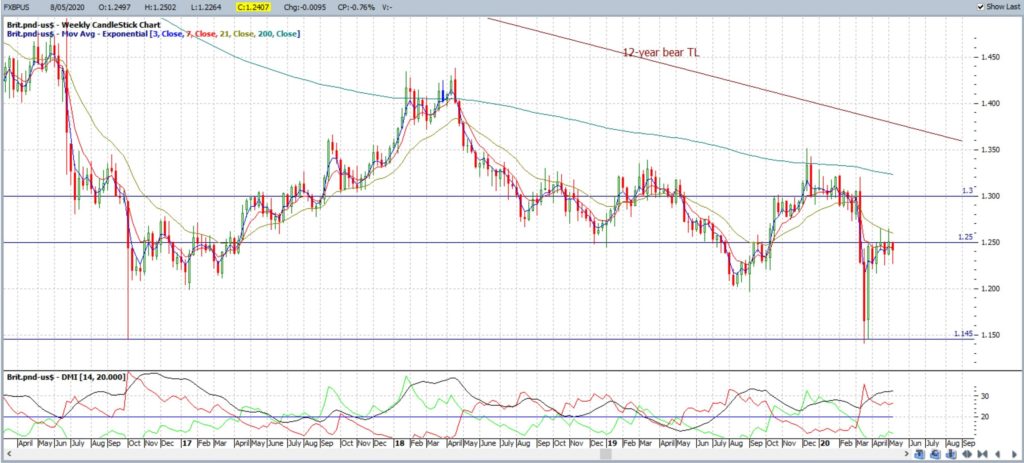
GBP/USD: The GBP/USD closed with a bearish weekly candle and right on 1.24 making this the one to watch for any new make or break.
Price action has essentially chopped sideways for the last 6 weeks in a channel with a 1.265 upper boundary and a 1.22 lower boundary. However, there are revised 4hr chart triangle trend lines to monitor for any new breakout.
Bullish targets: Any bullish 4hr chart triangle breakout would bring 1.25 S/R into focus followed by 1.265 S/R.
Bearish targets: Any bearish 4hr chart triangle breakout would bring 1.22 S/R back into focus followed by 1.20 and, after that, the 2016 Low, near 1.145.
- Watch for any 4hr chart triangle breakout:
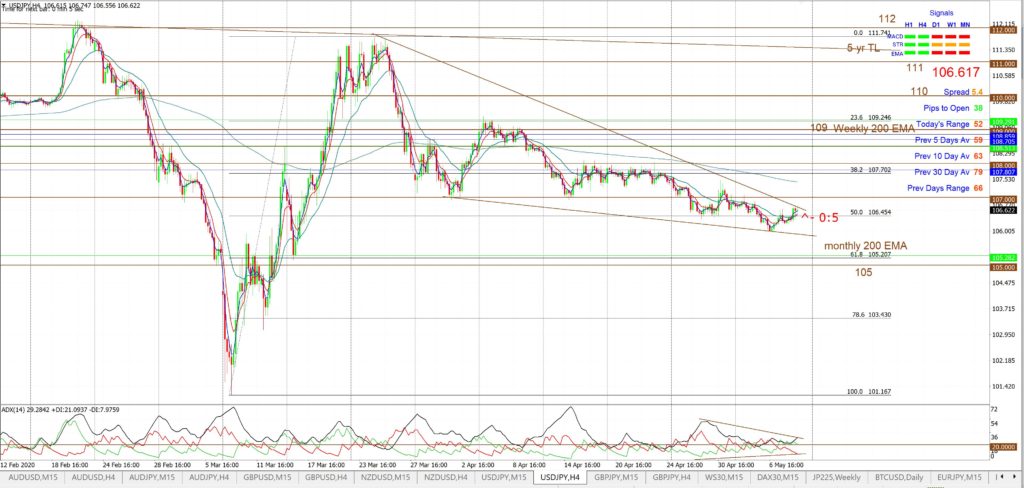
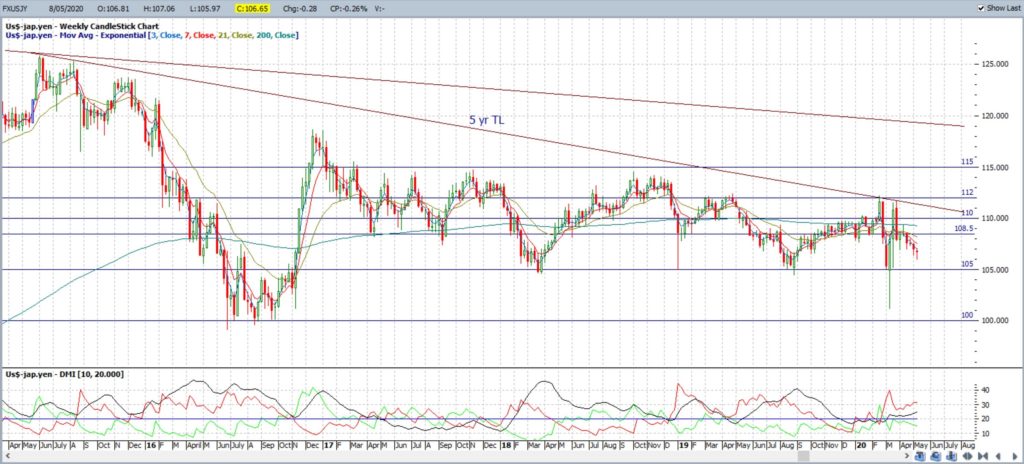
USD/JPY: The USD/JPY closed with a bearish-coloured Spinning Top weekly candle and still below 107 keeping this as the S/R level to watch for any new make or break.
There is still a descending wedge on the 4hr chart giving traders trend lines to watch for any new momentum breakout.
Bullish targets: Any bullish 4hr wedge breakout above 107 would bring 108, 108.5, 109 and, then, whole-numbers on the way to 112 into focus.
Bearish targets: Any bearish wedge breakout would bring 105 S/R back into focus as this is near the 4hr chart’s 61.8% Fibonacci and the monthly 200 EMA.
- Watch for any 4hr chart descending wedge breakout:
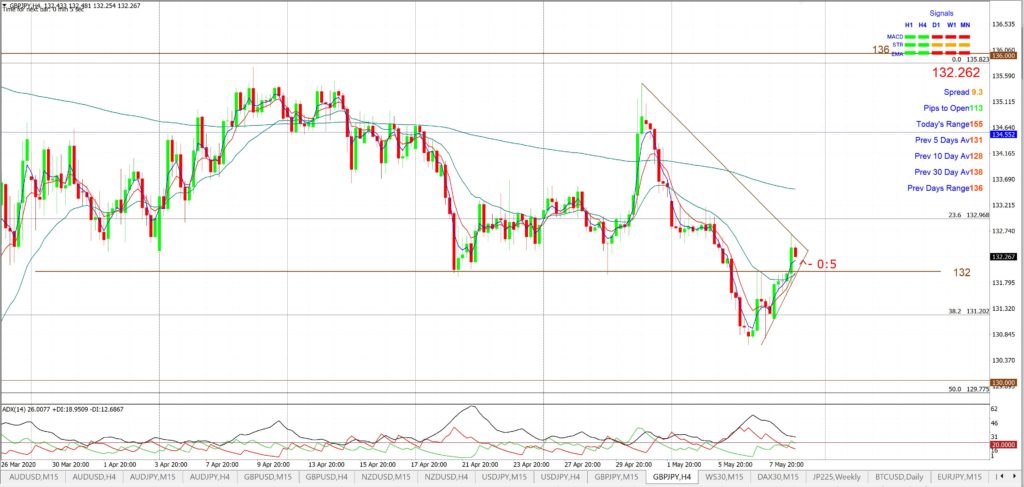
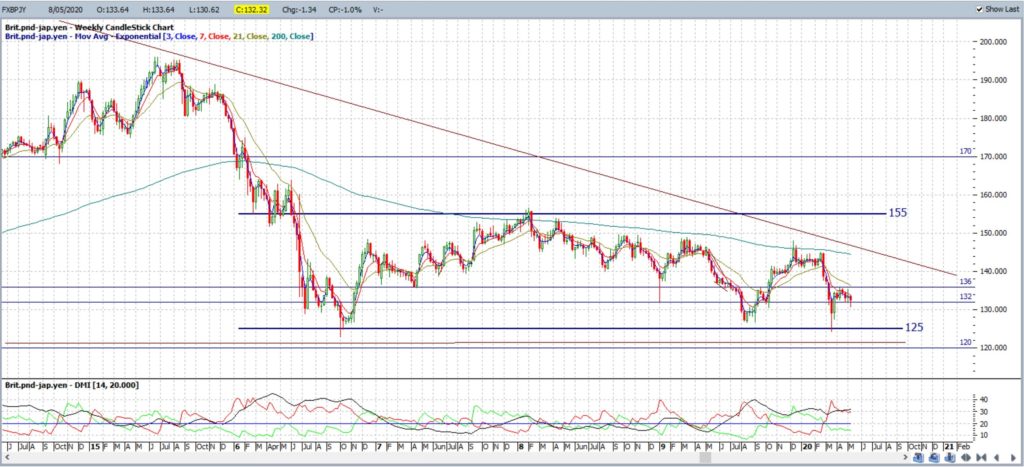
GBP/JPY: The GBP/JPY closed with yet another Spinning Top weekly candle, the sixth in a row, reflecting continued indecision. This week’s was bearish coloured.
Very little has changed here now for over six weeks as price action continues to primarily chop within the channel bound by 136 above and 132 below. There was a dip below 132 last week but the GBP/JPY closed above this S/R level and there are revised 4hr chart triangle trend lines to monitor for any new momentum breakout.
Bullish targets: Any bullish 4hr chart triangle breakout would bring 136 into focus followed by whole-numbers on the way to 140 and 150.
Bearish targets: Any bearish 4hr chart triangle breakout below 132 would bring 130 S/R back into focus and, after that, the key 125 level.
- Watch for any 4hr chart triangle breakout:


