There is plenty of chatter about the NASDAQ, along with the DJIA and S&P500, being in ‘correction territory‘ but the charts, for me at least, are saying something different. The next week or so will be critical for the NASDAQ Composite but here is how I’m seeing the current charts.
I am a trend-following technical analysts and one issue I continually reinforce in my updates is that trends do not travel in straight lines ad infinitum. The NASDAQ, like the other major US stock indices, has enjoyed a bullish run since the GFC 2008 period. It is unrealistic to expect this bullish run to both a) continue unabated and b) to continue in a straight line even if it momentum does keep moving the index higher; there will be dips along the way of any continued bullish run.
I use trend lines, the Ichimoku Cloud and Fibonacci retracement as technical tools to help gauge market dips versus major pullbacks / corrections. The 61.8% Fibonacci retracement level is the ‘line in the sand’ for my assessment; trends will often pull back to this level before any further continuation. Whereas a break and hold of this level is often a warning that more retracement is likely. Keep these points in mind as you read my assessment of the following charts.
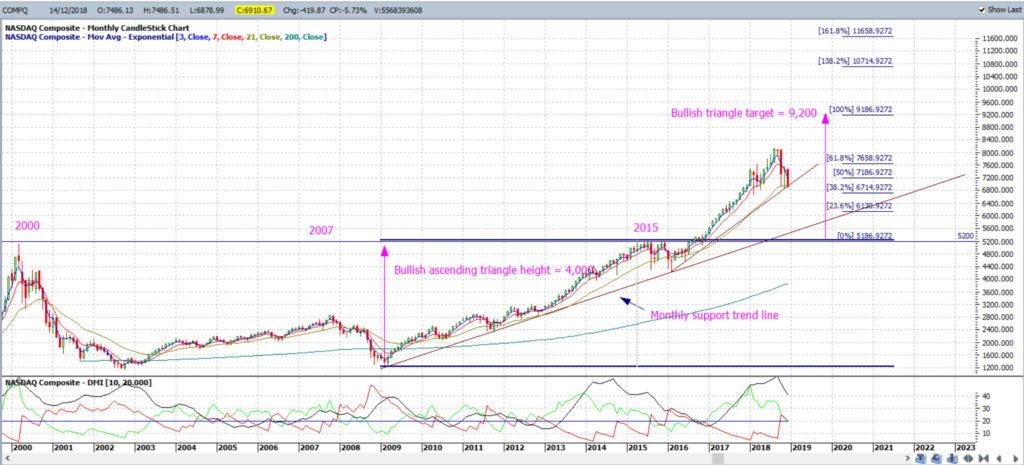
NASDAQ monthly: I am watching for any longer-term bullish ascending triangle move on the NASDAQ composite. The target for this move is 9,200. There are two trend lines that are still intact on this monthly chart: one has been in pace since the bounce off the 2008 Lows. The other has been in place since early 2016. The December candle has yet to close but, for the time being, price action on this chart is still printing higher Highs and higher Lows and so the trend is still UP.
Note that any bearish close for December below this proximal trend line would shift this assessment to result in a lower Low and would be a warning that this 2016-2018 swing High move might be coming to an end.
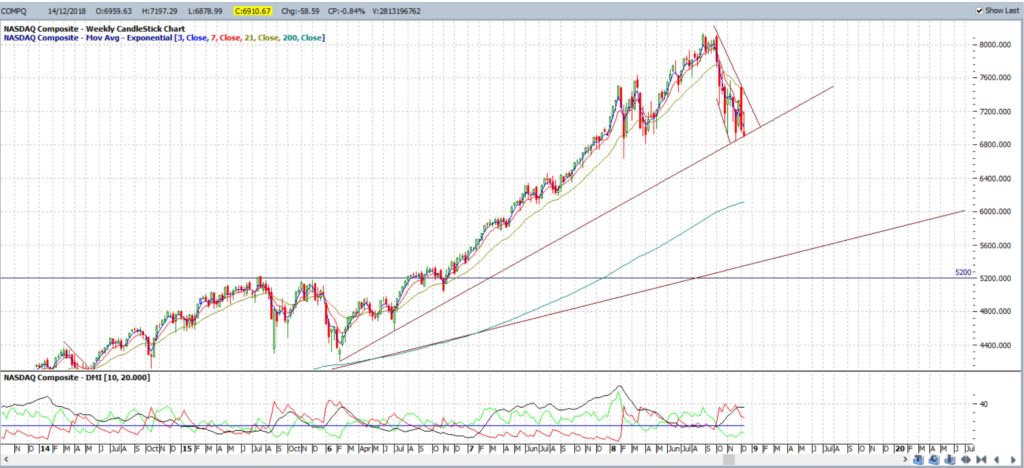
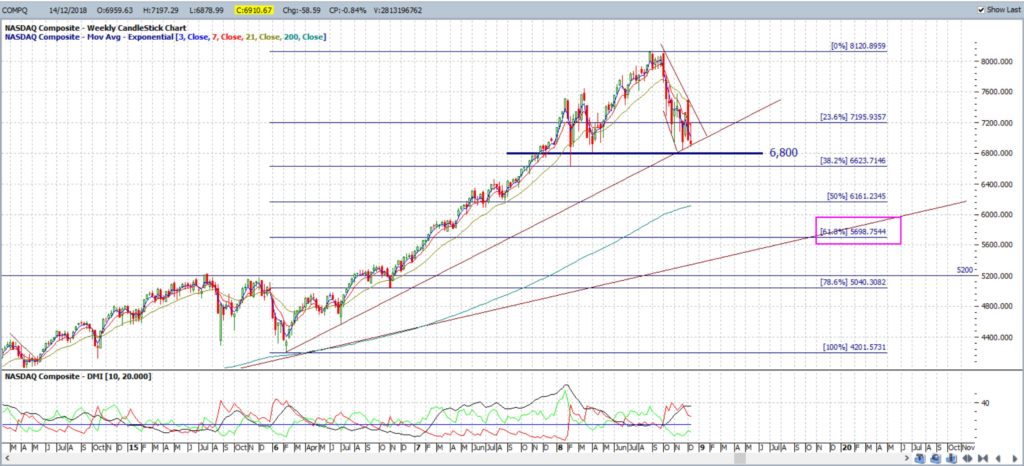
NASDAQ weekly: the weekly chart shows the 2016-2018 swing High move and proximal trend line more clearly. Note the Flag trend lines around recent price action. These three trend lines are the ones to watch in coming sessions for any new breakout:
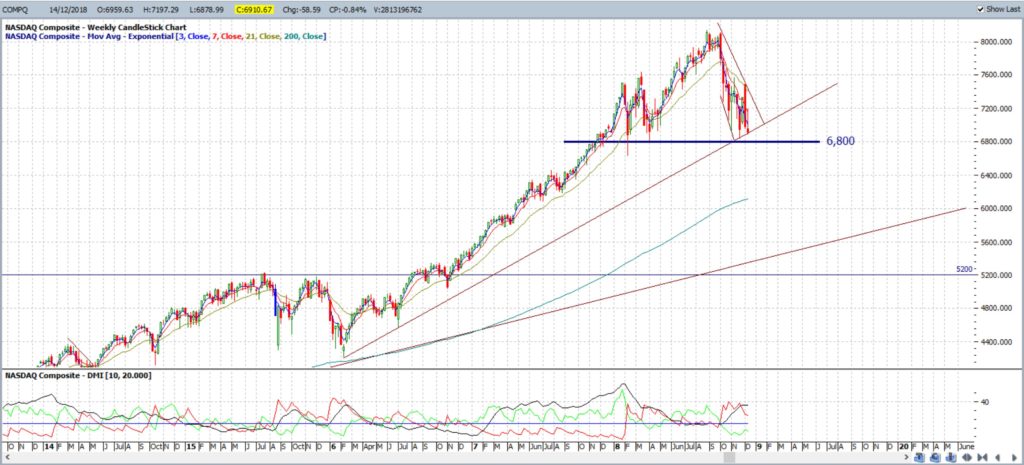
NASDAQ weekly: any bearish break of these trend lines would then bring the 6,800 whole-number level into focus as this region has offered significant support for the last 12 months and so bears monitoring.
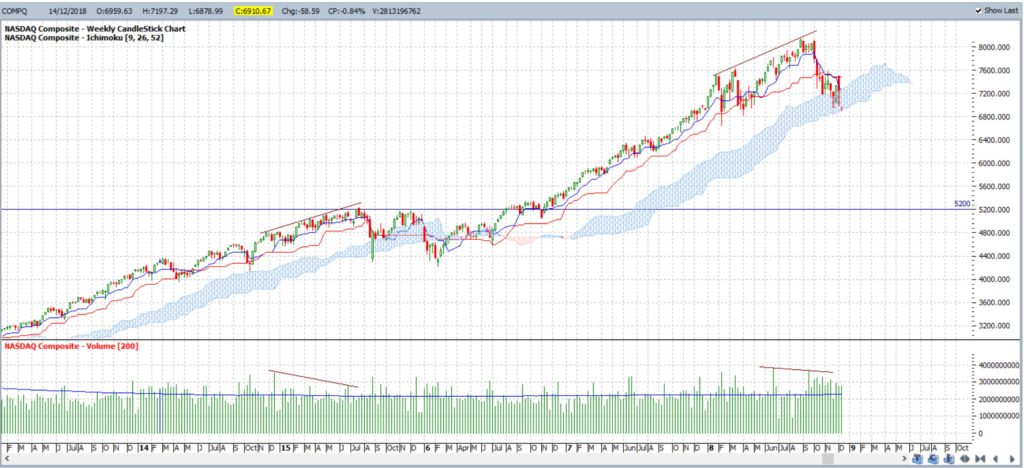
NASDAQ weekly Ichimoku Cloud: price action remains above the bottom of the weekly Ichimoku Cloud for now and this region can often offer decent support. Any break and hold below the weekly Cloud would be rather bearish though so watch this region for any new make or break activity.
NASDAQ weekly: any break and hold below the trend line and weekly Cloud would have me looking down to the 61.8% Fibonacci retracement level of this 2016 -2018 swing high move. It is reasonable for longer-term trends to deviate to this region as part of the normal ebb and flow of the overall trend move. It is worth noting that this 61.8% level is down near the longer-term monthly chart support trend line, circa the 5,700 region. The overall, bullish monthly chart uptrend would not be considered broken, by me at least, until this weekly 61.8% fib and monthly support trend line are broken.
Summary: Recent price action on the NASDAQ Composite has been bearish; there is no disputing that. What I do dispute is that this price action is a clear signal this index is in a bear market. For the time being, there is trend line and weekly Cloud support in place and the 2016-2018 swing High remains intact until these levels are broken. Any break and hold of these levels would have me looking down to the lower monthly support trend line. The longer term, 2008-2018, swing high move remains intact until this monthly support trend line, down near 5,700, is broken.


Mary
Nice work
Well done
I see price at demand level in short term trend with a wedge forming on daily chart.
Anticipating some form of buyers to come into market and looking at seasonal data for this time of year and taking into account no Santa rally has occurred yet, Watch this space
Phill
Thanks Phill!