Sat 20th Sept
I saw some CNBC trading commentary on the NASDAQ this morning and, given I have previously reviewed the S&P500, DJIA, the DAX and Canada’s TSX, I thought I would have a closer look at this index.
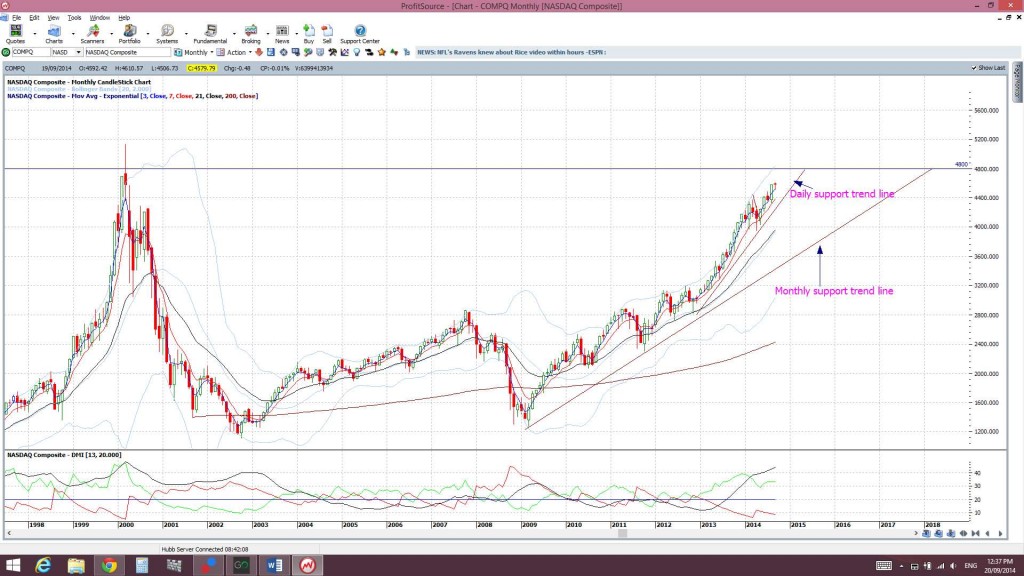
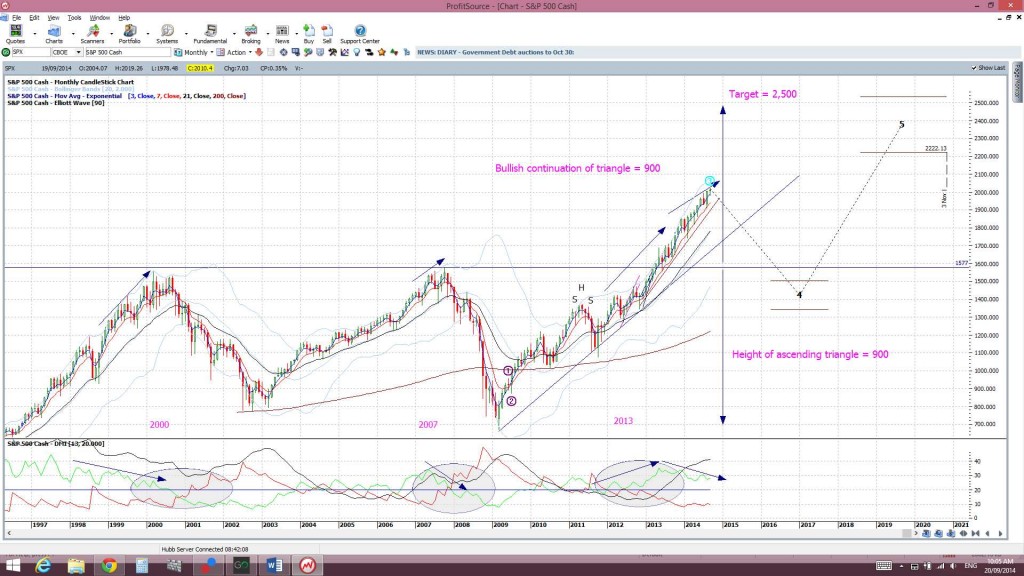
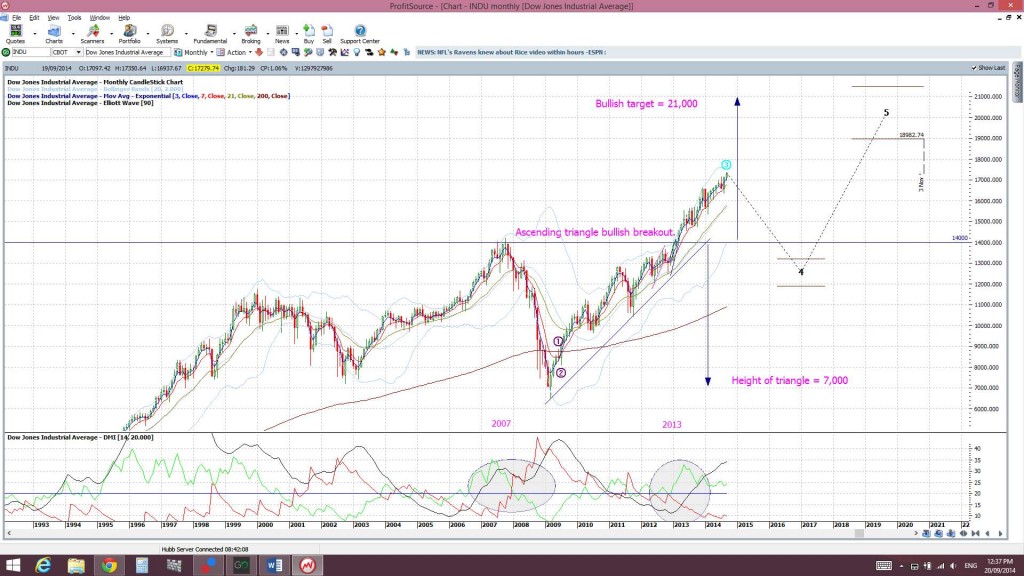
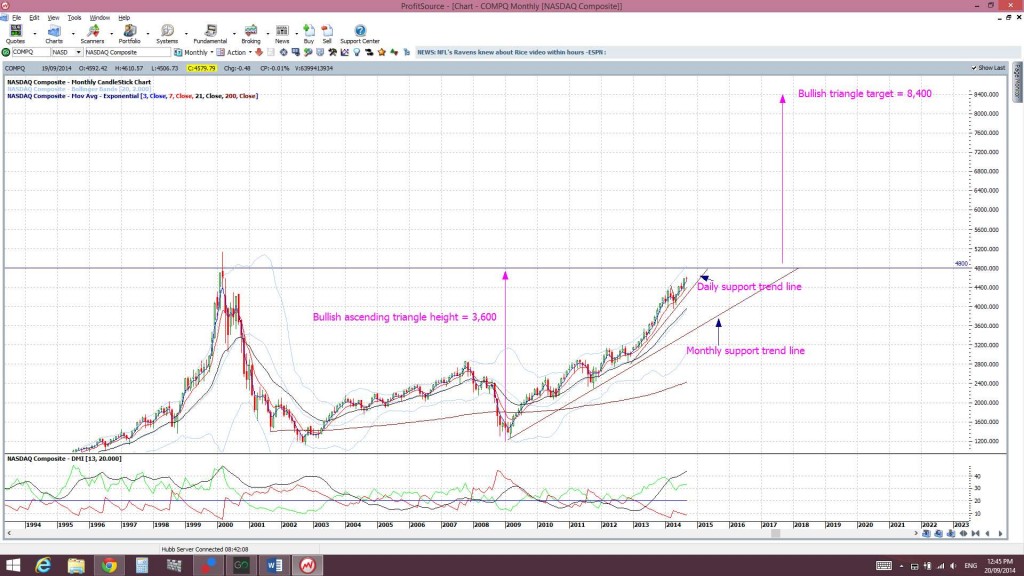
The NASDAQ is lagging it’s S&P500 and DJIA partner indices in that it has not printed a bullish breakout above previous highs:
NASDAQ: still below the 2000 highs:
S&P500: recently above previous 2000 and 2007 highs:
DJIA: recently above previous 2007 and 2013 highs:
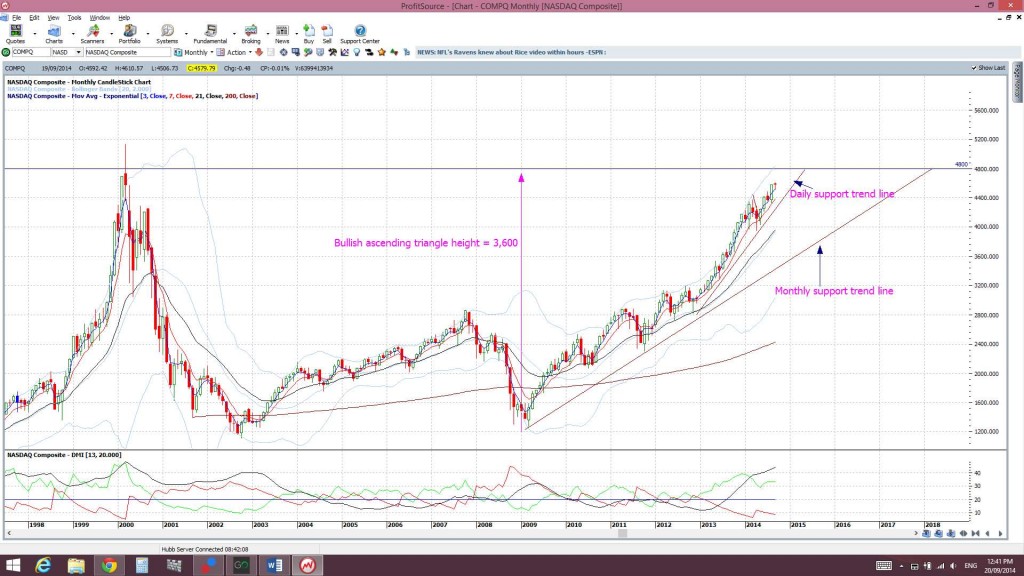
The DJIA and S&P500 have both made bullish ascending triangle breakouts but the NASDAQ is still forming up within an ascending triangle pattern. The upper trend line for this pattern looks to be best placed at the 4,800 whole number level. The height of this triangle is 3,600 (4,800 – 1,200):
Thus, any bullish break and hold above the 4,800 level would suggest a bullish ascending triangle breakout and a possible move of 3,600 up from the 4,800 level. This predicts a possible target of 8,400:
There is still plenty of room for consolidation whilst moving along towards the apex of this triangle. The index is currently trading above a daily support trend line but any break of this support would have me looking for a possible move back down to test the monthly support trend line. Traders should expect some possible consolidation ‘back and forth’ movement here on this index whilst it negotiates this upper 4,800 resistance.
This has implications for some NASAQ stocks as they trade at potential breakout levels. Some of my preferred NASDAQ stocks are charted below:
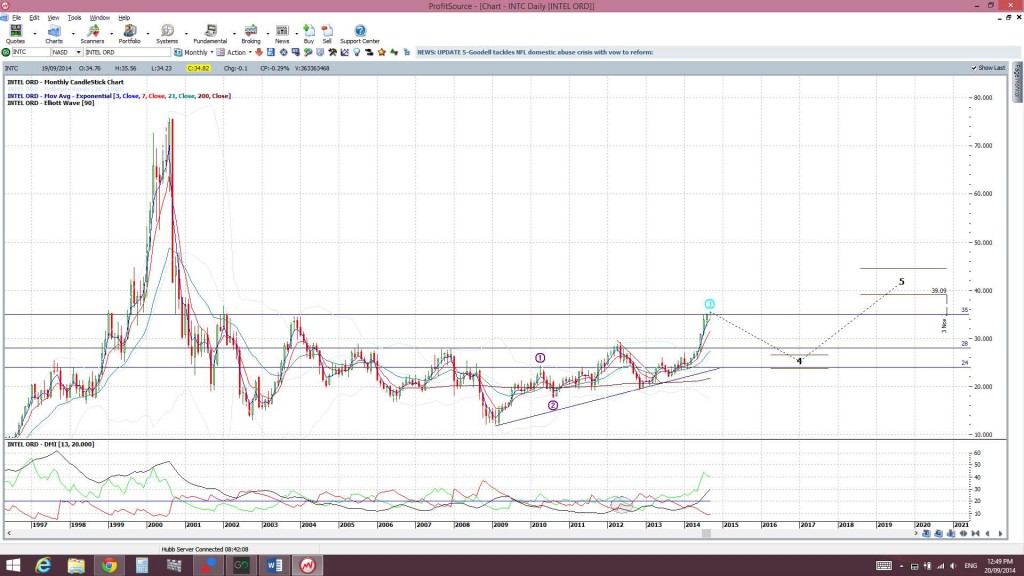
INTC: Intel is trying to break up through the $35 level but may have some more consolidation ahead of it first. However a monthly close above the $35 level would support bullish continuation:
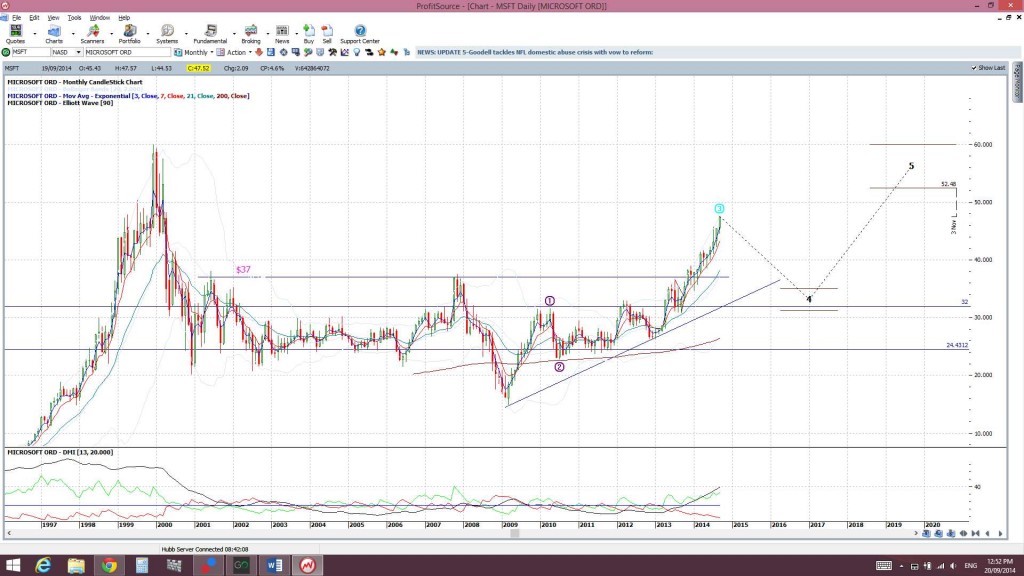
MSFT: Microsoft has looked bullish since it broke up through the $37 level but a pull back here would not be unexpected and I would look at this as a good buying opportunity:
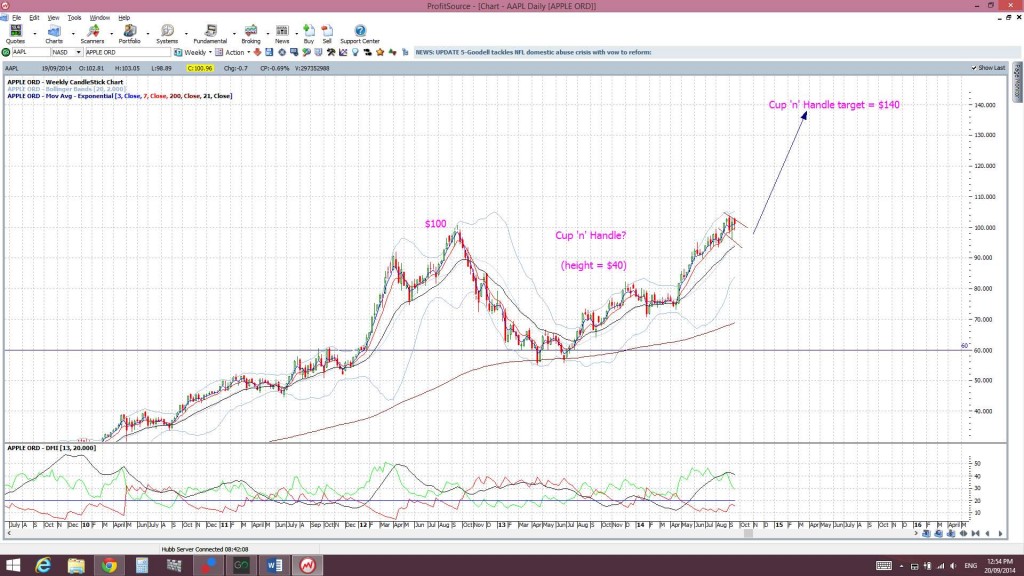
AAPL: I am still seeing this set up in a bullish Cup ‘n’ Handle pattern but there is room for more ‘Handle’ consolidation here:
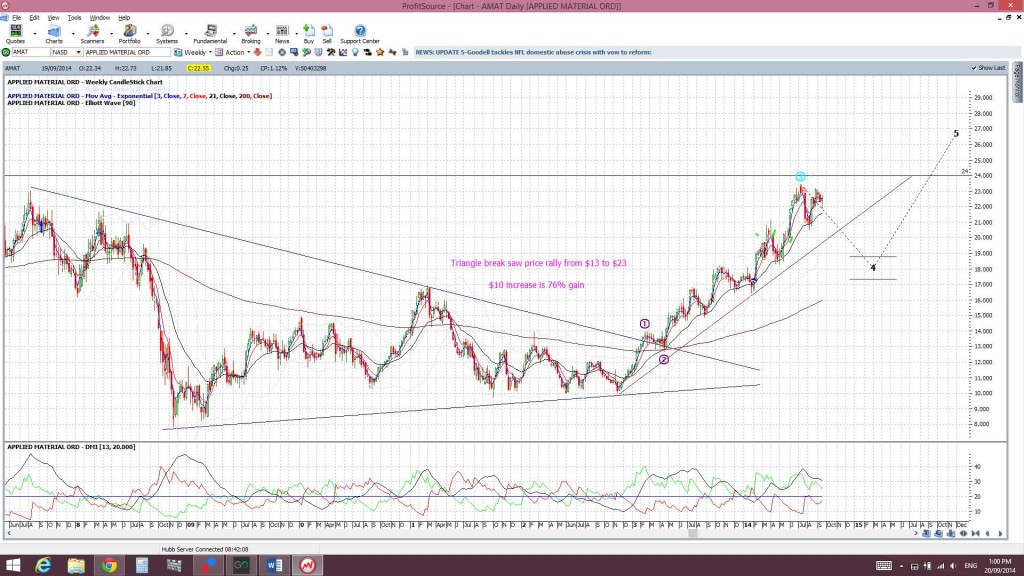
AMAT: this is consolidating within its own ascending triangle now but may be a bit choppy as it negotiates the $24 level:
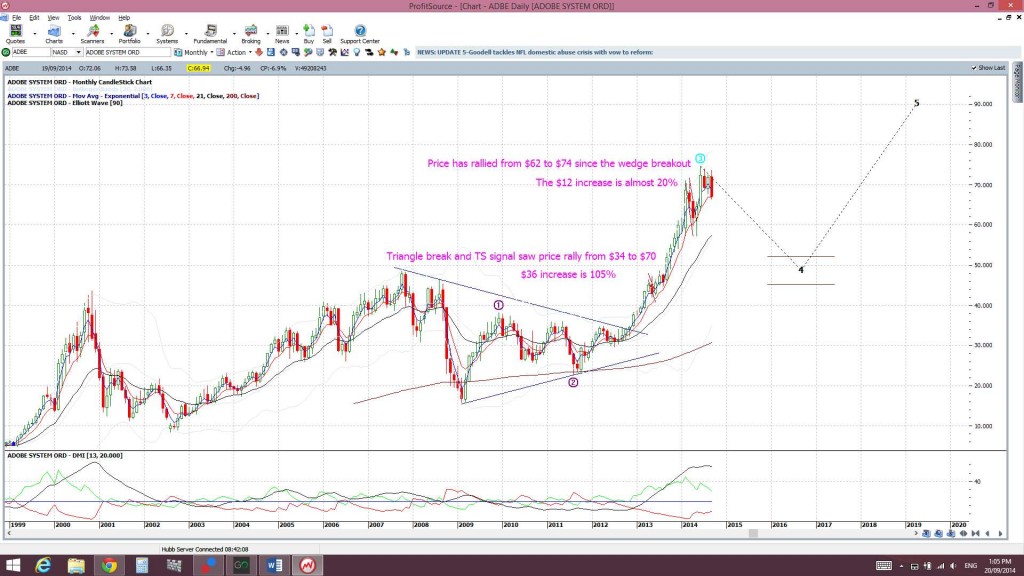
ADBE: this stock has rallied hard since making a triangle breakout back at the end of 2012. I would consider some pull back here as a good buying opportunity though as well. I note that the Elliott Wave indicator on my chart suggests a pull back to the previous high region of $50:
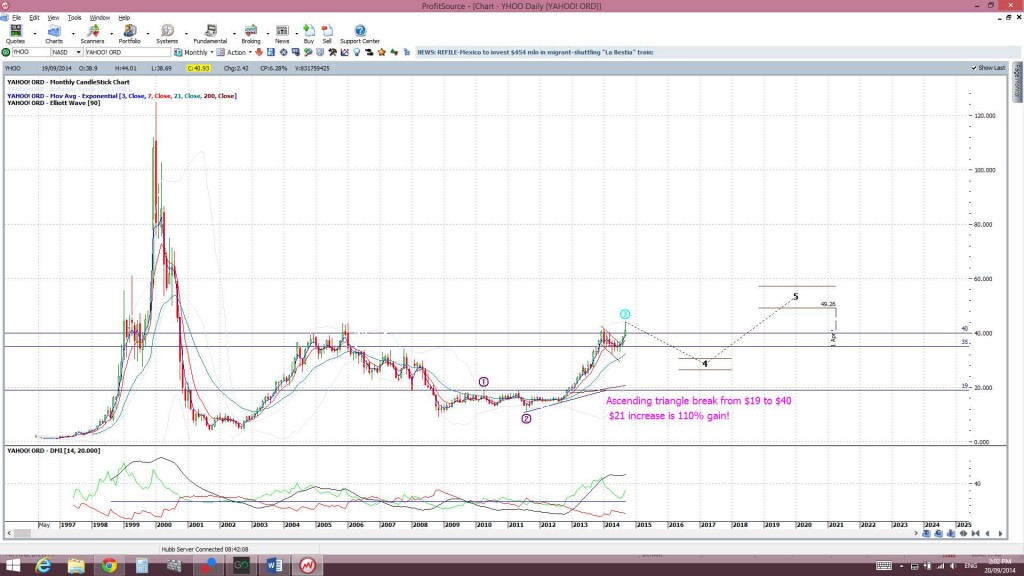
YHOO: I think that a monthly hold above the $40 would suggest bullish continuation here. This stock might just buck the overall trend a bit and get dragged along by Alibaba:
Summary:
- the NASDAQ looks to be consolidating within a bullish ascending triangle under the 4,800 level.
- technical theory suggests a potential target for any bullish breakout of 8,400.
- expect some possible choppiness as the index trades under this resistance and towards the apex of the triangle.
- expect some choppy, and possibly pull back, action to appear on NASDAQ listed stocks.


