Tech stocks and the NASDAQ have been under some pressure over the last couple of months as the index struggles near its all time High and the psychological 8,000 level. A weekly support trend line has been broken and, in this post, I suggest levels on the index that technical traders should monitor over coming sessions.
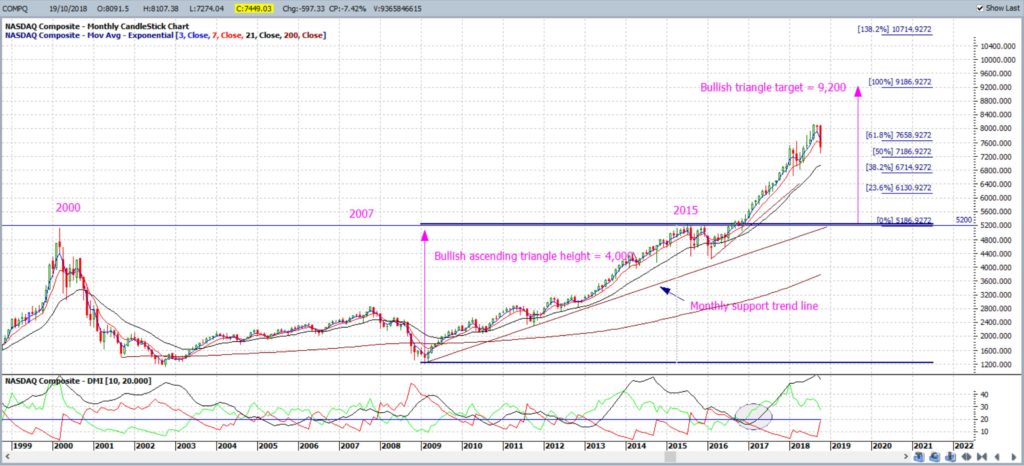
NASDAQ monthly: the current monthly candle is large and bearish and is forming up with a bearish reversal Evening Star type pattern. I still have a target of 9,200 for the ascending triangle breakout move but do not expect the index to travel in a straight line to reach that level.
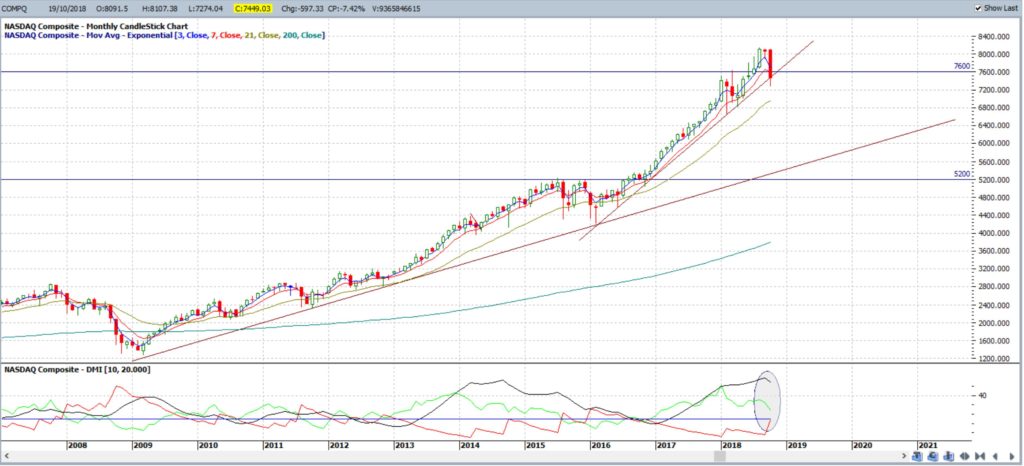
A recent support trend line is under pressure:
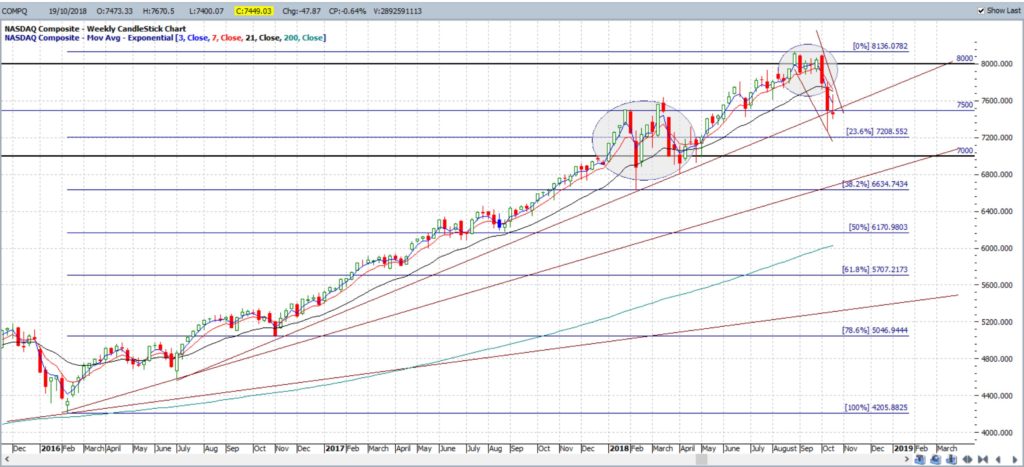
NASDAQ weekly: Price action previously stalled at the 7,000 ‘whole number’ level and has done so again at the 8,000 level. A weekly support trend line has been broken which is bearish but the weekly candle closed as a ‘Spinning Top’ which, at best, reflects indecision. Also, as I always advise, traders need to watch that this pullback does not evolve into a Bull Flag. Watch the Flag trend lines for any new breakout and watch to see how price moves near the 7,500 level over the coming sessions:
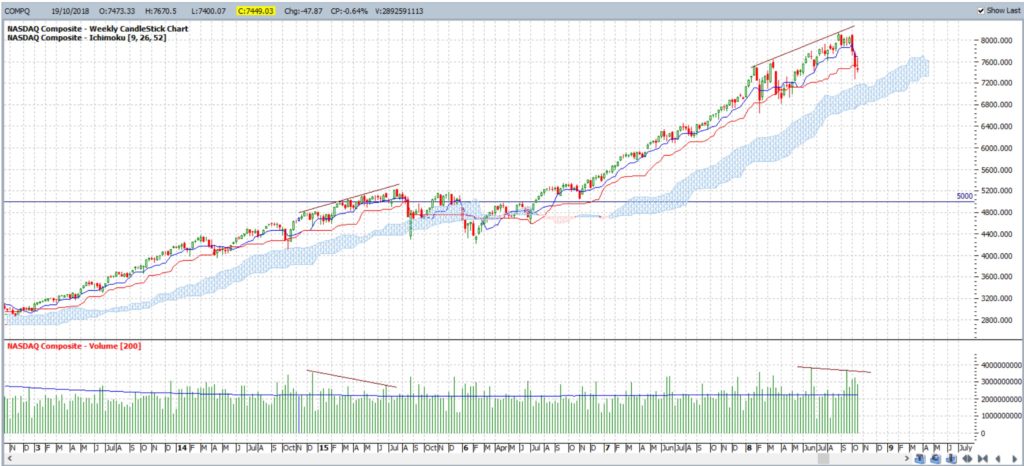
NASDAQ weekly Cloud: Price action remains above the weekly Ichimoku Cloud for the time being so this is another support region that traders could monitor. A break and hold below the weekly Cloud would be rather bearish. There is some bearish divergence but you will see that previous examples of this have not always resulted in much of a pullback so caution is need reading that metric.
Summary: Watch the following regions to gain the progress of any bearish sentiment on the NASDAQ. A break and hold below all of these levels would be rather bearish:
- weekly chart Flag trend lines.
- the 7,500 level.
- the weekly Ichimoku Cloud.


