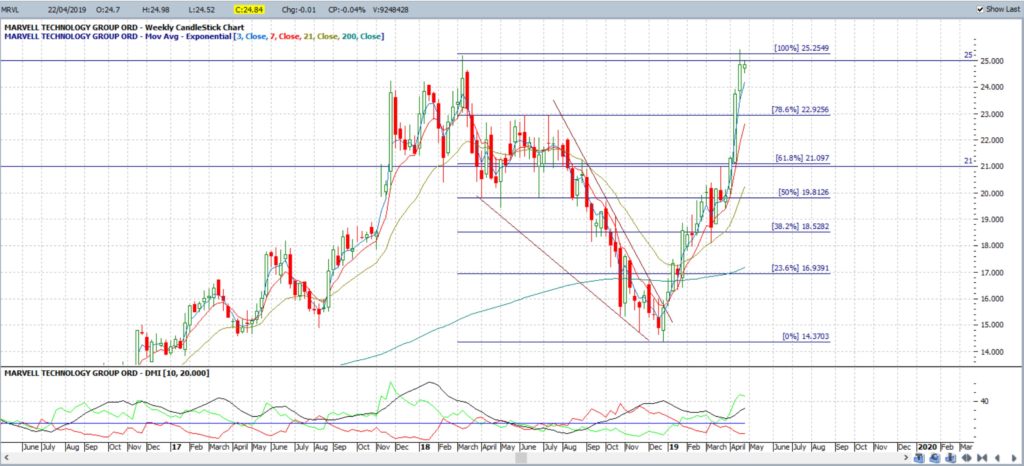
Marvell Technology Group is a semiconductor stock I have been monitoring since it made a bullish-reversal Descending Wedge breakout back in January of this year. I actually featured this stock in an article on Descending Wedges that can be viewed through this link. The stock has reached the 100% Fibonacci retracement of this wedge breakout move and I’m on the lookout for any pause, or pullback, before its next move. In this post I assess the upper and lower levels to keep in focus for the next move that evolves on this stock.
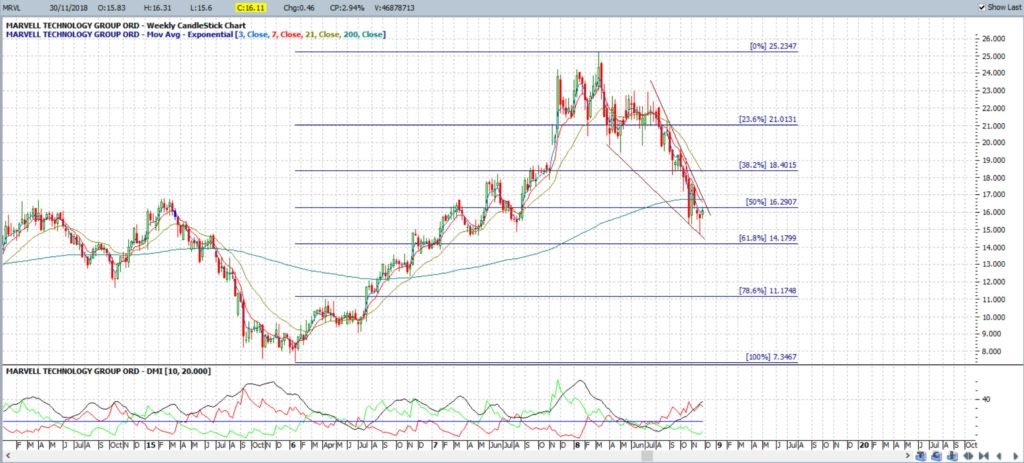
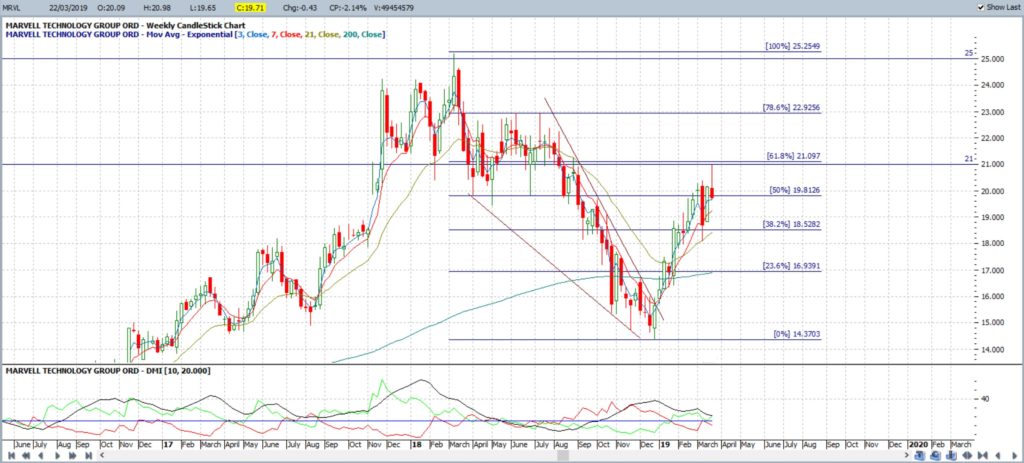
MRVL weekly: Marvell Technology went on a bullish run from January 2016 until March of 2018. Price action subsequently pulled back and the chart below shows that this pullback reached down to near the 61.8% Fibonacci of this swing High move. This price action also started to shape up in a Descending Wedge as the stock pulled back from March 2018 until January 2019:
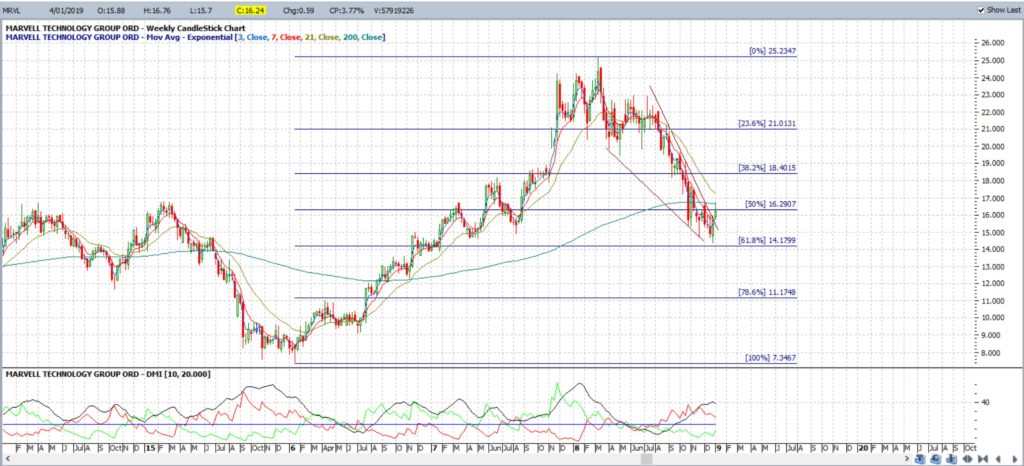
MRVL weekly: There was an eventual Descending Wedge breakout in early January 2019:
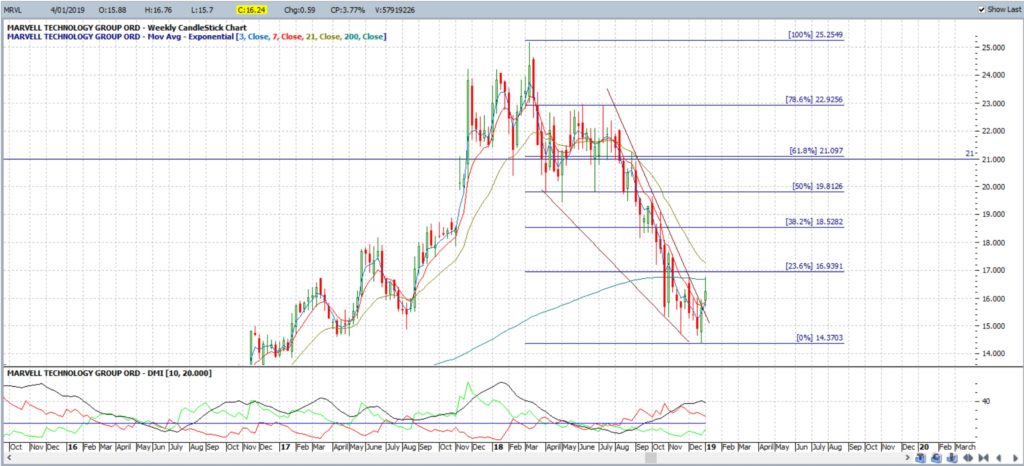
MRVL weekly: Fibonacci retracement was applied to this swing Low Descending Wedge move of March 2018 to January 2019. It showed the popular 61.8% Fibonacci level to be up near a previous S/R level of $21 and this would have been the major target for this bullish breakout move.
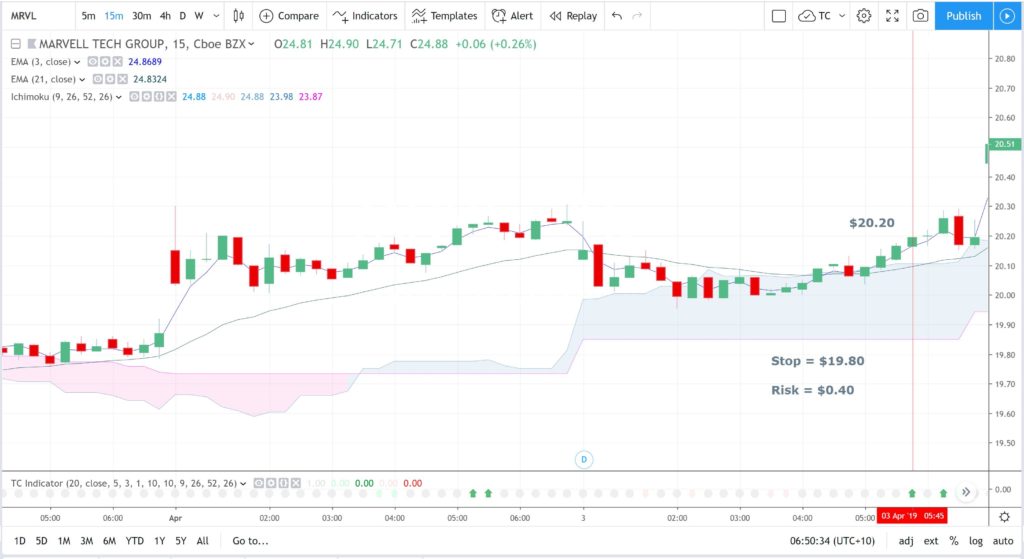
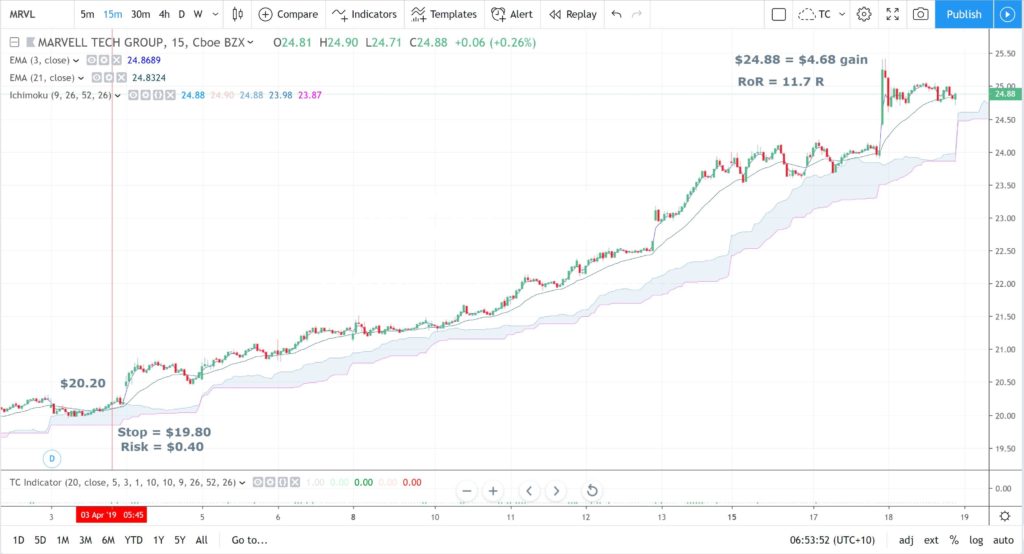
MRVL 15 min: Just out of interest, this breakout period was one where I would be looking for shorter-term LONG trading TC signal opportunity off the 15 min charts and one such opportunity came through recently. This particular TC signal gave a $4.68 gain for an RoR of 11.7 R as the before and after screen shots below reveal.
MRVL 15 min: a new tC signal:
MRVL 15 min: this TC signal gave a $4.68 gain for an RoR of 11.7 R:
MRVL weekly: the stock pulled back to the 61.8% Fibonacci level by late March 2019:
MRVL weekly: the stock actually continued all the way up to the 100% level, near the whole-number $25 level. I will be now be watching for any pause, or even pullback, at this psychological level:
MRVL: Where to from here?
Downside targets:
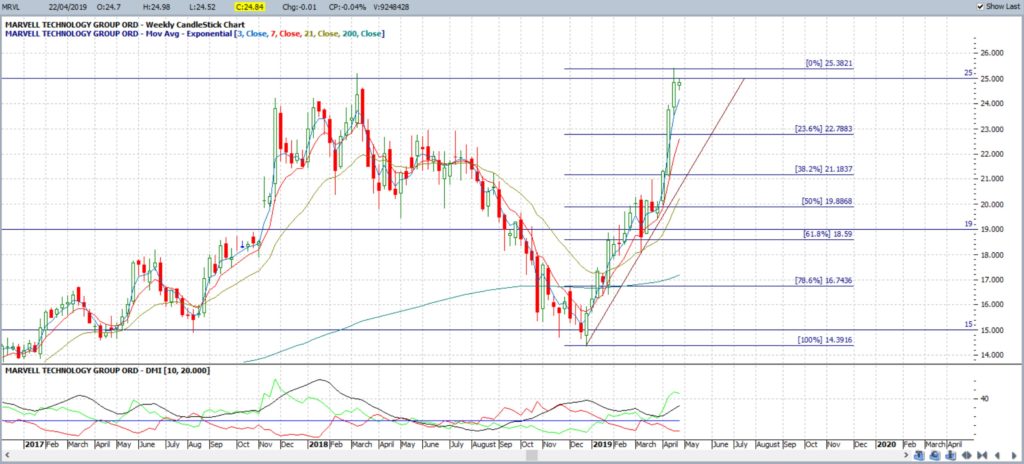
To help assess any downside targets I have applied Fibonacci retracement to the last swing High move, that being from Dec 2018 until April 2019.
MRVL weekly: Note how there is a support trend line underneath this Dec 2018 – April 2019 swing High move. Any break and hold below the support trend line would have me, in the first instance, looking for any potential consolidation-style Bull Flag. However, continued weakness would bring the 61.8% Fibonacci level into focus as this is a popular fib level and sits down near the previous S/R zone of $19. Any break and hold below $19 would bring the prior Low, near the 100% fib level and circa $15, into focus.
Upside targets:
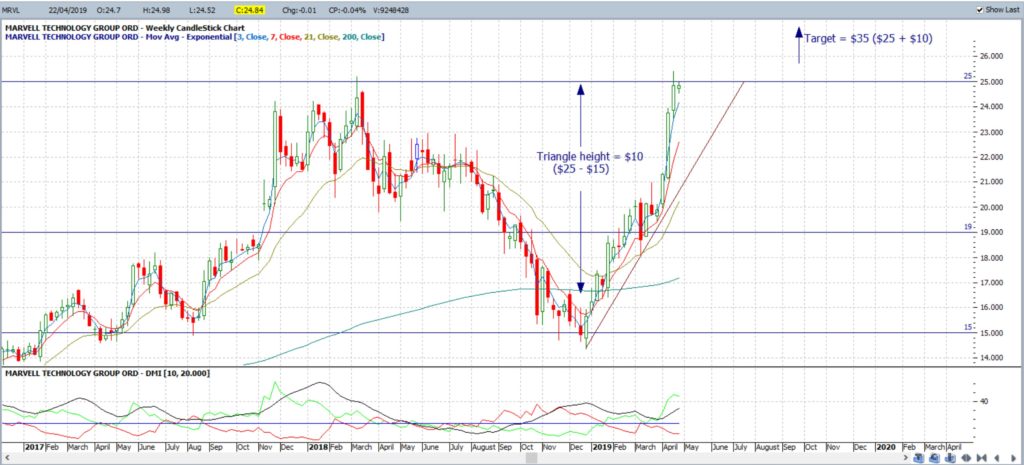
MRVL weekly: Any close and hold above $25 would be a bullish signal and would underpin a continuation move. The weekly chart below shows price action could be considered as shaping up in a bullish Ascending Triangle. The Height of this triangle is around $10 and so that would be the size of the extension move that traders might use as their bullish target. This would put price action up near $35.
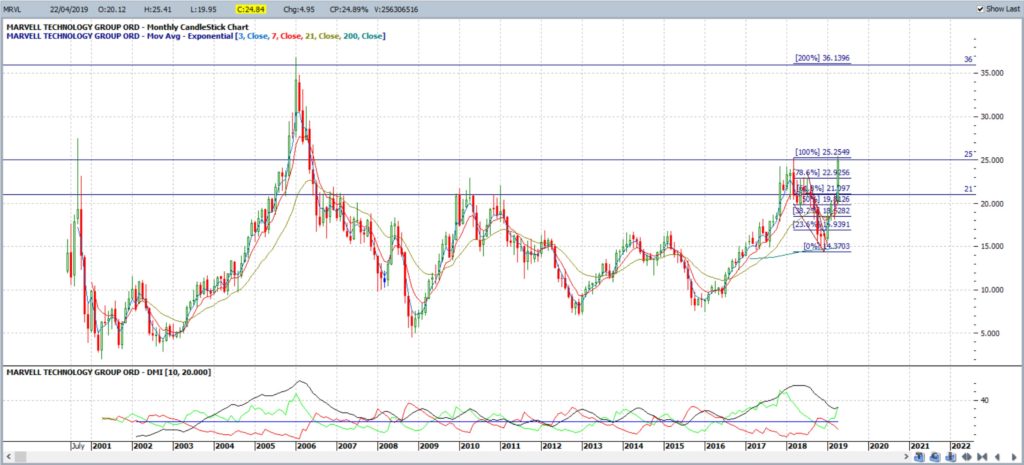
MRVL monthly: the monthly chart below shows that the 200% Fibonacci extension of the recent Descending Wedge breakout move is up near the High from 2006, of around $36. There is added confluence with this level as this is near the target of the weekly chart’s new Ascending Triangle.
Summary: Marvell Technology Group has just completed a 100% retracement move following a Descending Wedge breakout. The stock price is now hovering near the $25 and traders should keep an open mind about the next movement from this level.
- Bearish target: A pause, or even pullback, following this recent rally would not be out of order, even if there is to be eventual bullish continuation. Fibonacci retracement was applied to identify potential bearish pullback targets and the 61.8% fib lies down near previous S/R of $19 and so this would be the key bearish target. Any further weakness would bring the 100% Fibonacci level, near $15, into focus.
- Bullish target: Price action is currently shaping up in a new technical pattern though; that of an Ascending Triangle. The $35 bullish target for this bullish continuation breakout move aligns very closely to the 200% Fibonacci retracement level and so is added confluence for using this as a bullish target.
Disclosure: I don’t hold any current positions in MRVL but will be selling Put Options over the next few months.


