Last week: There have been a lot of conflicting signals of late: Covid-19 cases are spiking across Europe, and there is concern of similar across the USA with schools returning, yet the risk-on type assets of Emerging markets, Copper and the small-caps Russell-2000 Index closed with bullish-coloured weekly candles and the Fear Index, VIX, closed lower and remains below the threshold 30 level. Down under, Australia still has closed international borders, as well as many internal borders and ongoing tensions with their major trading partner (China), that plague its economic recovery yet the ASX-200 index printed a bullish-reversal style weekly candle and on increased volume. The US stock market majors of the S&P500, DJIA and NASDAQ all closed with bearish weekly candles but their weekly charts could just as easily be viewed as potential Bull Flags! And the risk-on NZD$ has rallied along side the risk-off JPY¥. It is no wonder, then, that there have been many indecision-style weekly candles printed again! All of this reflects the need for traders to avoid adopting any particular bias and to trade what they see and not what they think. The US$ index remains range-bound and so there are few leads for many of the Forex majors just yet. Gold also remains range-bound, and, looking over the economic calendar doesn’t reveal any scheduled item(s) that might jolt the markets out of these consolidation-style moves. September and October are historically weak for stock markets but I do wonder if this sideways action might drift on until the November 3rd US presidential Election?
Technical Analysis: As noted over recent months, it is important to keep in mind that this analysis is Technical and chart-based but that any major Fundamental news items, as recently seen with Coronavirus, have the potential to quickly undermine identified chart patterns. This is why it is critical that traders appropriately manage their trade exposure and risk per trade during these volatile market conditions.
Trend line breakouts summary: There were only a few trend line breakouts and one suspects the market mood is a bit skewed when the best move came from the USD/JPY! Articles published during the week can be found here, here, here, and here:
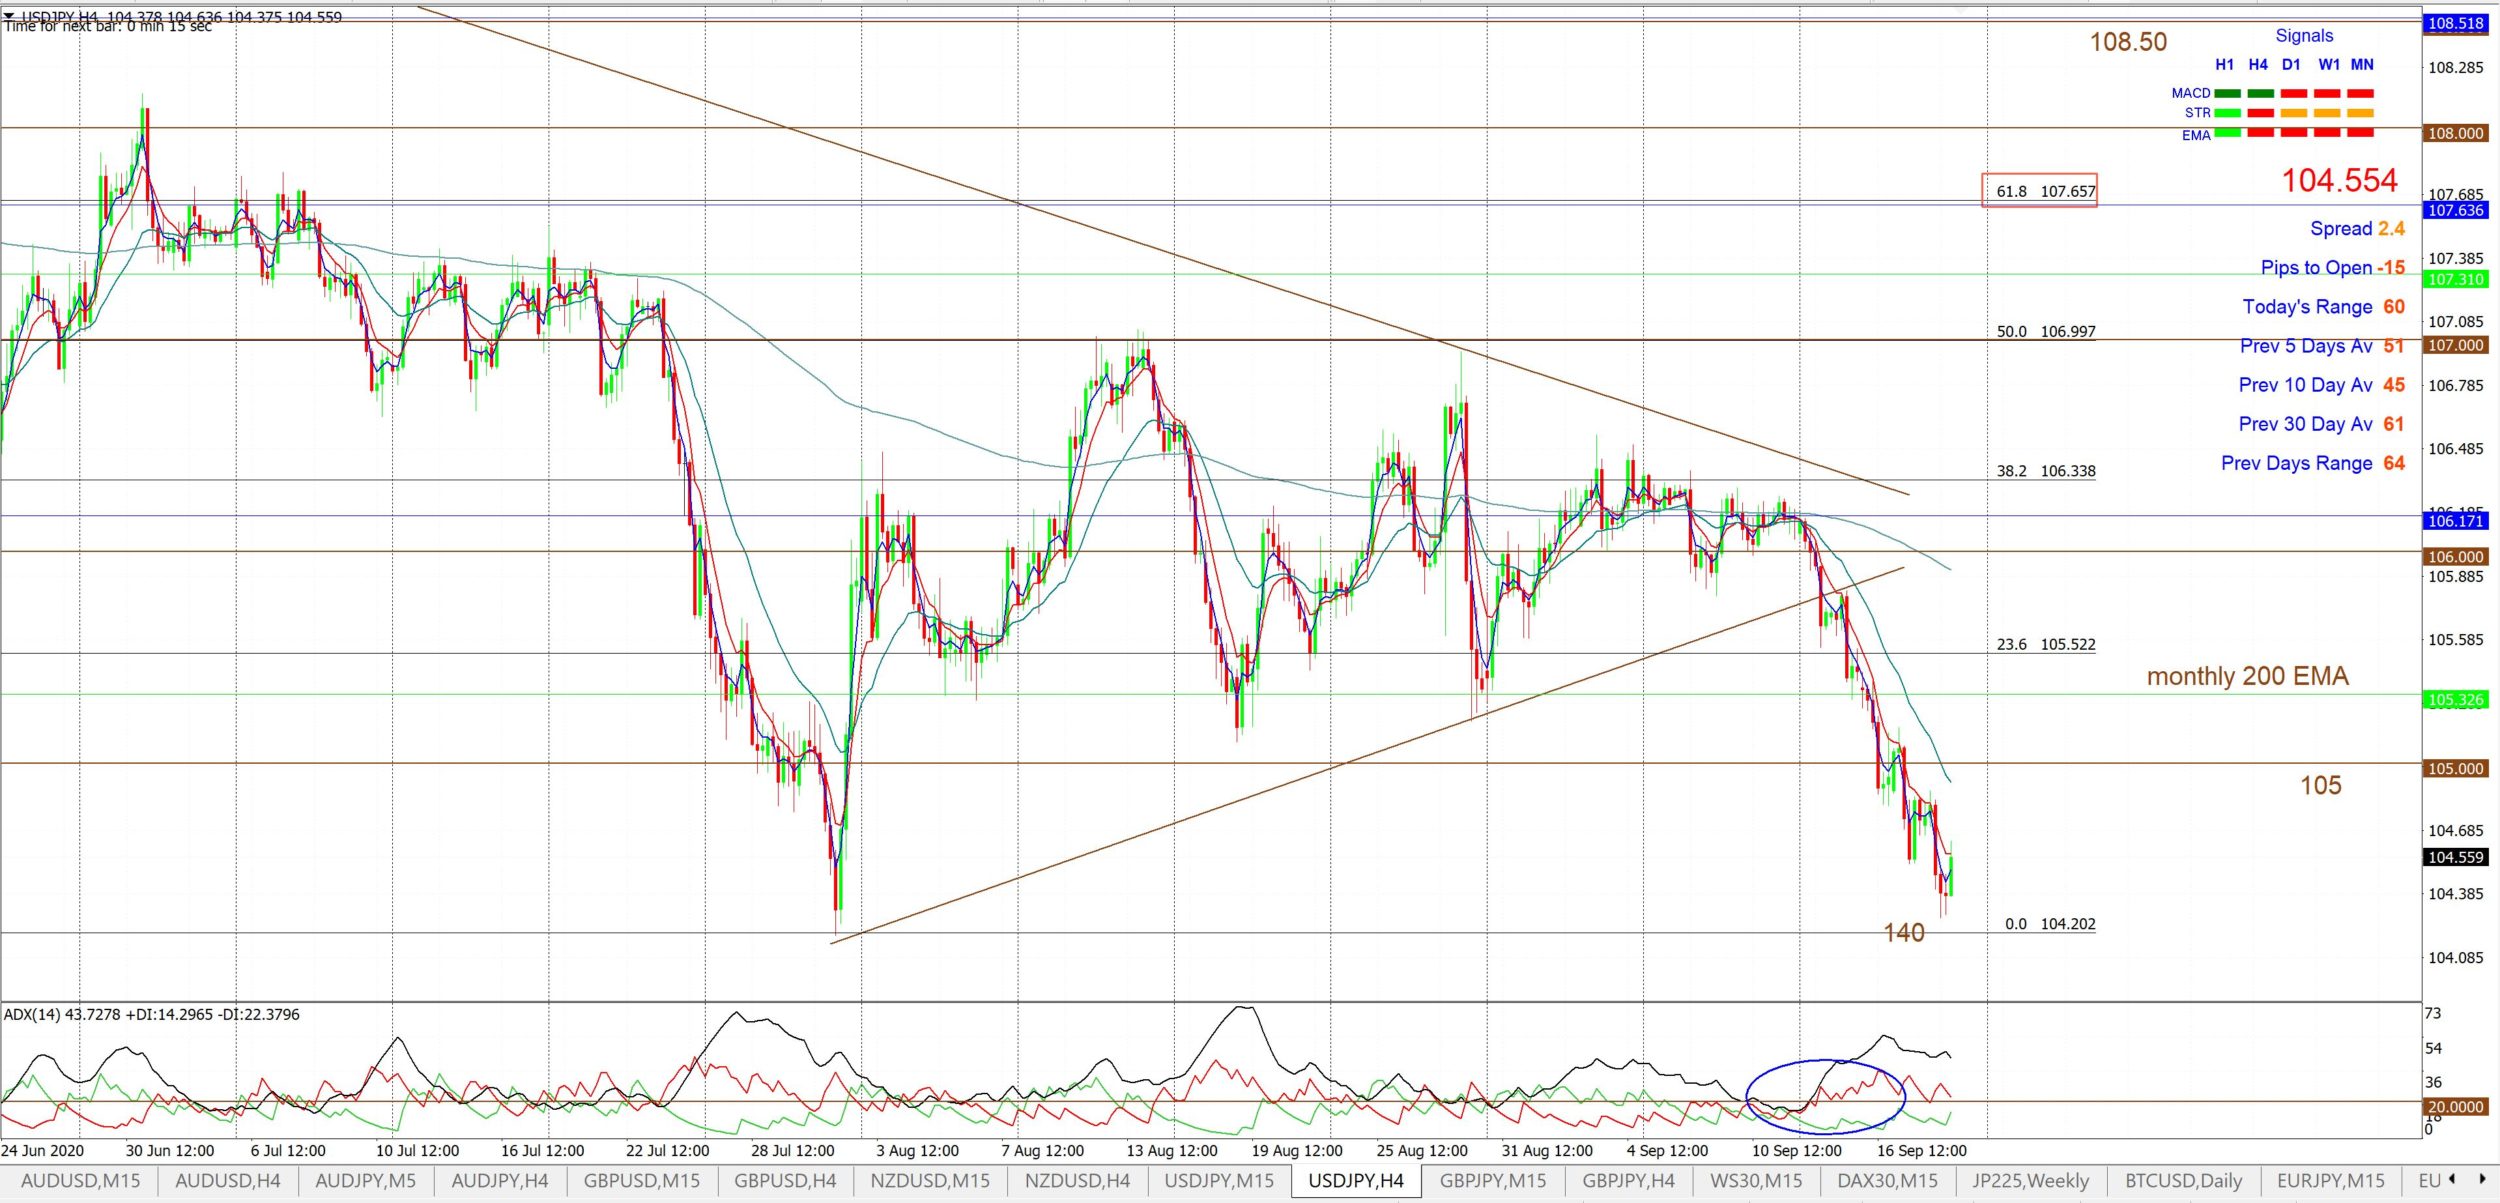
- USD/JPY: a TL b/o from last week’s chart pattern for up to 140 pips:
- S&P500: a 40 point TL breakout.
- ASX-200: a 60 point TL breakout.
- GBP/USD: a TL b/o for 100 pips.
This Week: (click on images to enlarge):
-
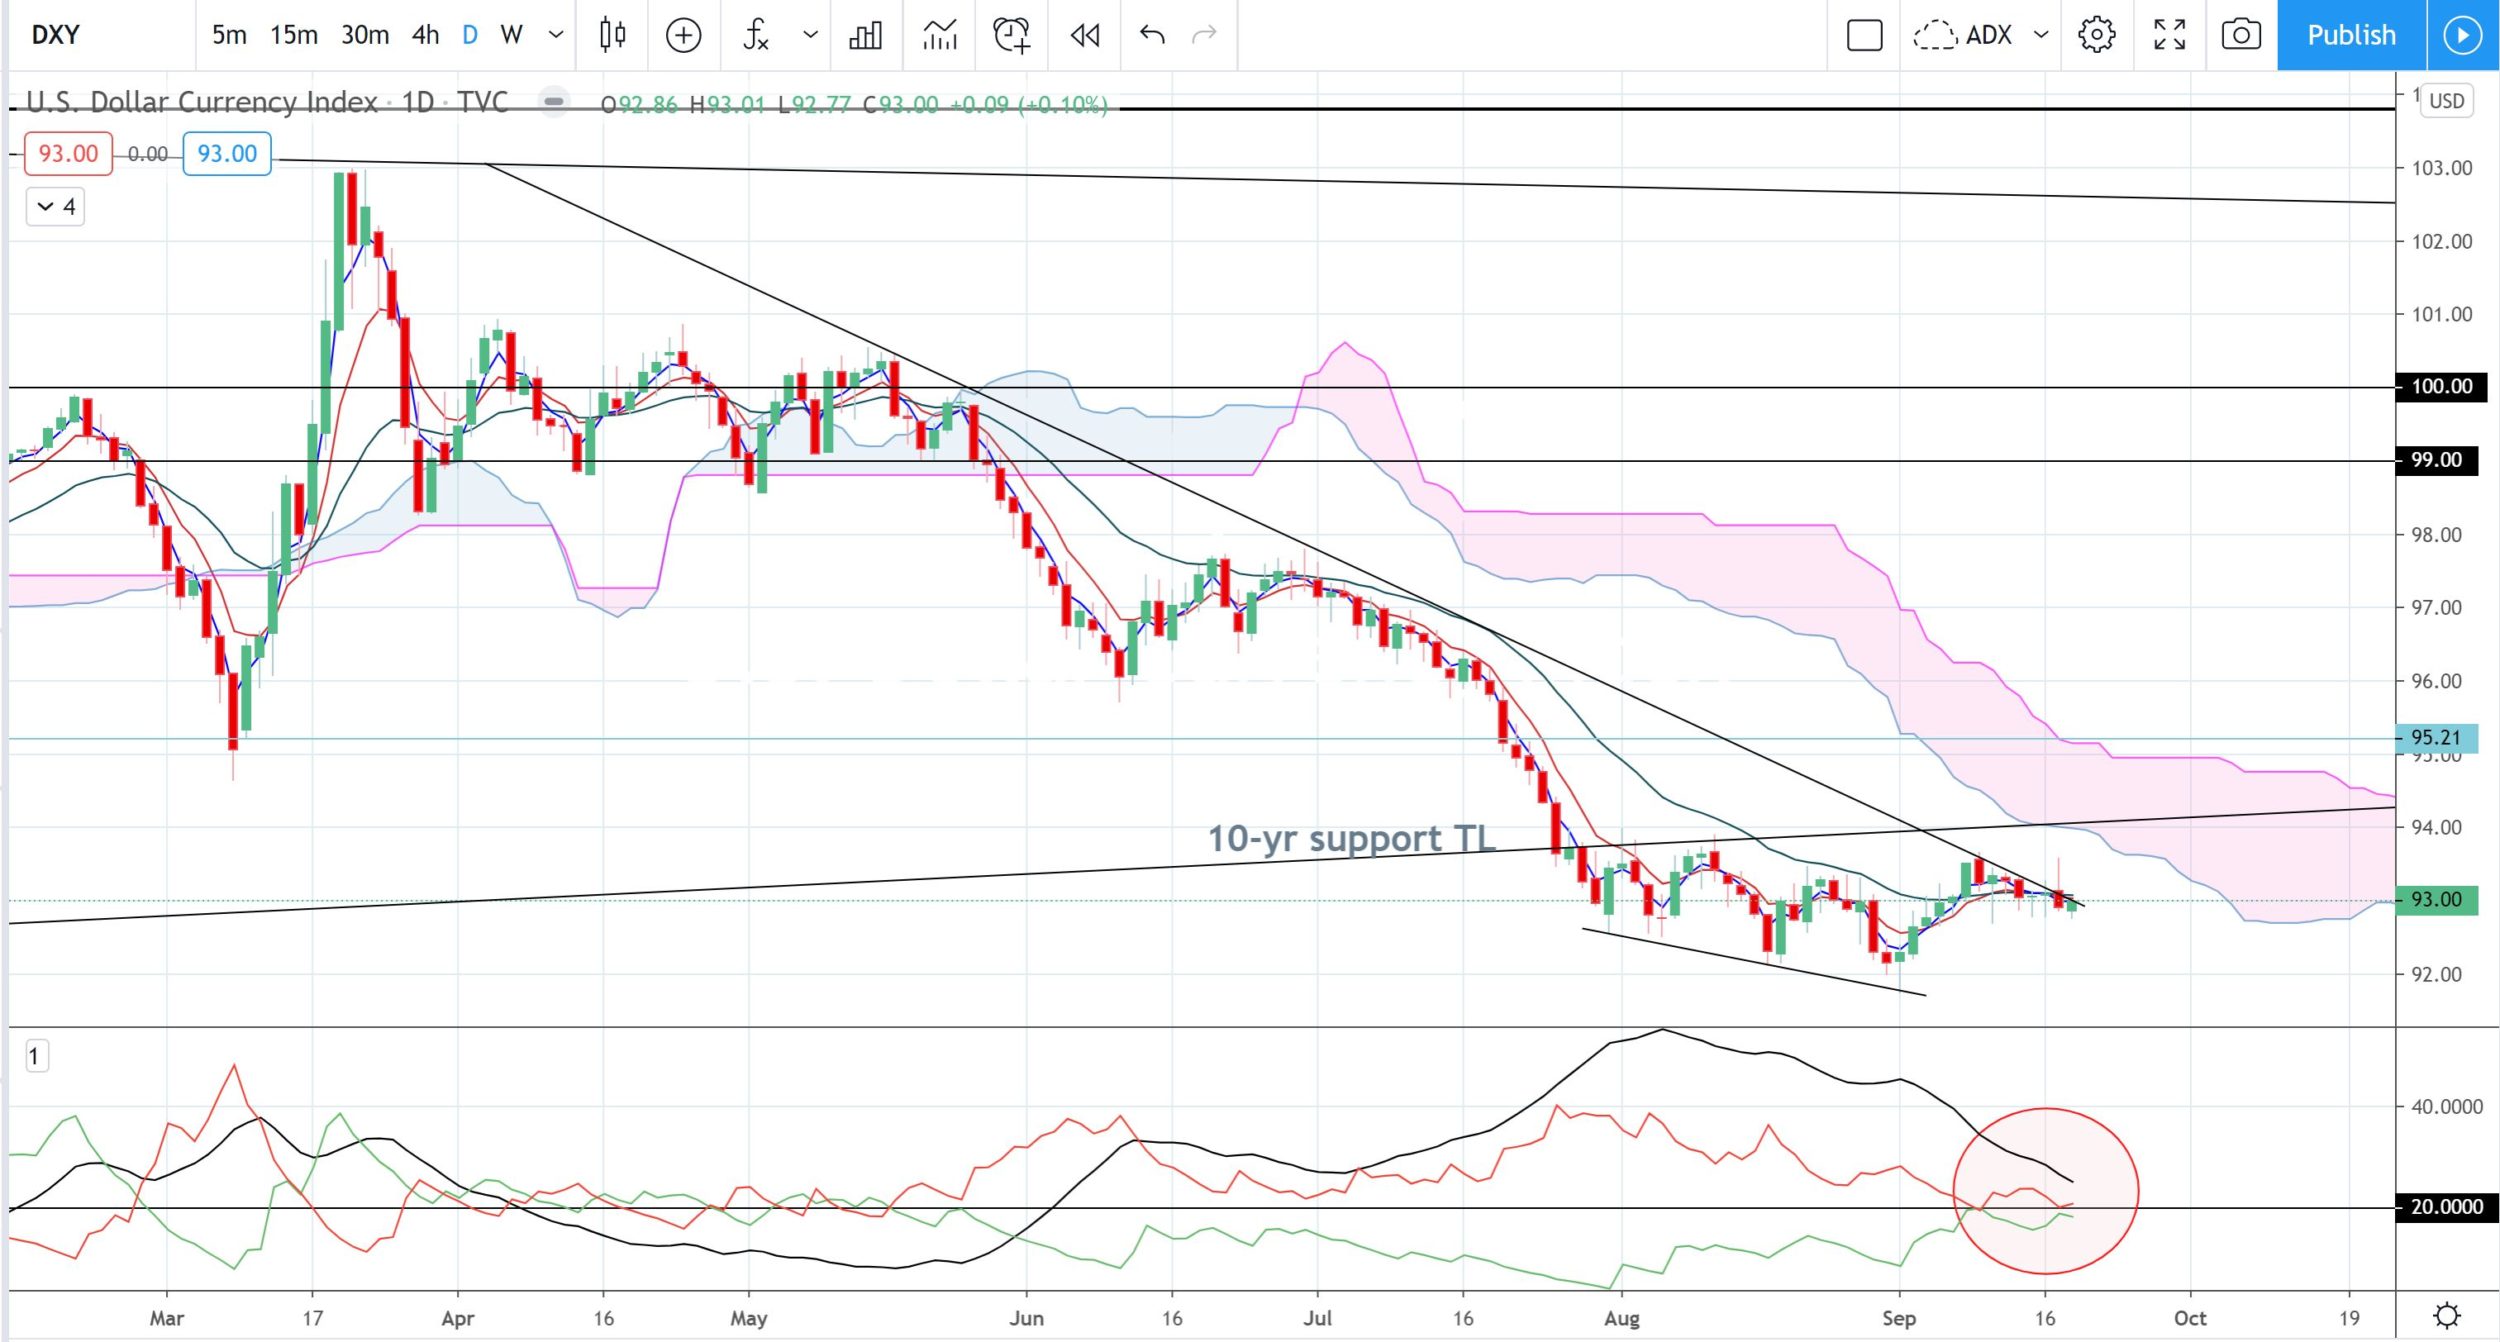
- DXY: US$ Index: There has been little change here over recent weeks as the US$ index closed with a bearish-coloured Spinning Top weekly candle and continues to struggle under the recently broken 10-year support trend line. There is still the look of a bullish-reversal Descending Wedge here though so watch for any relief rally; even if it’s only temporary. Momentum remains low for now but monitor for any uptick with the ADX on any trend line breakout. Also keep watch of the 10-yr bear trend line as this previous Support will likely become Resistance.
DXY daily: note the recent batch of small daily candles:
-
- Schedule for weekend Market Update posts: The Weekly Market update has, to date, been posted on a Sunday, Australian time. I am looking to delay the release of this update to a Monday, Australian time, which is still a Sunday in many other parts of the world. My analysis takes a full day to complete and I am attempting to shift this load away from my weekend time.
-
- Indecision-style weekly candles: indecision-style weekly candles were printed on many instruments again last week: the DXY, S&P500, NASDAQ, DJIA, DAX, Gold, TLT, VIX, EUR/USD, AUD/USD, GBP/USD and GBP/JPY.
-
- Central Bank Updates: there are two Central Bank update this week for the RBNZ (NZD) and SNB (CHF).
-
- Multi-year trend lines: As noted recently and the caution remains valid: multi-year trend lines have been tested / broken on a number of instruments: The FX Indices (DXY and EURX) and the EUR/USD, AUD/USD, NZD/USD, AUD/JPY, GBP/USD and GBP/JPY. Caution is still required here though as trend lines of such duration are often not given up easily so traders should watch for any potential choppiness / consolidation as these levels are negotiated.
-
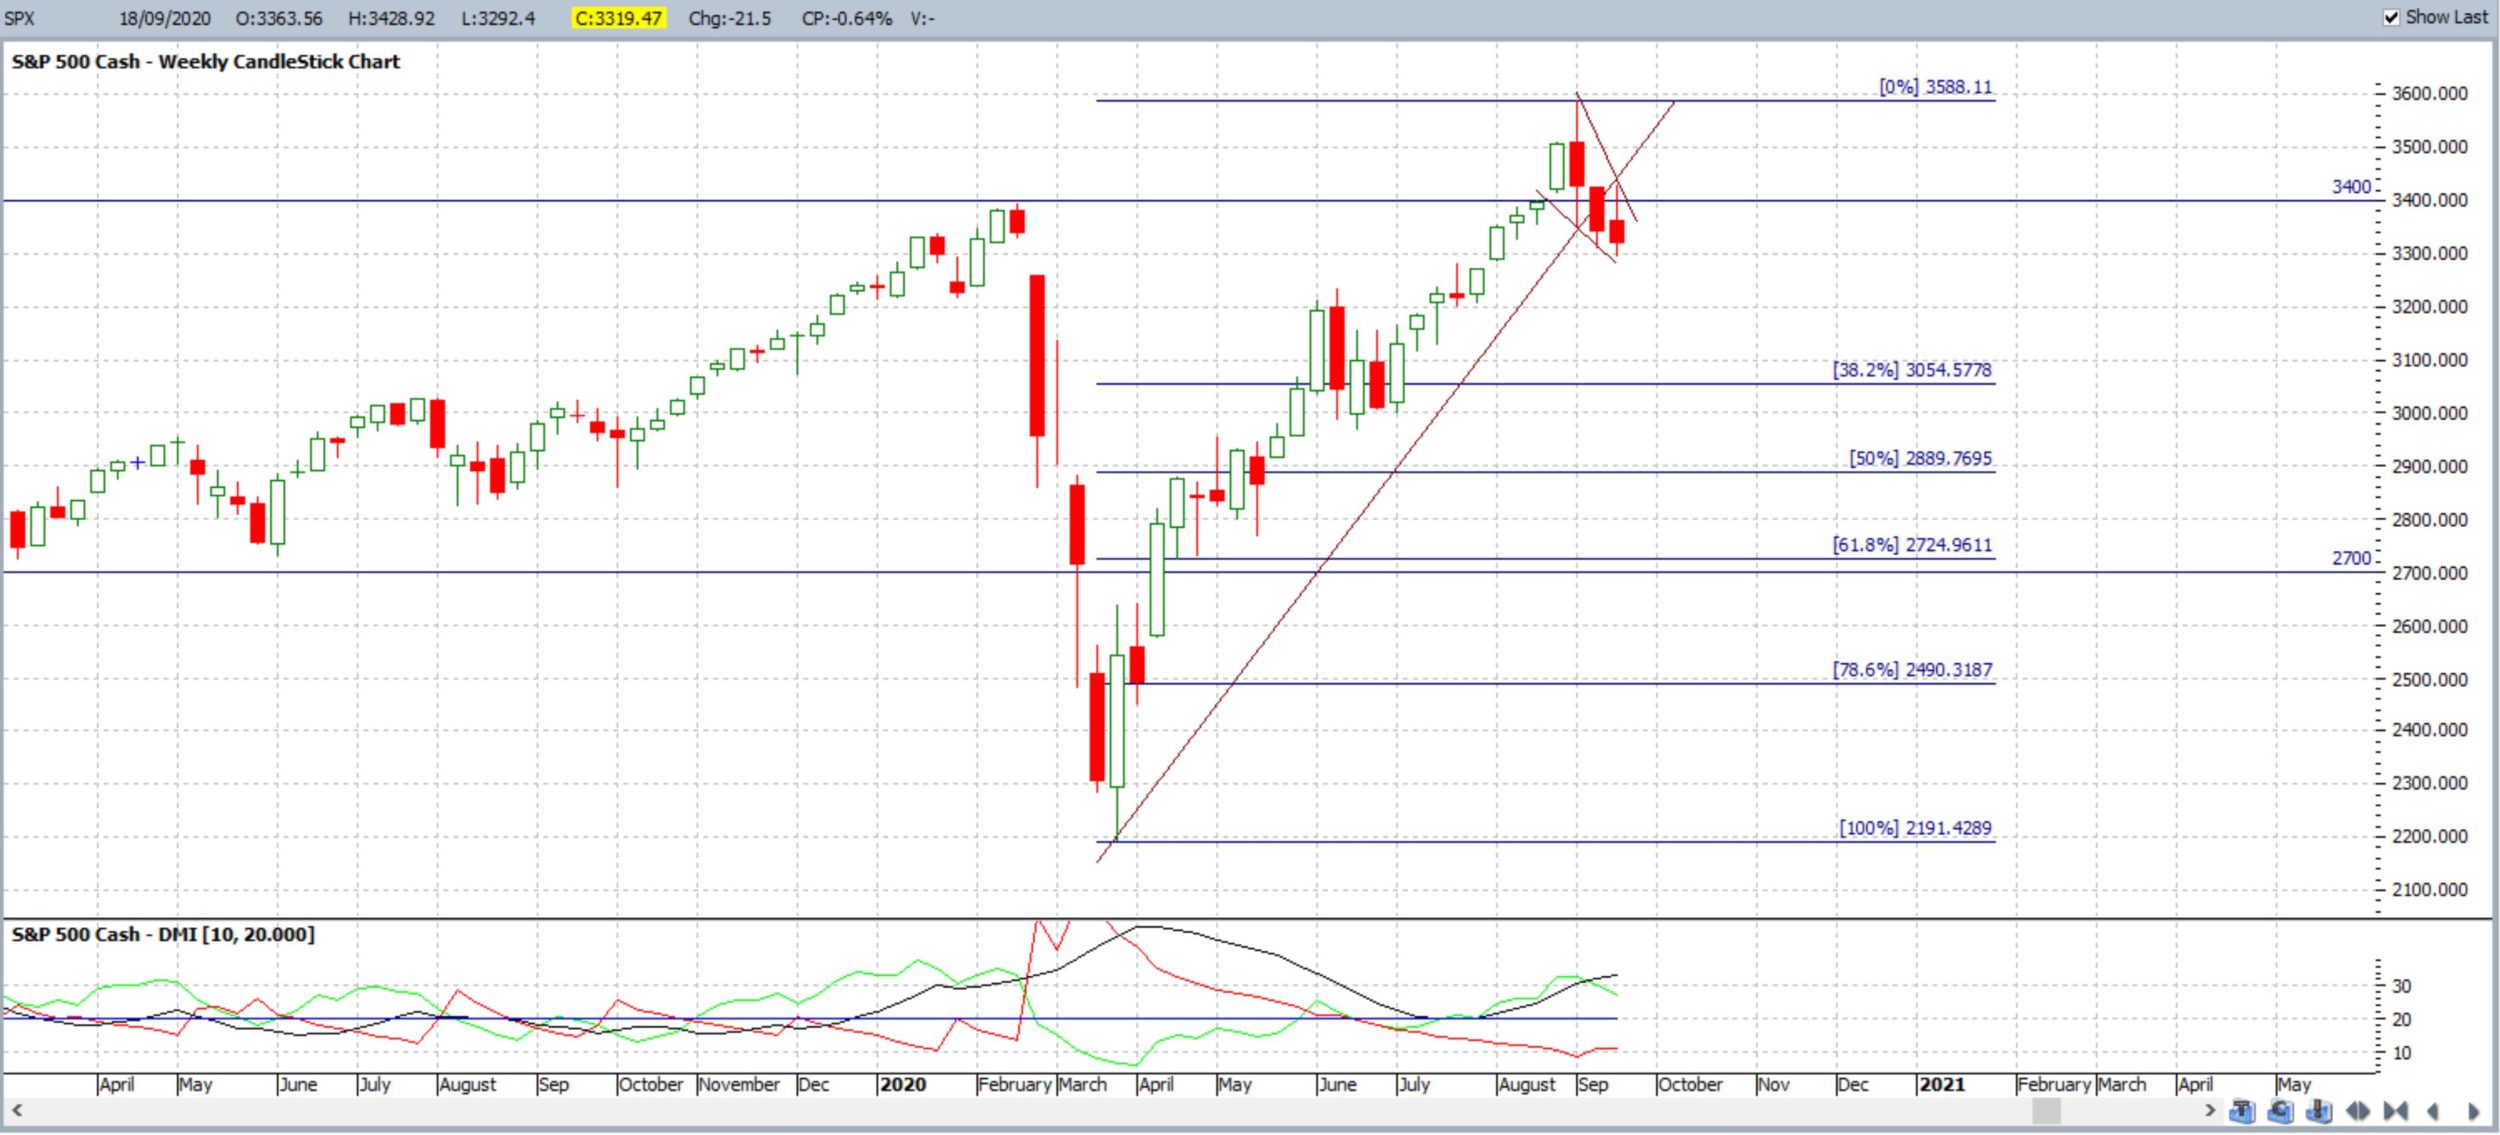
- S&P500: Keep the bigger picture in perspective with the recent moves:
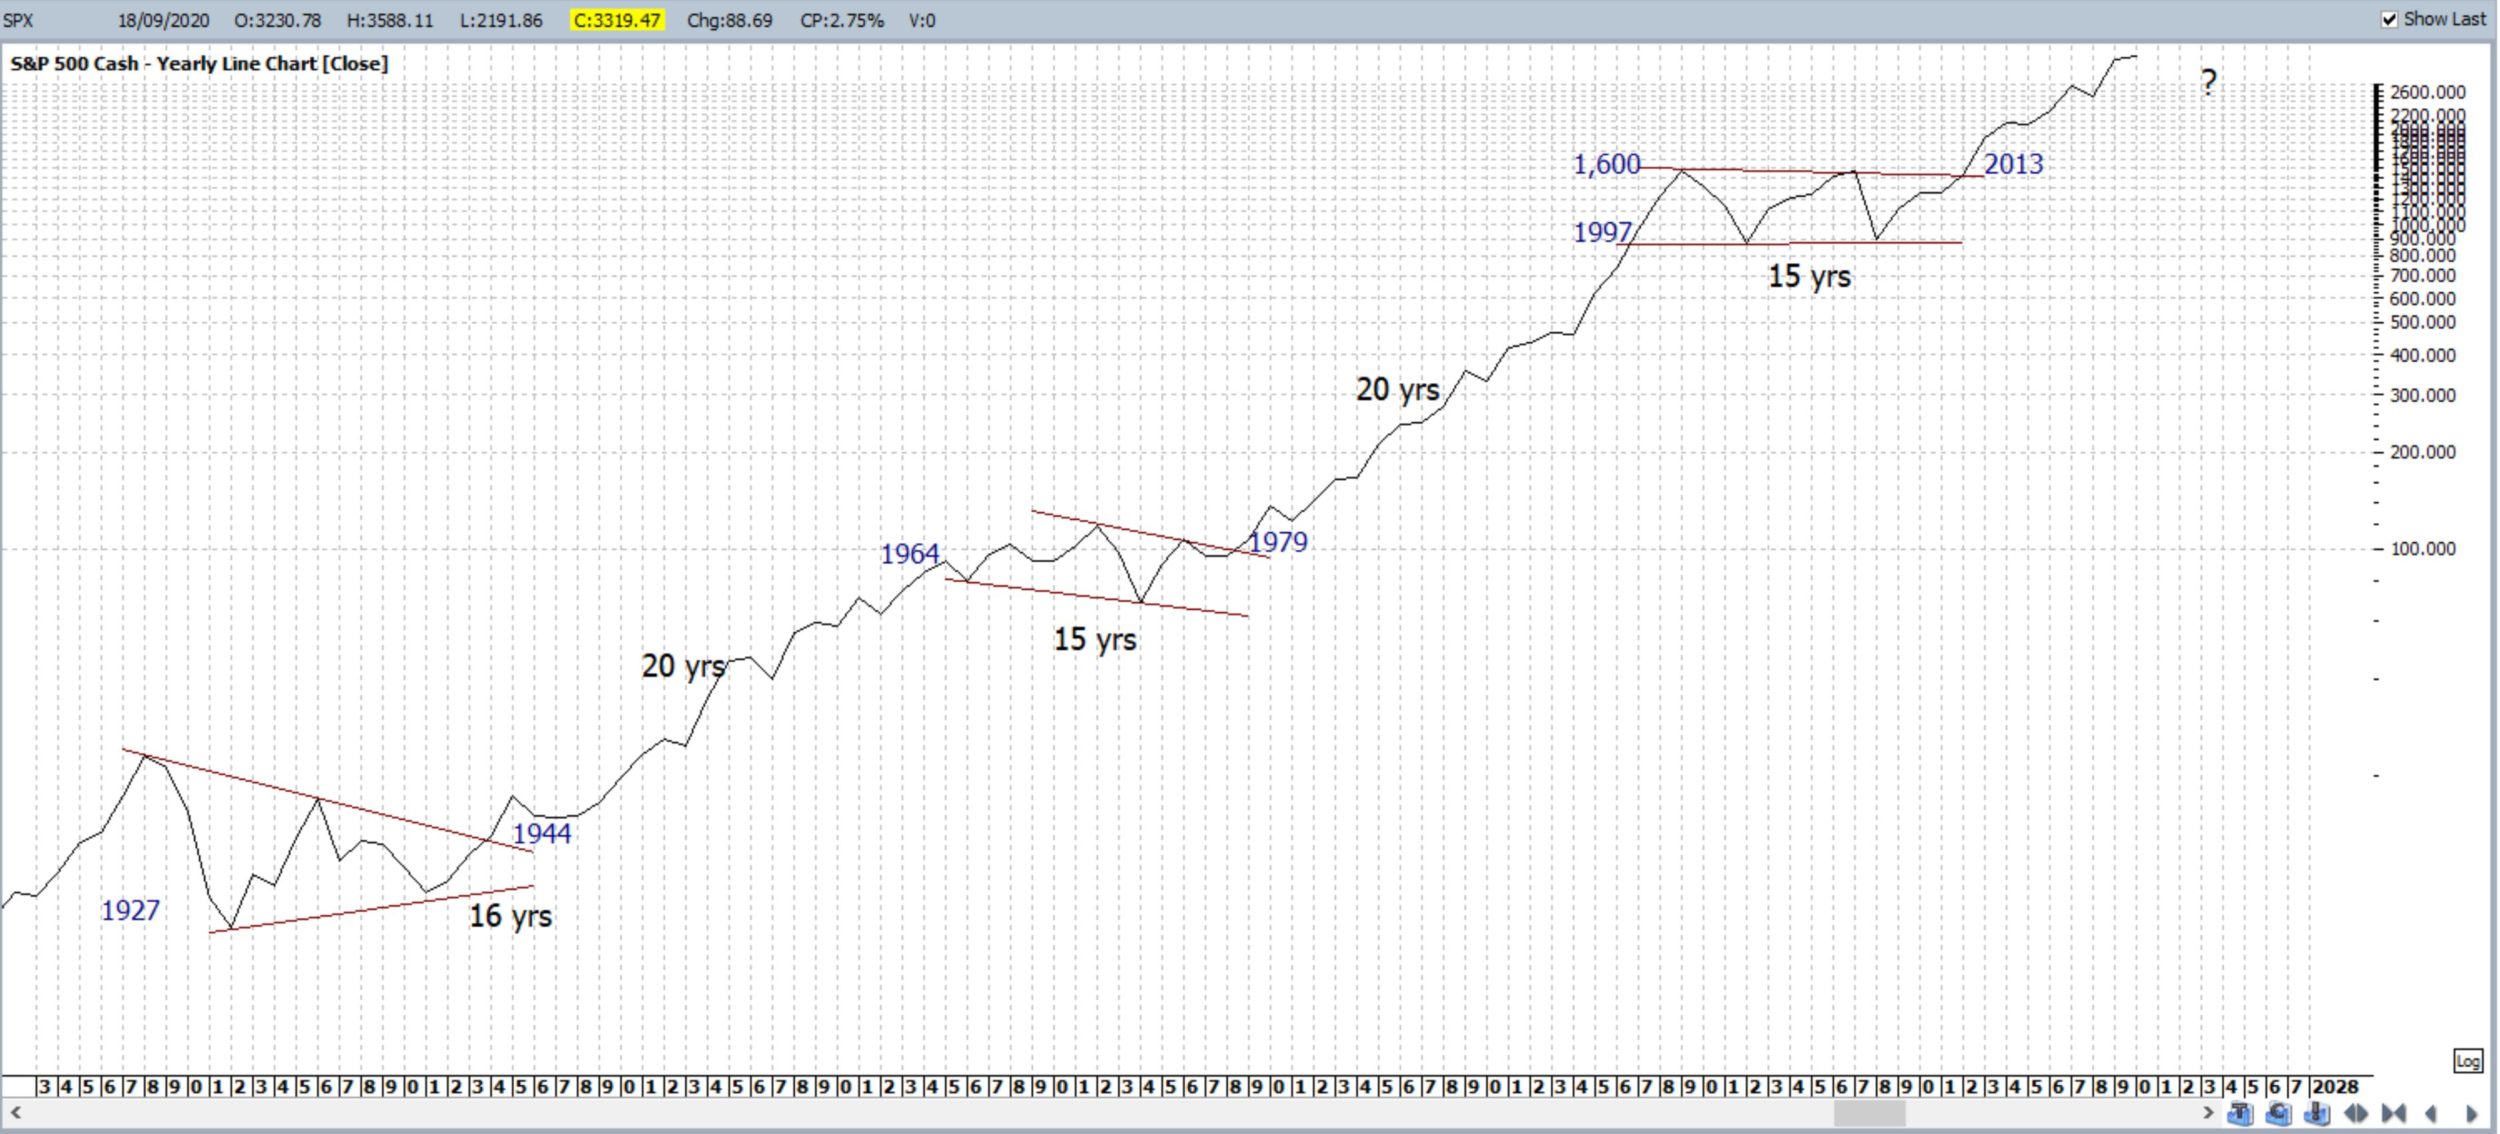
S&P500 yearly: keep this latest move in perspective:
-
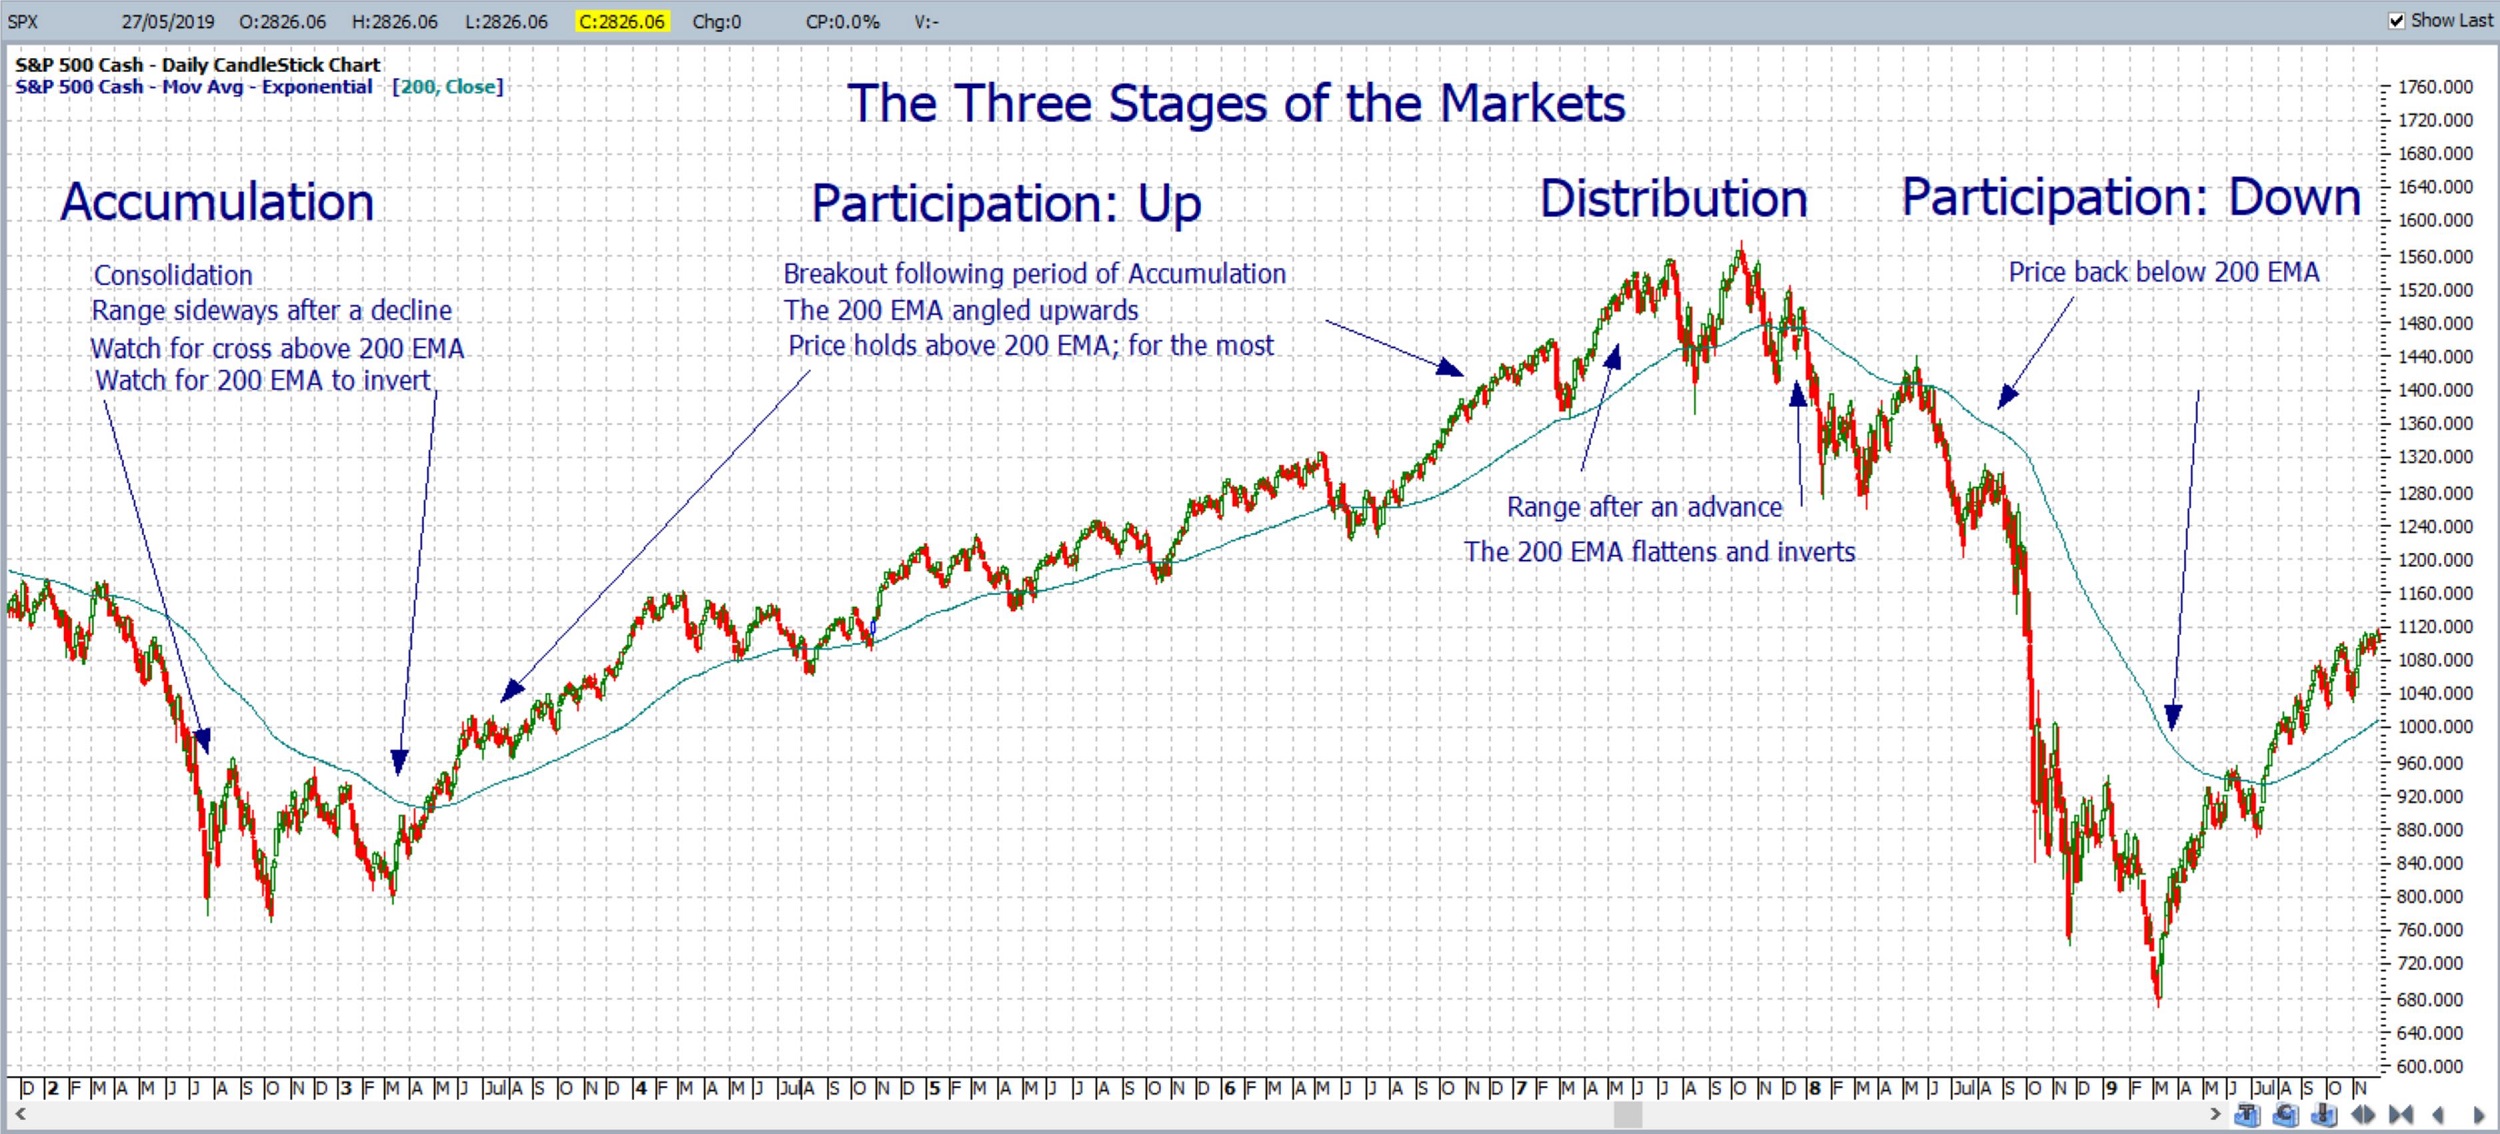
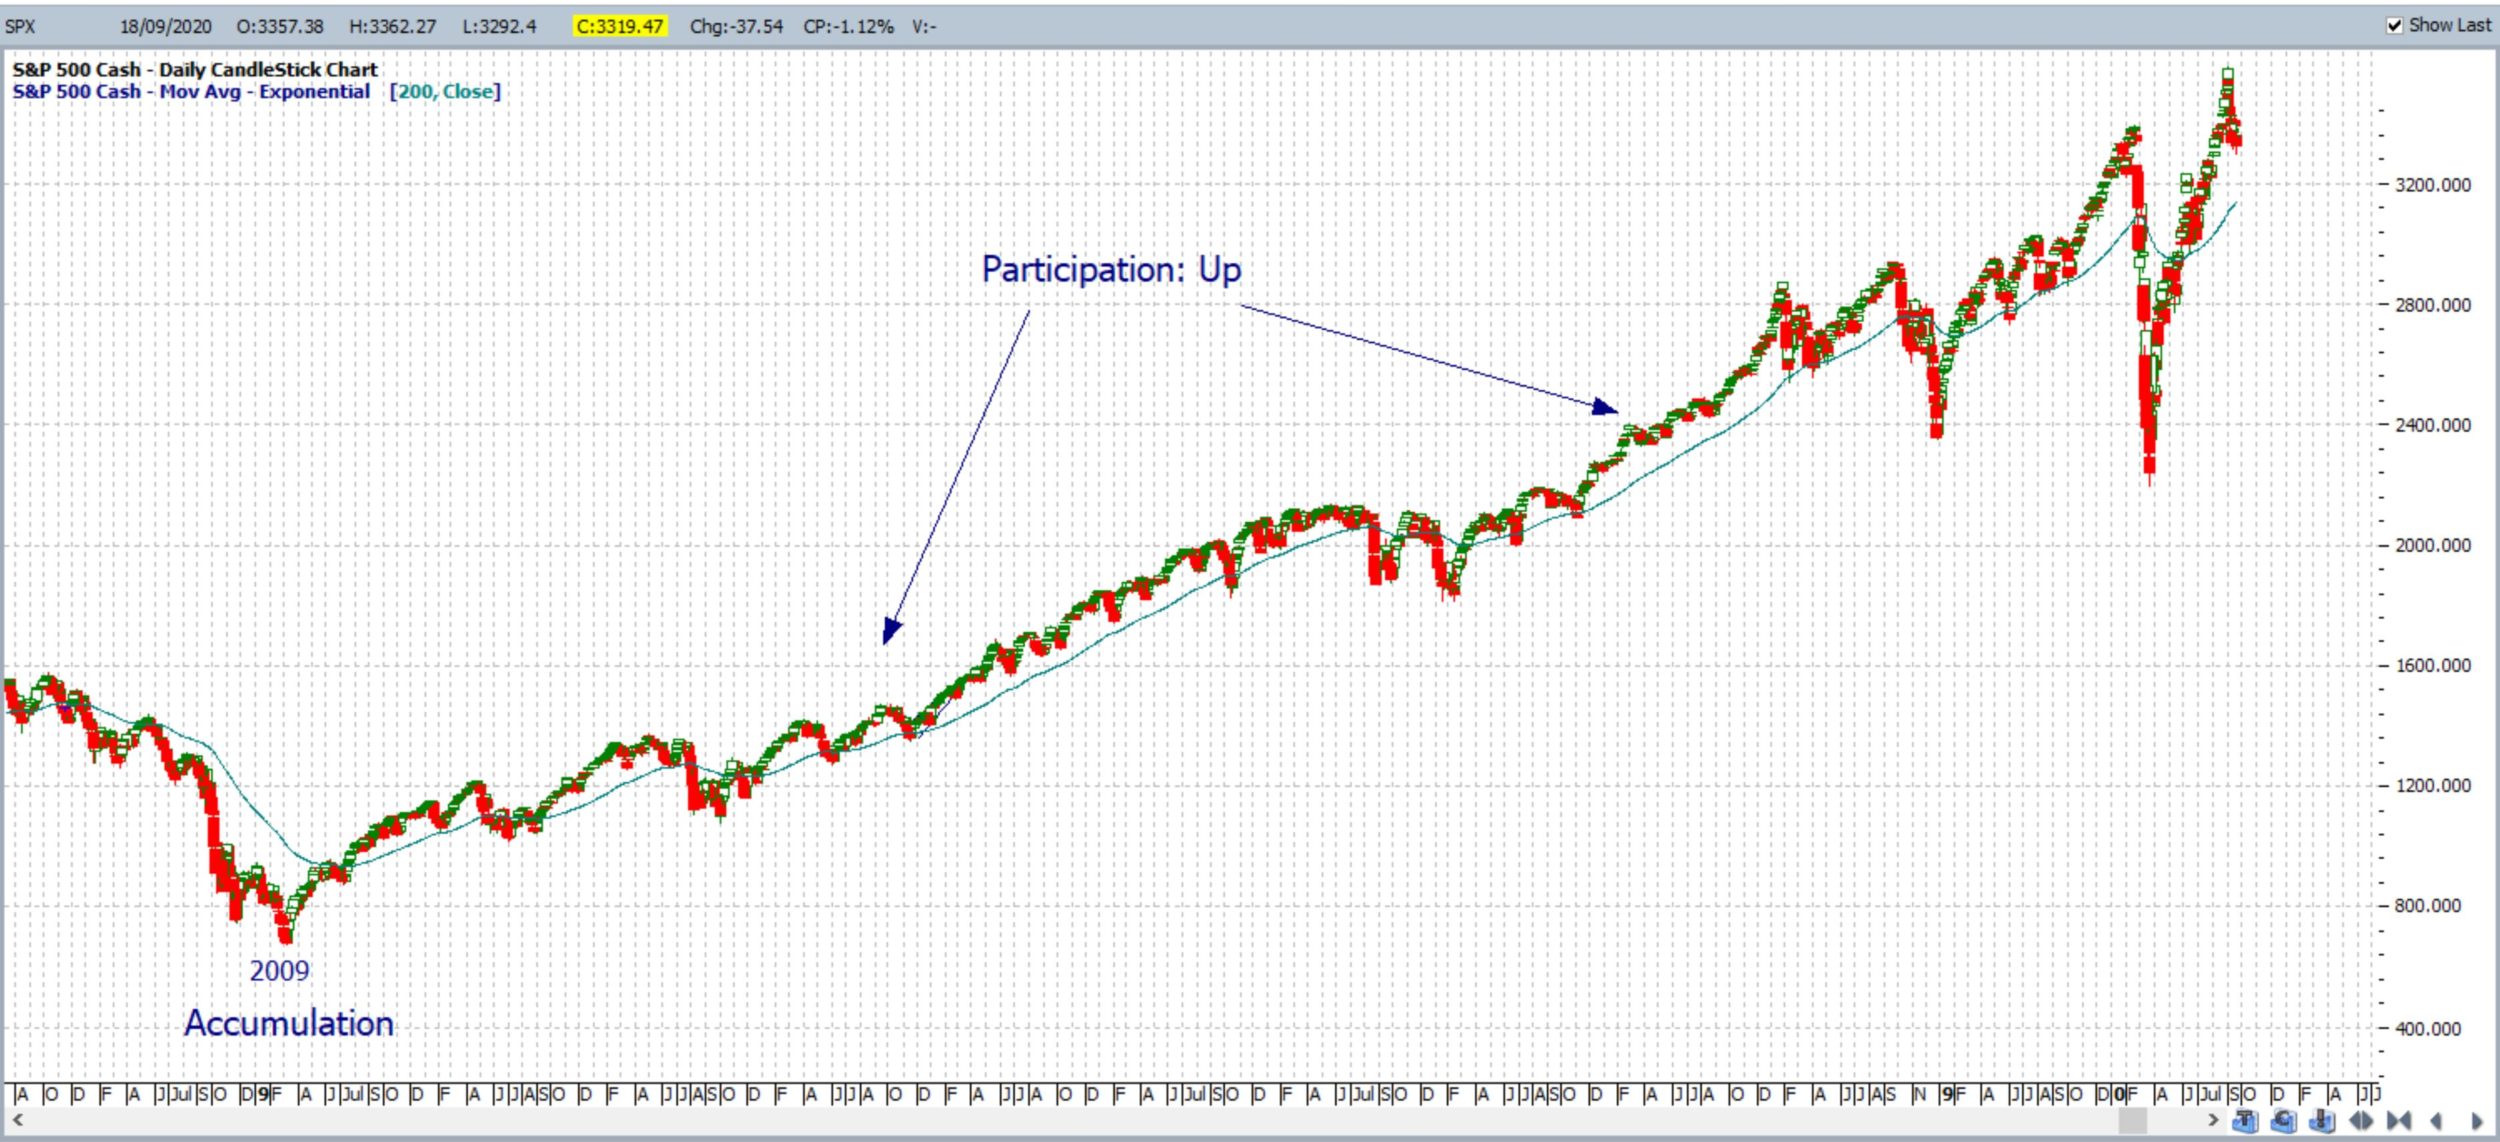
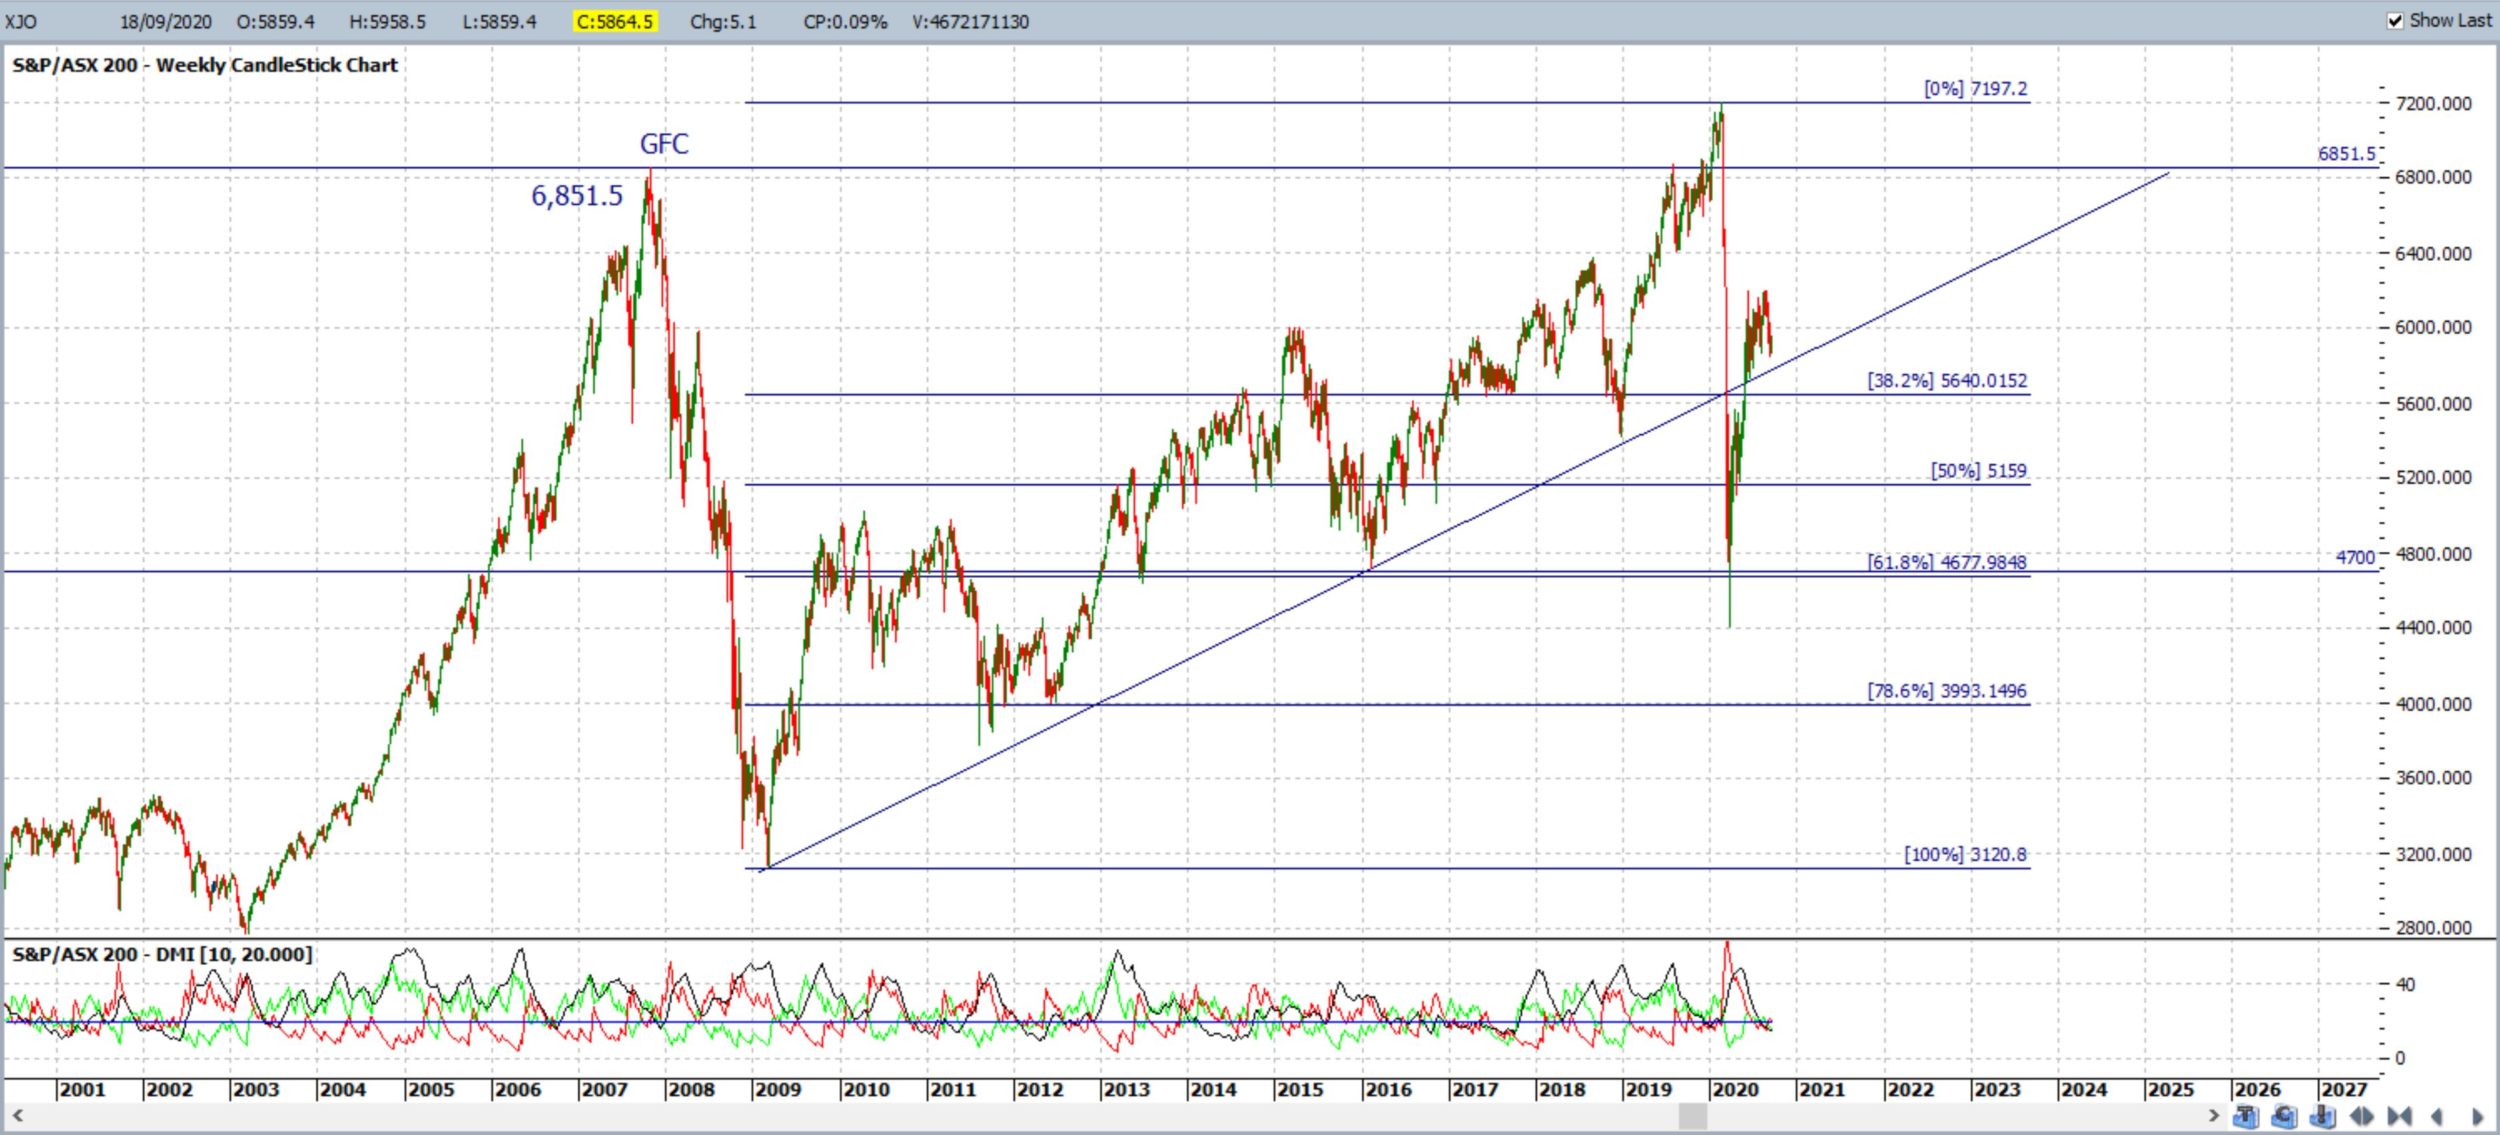
- Market Phases: It is important to recall the three main types of market phases: Accumulation, Participation (Up and Down) and Distribution. Traders should monitor the chart of the S&P500 chart for any Distribution type activity that might eventually lead to Participation Down; especially as the S&P500 has pulled back from its latest all-time High. The chart below shows how the S&P500 evolved in the years leading up to, and during, the Global Financial Crisis (GFC). Note how the Distribution phase evolved over a period of many months and there was a double test of the all-time High region. Keep this in mind with the current market action on the S&P500.
S&P500 market phases: Global Financial Crisis 2007-2009:
S&P500: keep watch for any Distribution type of activity:
-
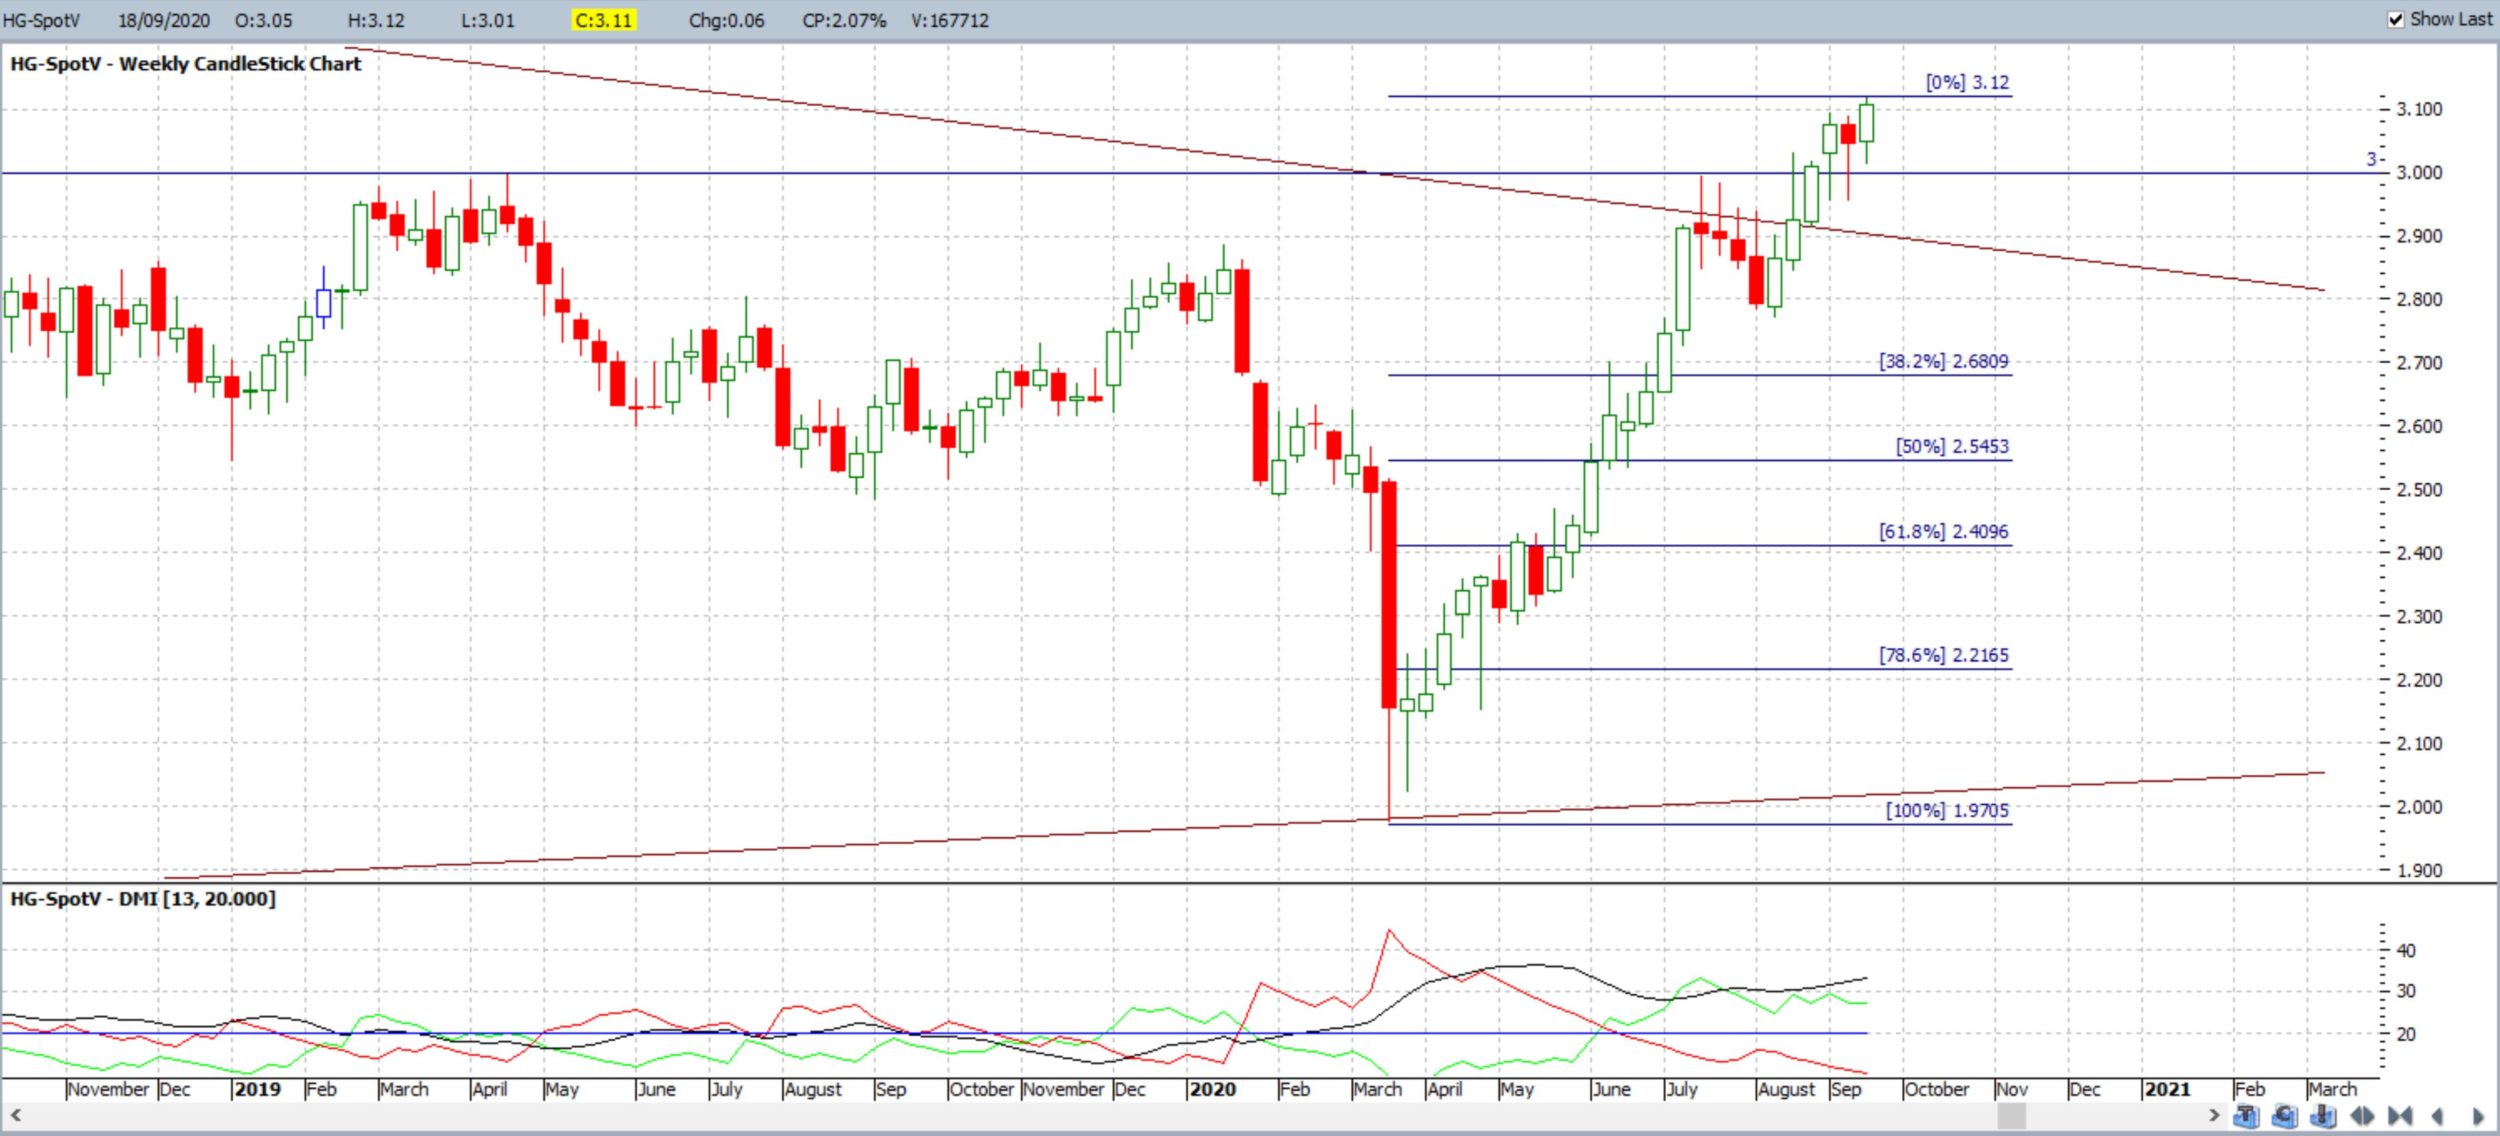
- Copper: Copper is often viewed as one metric of economic health and closed with a bullish weekly candle and continues to hold above the 3 level. The break above the 10-year bear trend line is holding as well:
Copper weekly: another weekly close above the 3 level;
-
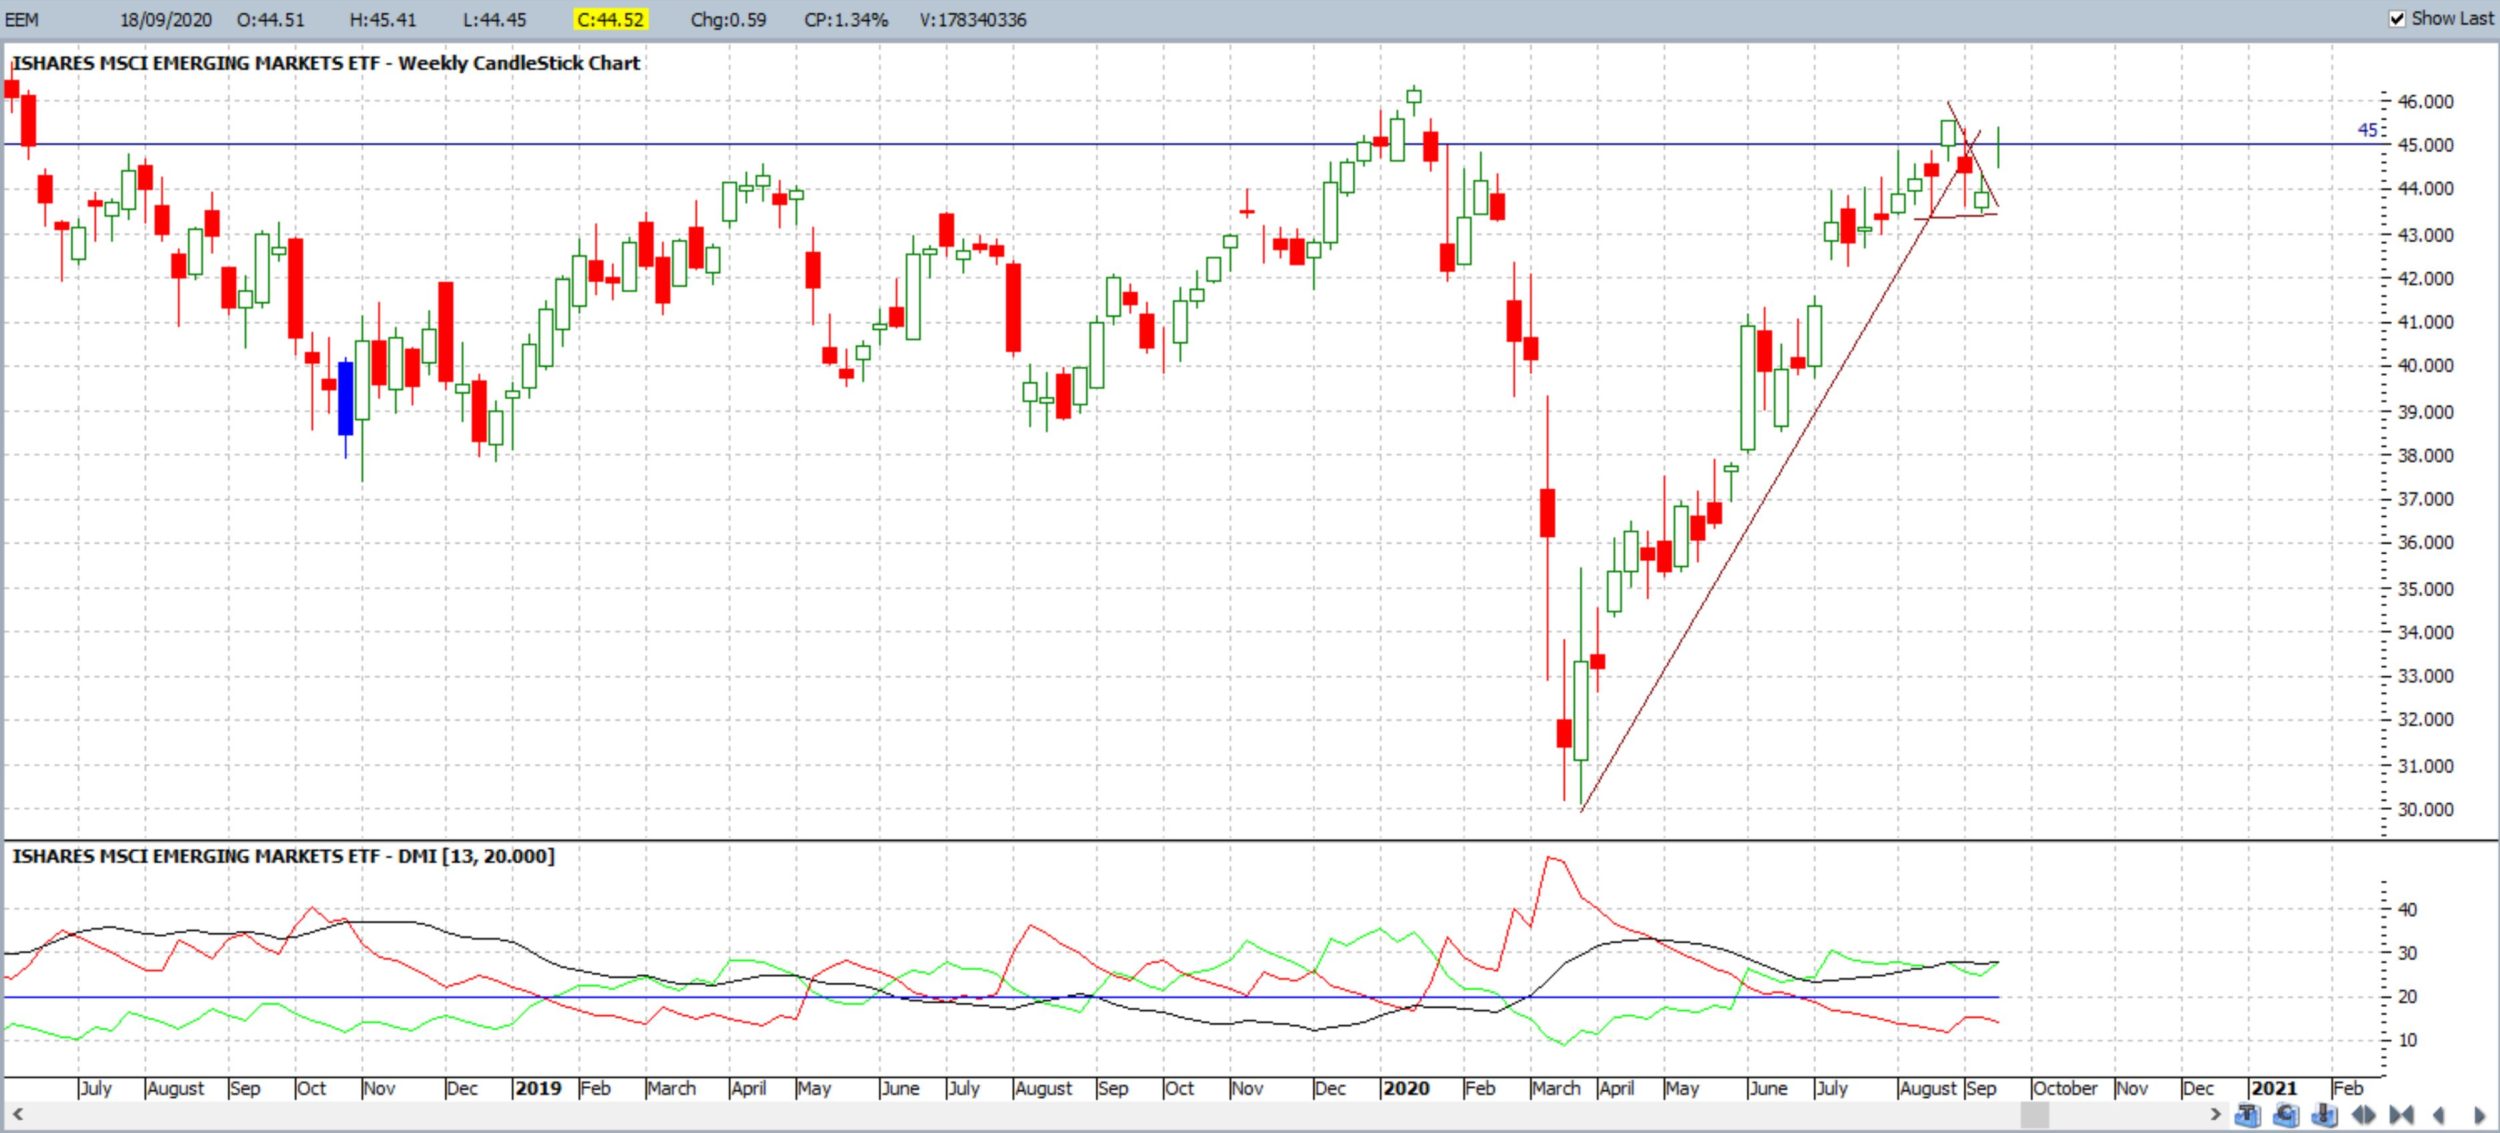
- Emerging Markets: The Emerging market ETF, EEM, has closed below the 45 level again BUT with a bullish-coloured Doji weekly candle and up and out from the Bull Flag so watch for any continuation here:
EEM weekly: still below the 45 level BUT note the Bull Flag b/o:
-
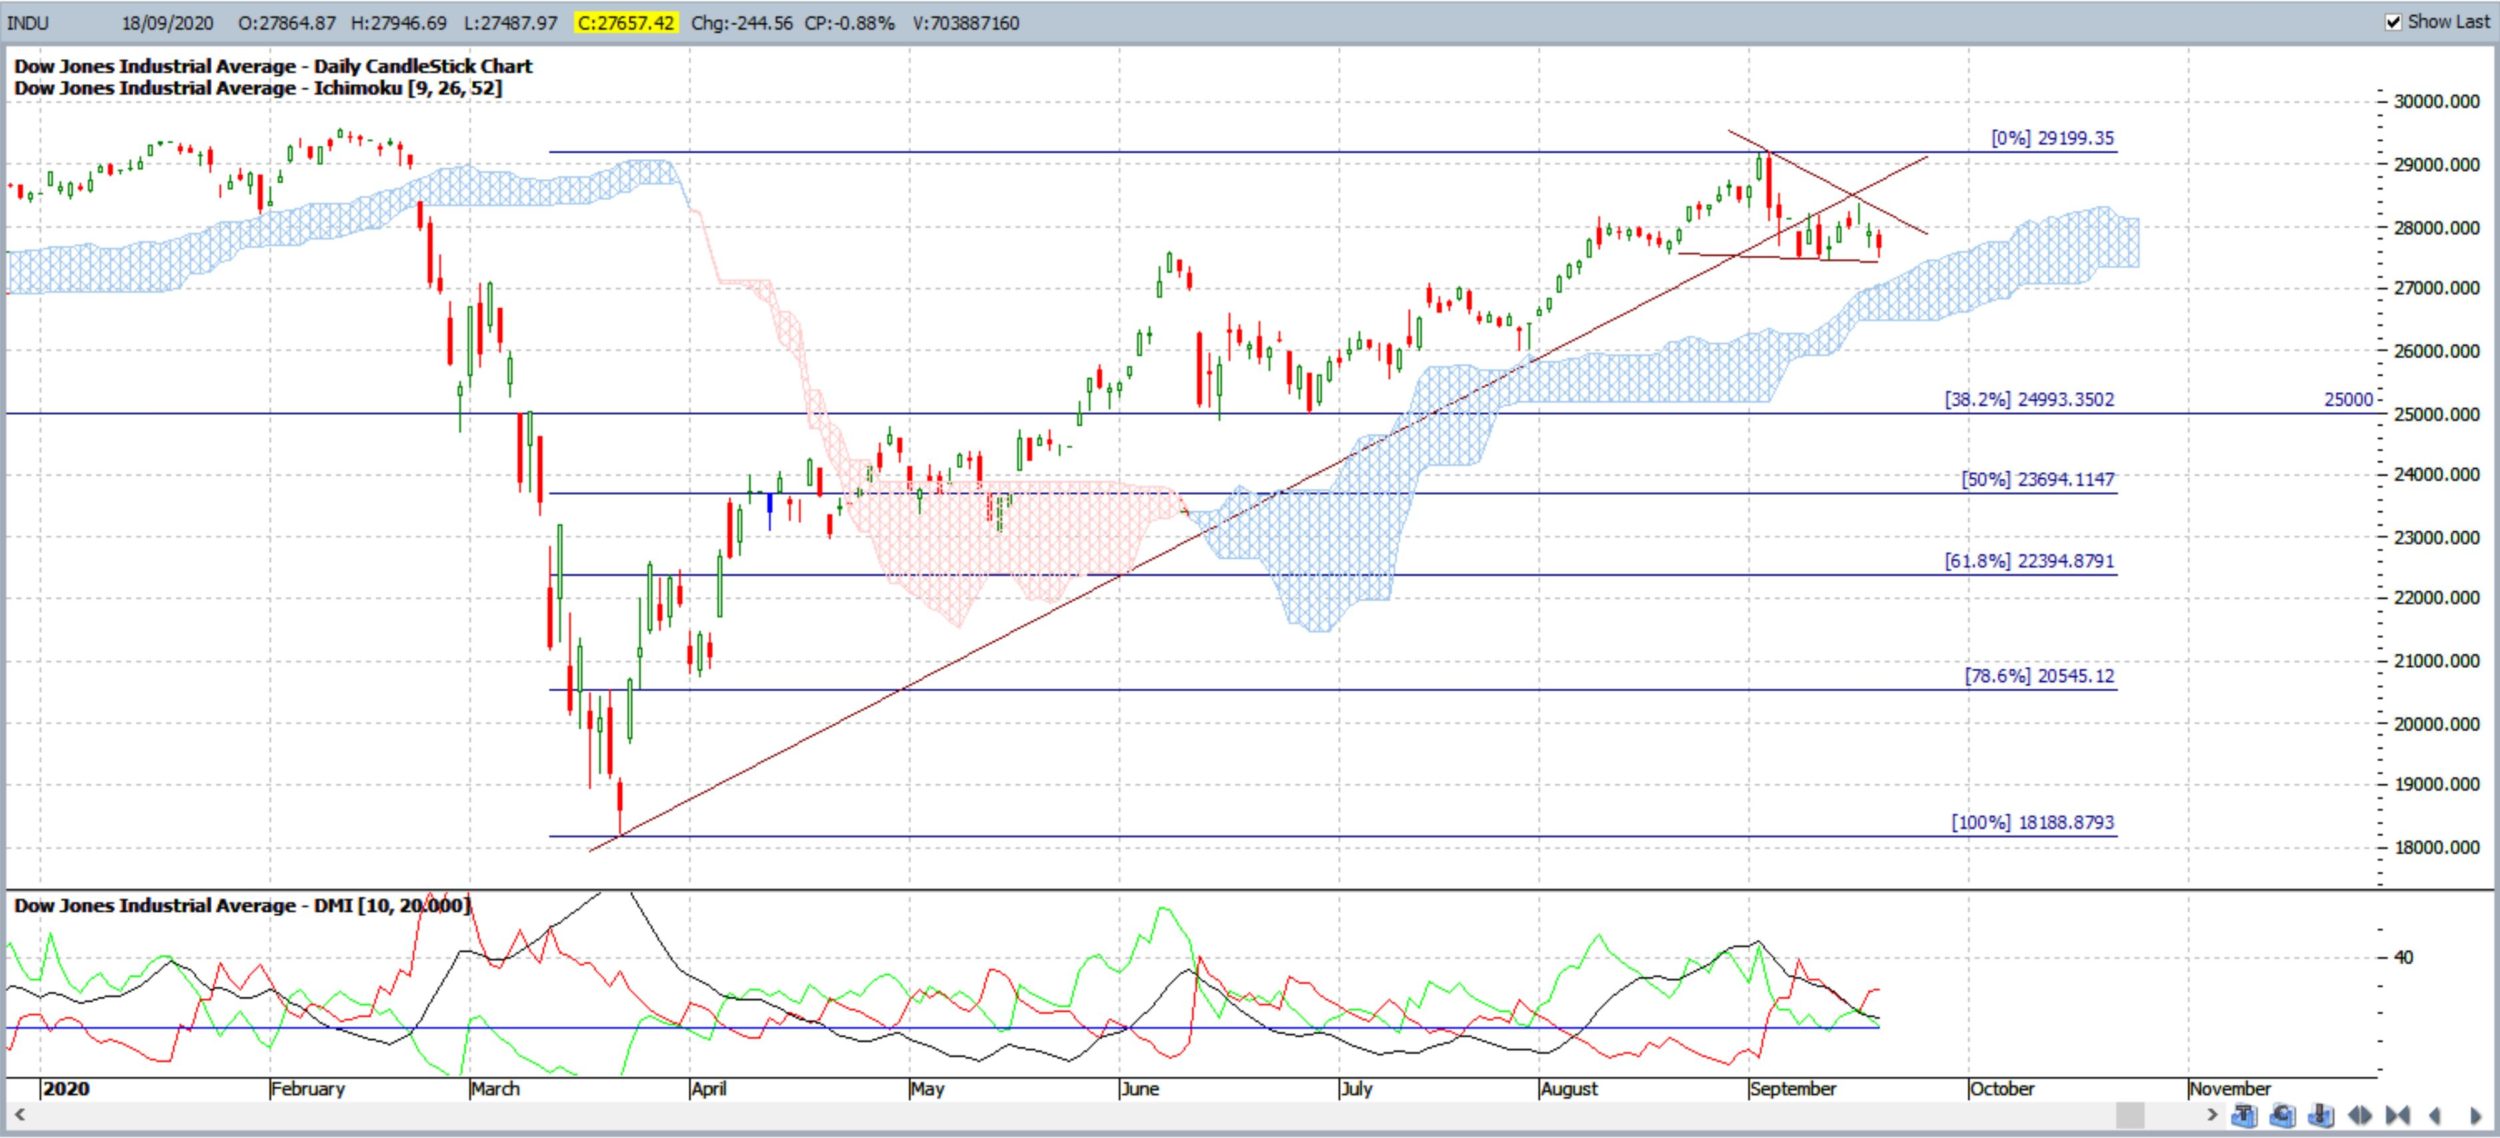
- DJIA: The DJIA closed with a bearish-coloured Spinning Top style weekly candle but with little bearish momentum so traders still need to watch for any Bull Flag activity.
DJIA weekly: watch for any Bull Flag:
DJIA daily: watch for any Cloud support:
-
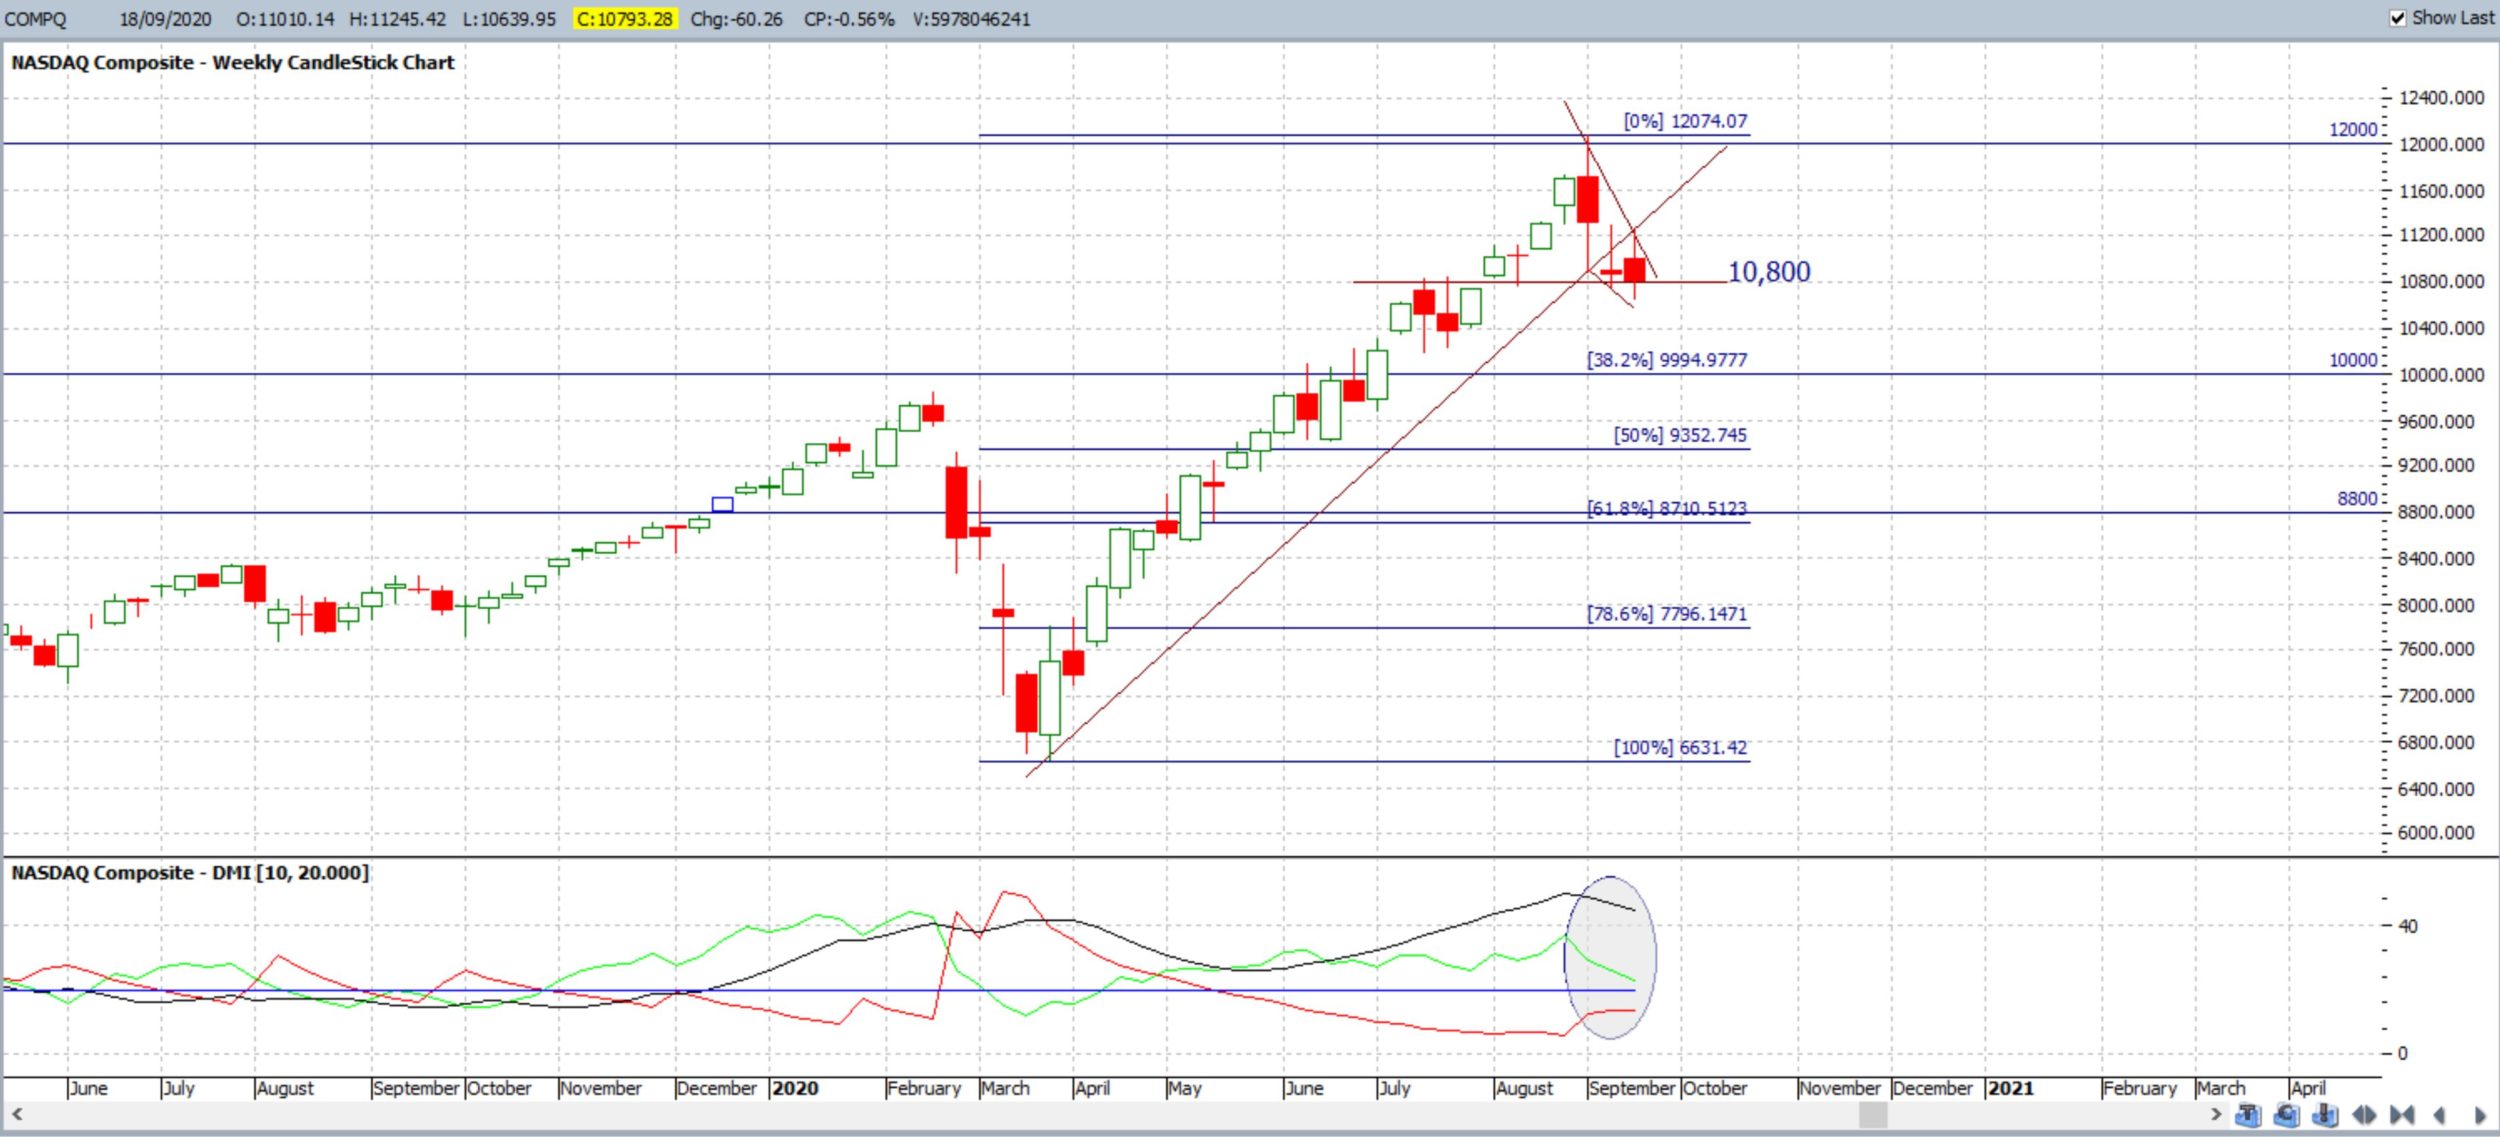
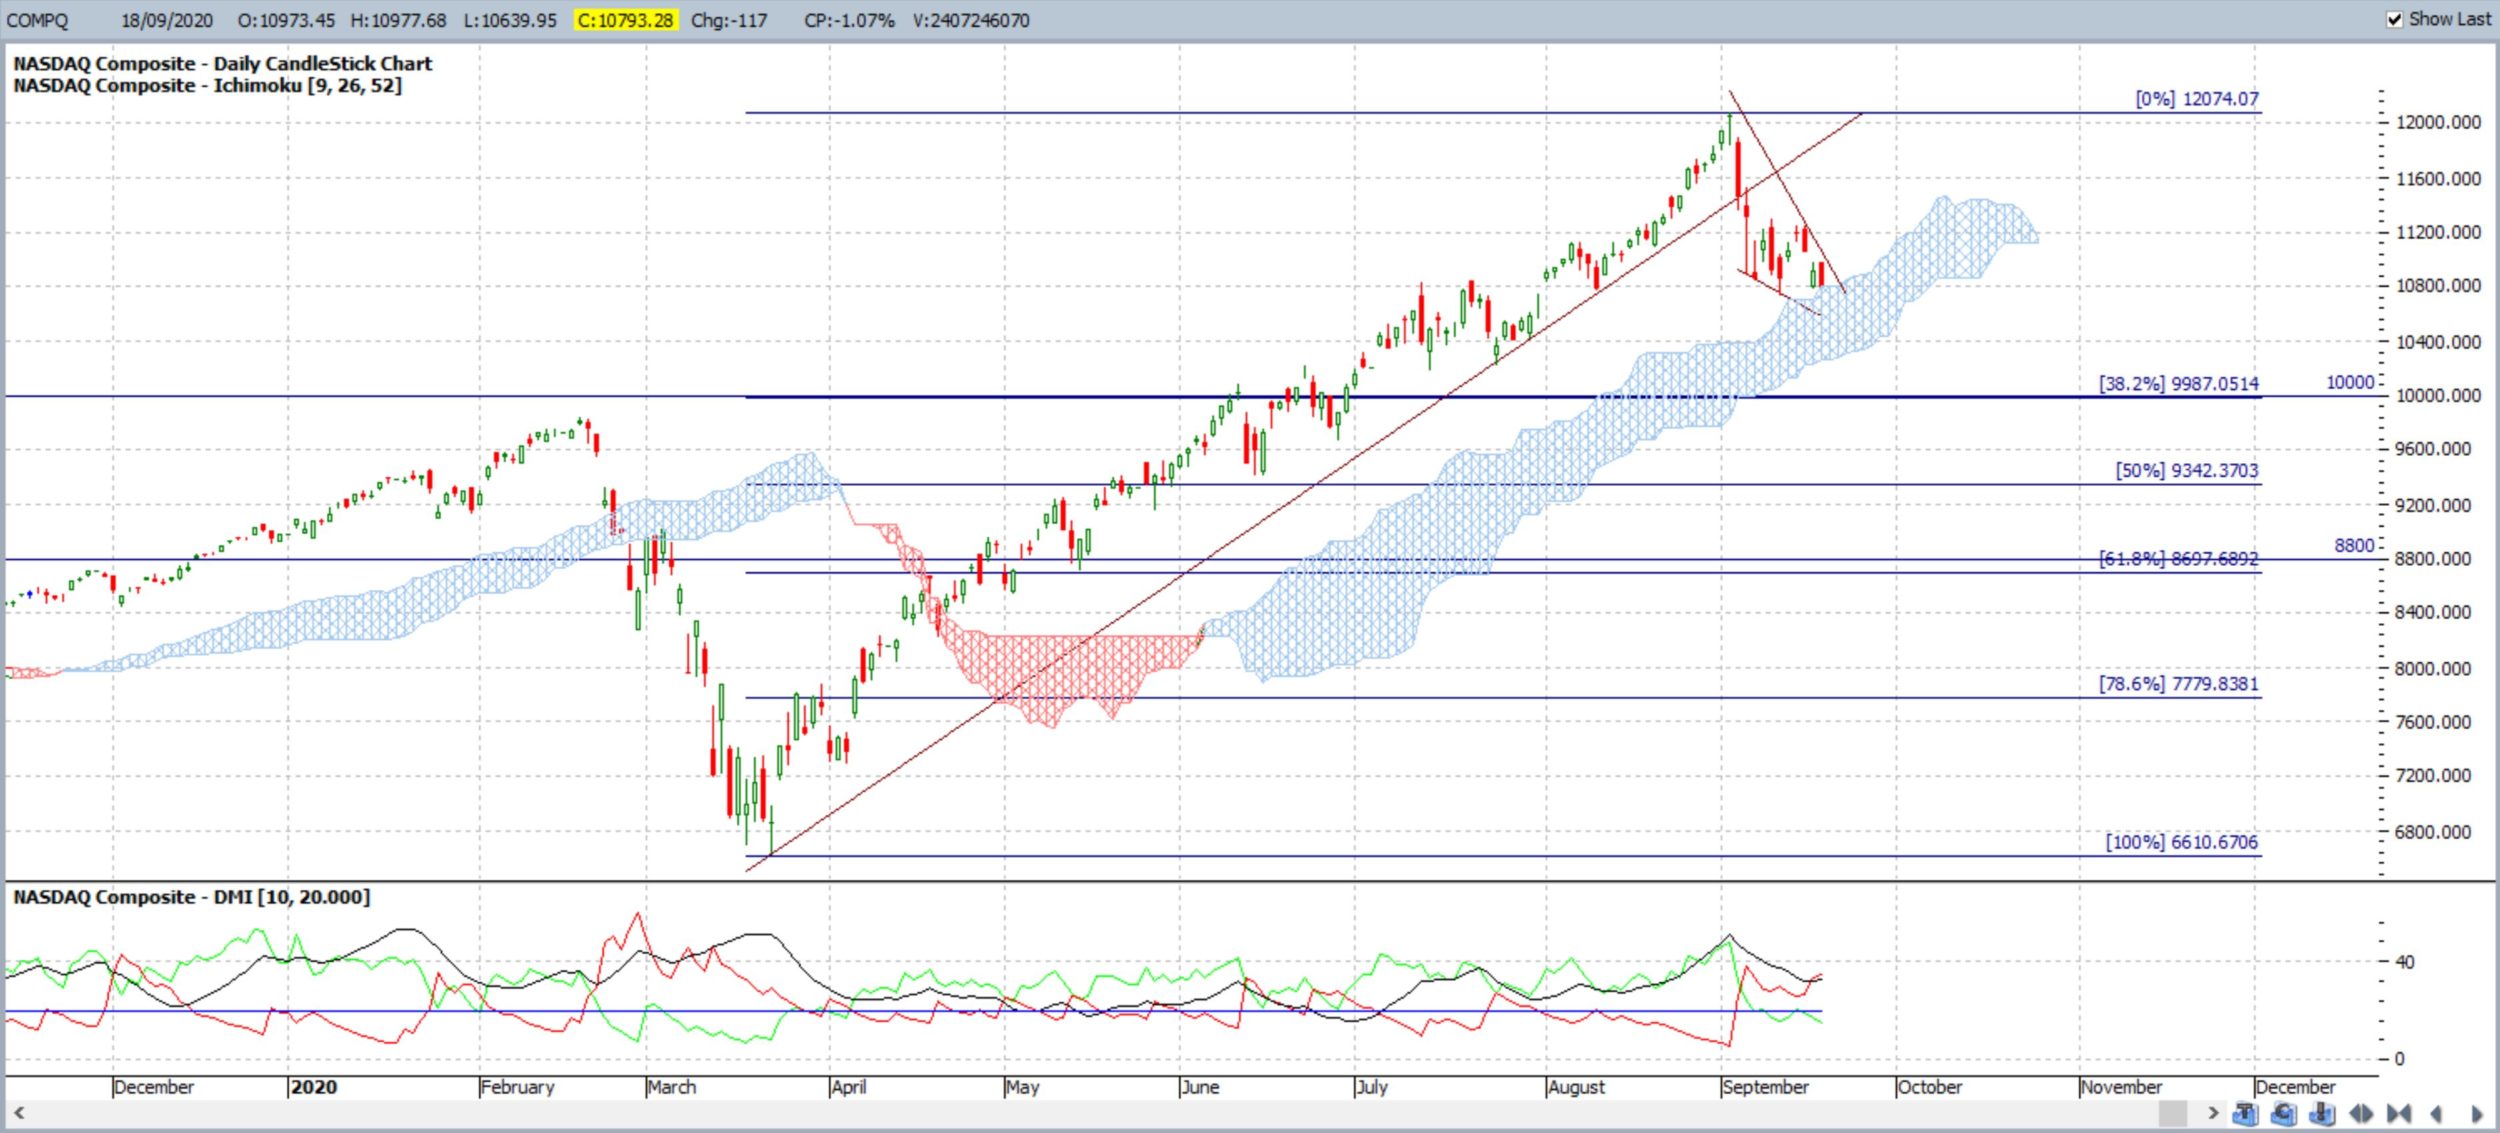
- NASDAQ composite: The NASDAQ Composite Index closed with a bearish-coloured Spinning Top weekly candle reflecting continued indecision. Price action could still be consolidating within a potential Bull Flag BUT I note the 10,800 level, that was Resistance in July and then Support in August and through the start of September, was broken this week. I still think the psychological 10,000 level may well be tested but any break below 10,000 would suggest, to me at least, that there could be more bearish activity and I’d then be looking down to the weekly 61.8% Fibonacci, near 8,800. Remember, technical theory would suggest that the 61.8% Fib level could be tested as part of the zig and zag of any overall bullish continuation move.
NASDAQ weekly: watch 10,800 S/R and for any potential Bull Flag activity:
NASDAQ daily: watch for any Cloud support:
-
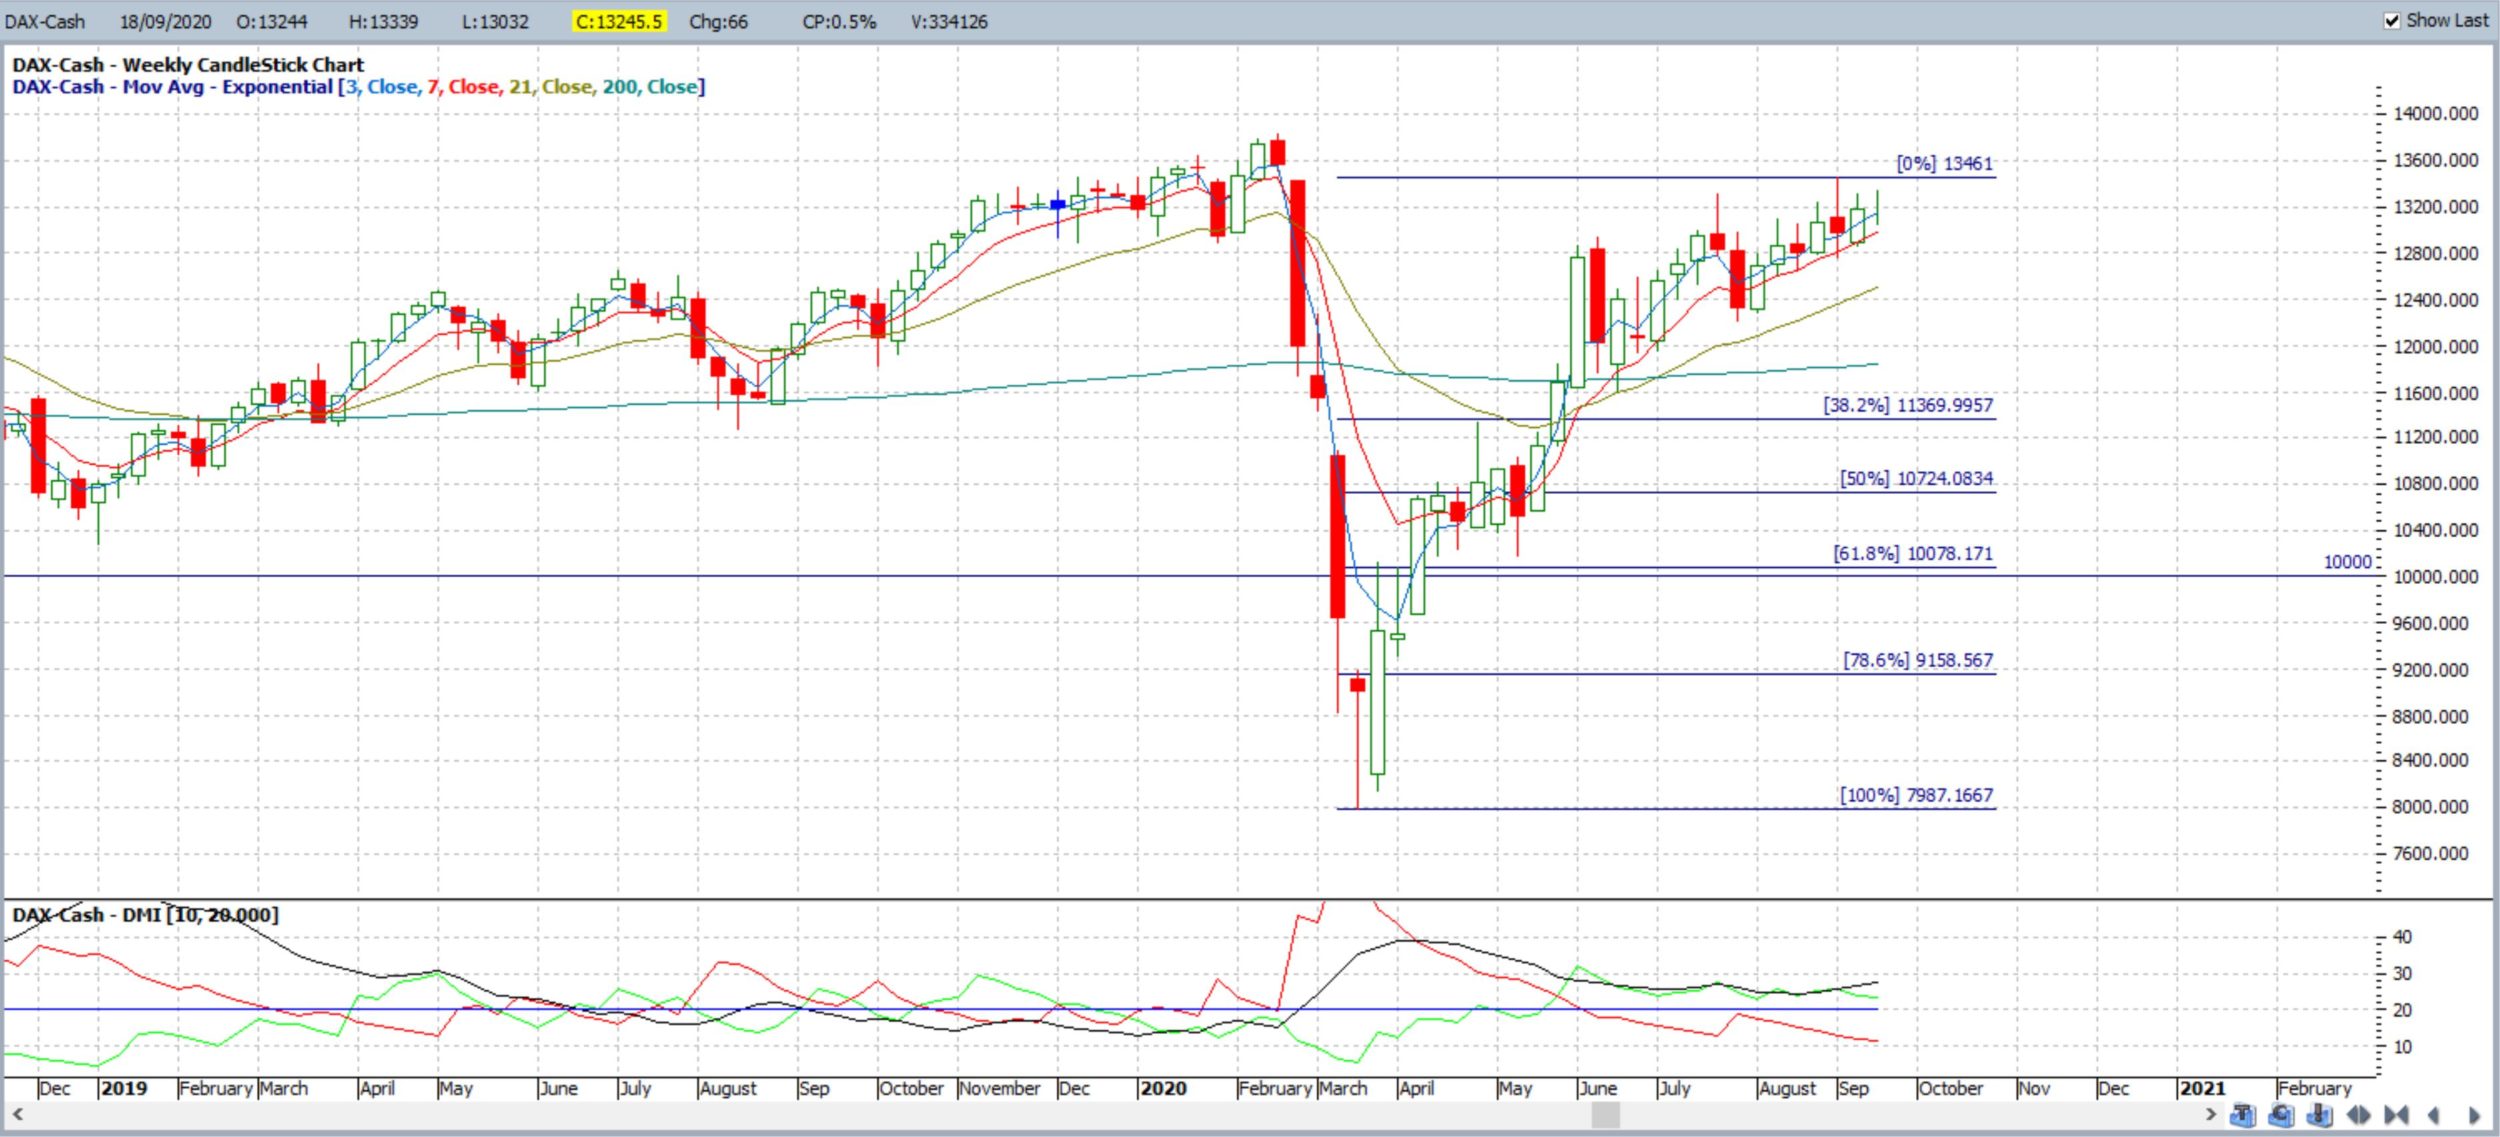
- DAX weekly: The DAX closed with a bullish-coloured Doji weekly candle BUT watch for any push to the previous all time High:
DAX weekly:
-
- Russell-2000: The Russell-2000 is often viewed as the ‘Canary in the Coal Mine’ for US stocks and closed with a bullish weekly candle. There has been a recent break of support trend line but, like with the other indices, traders should watch for any Bull Flag activity. The horizontal 1,460 level remains as one ‘line in the sand’ level to monitor:
RUT weekly: watch for any Bull Flag:

-
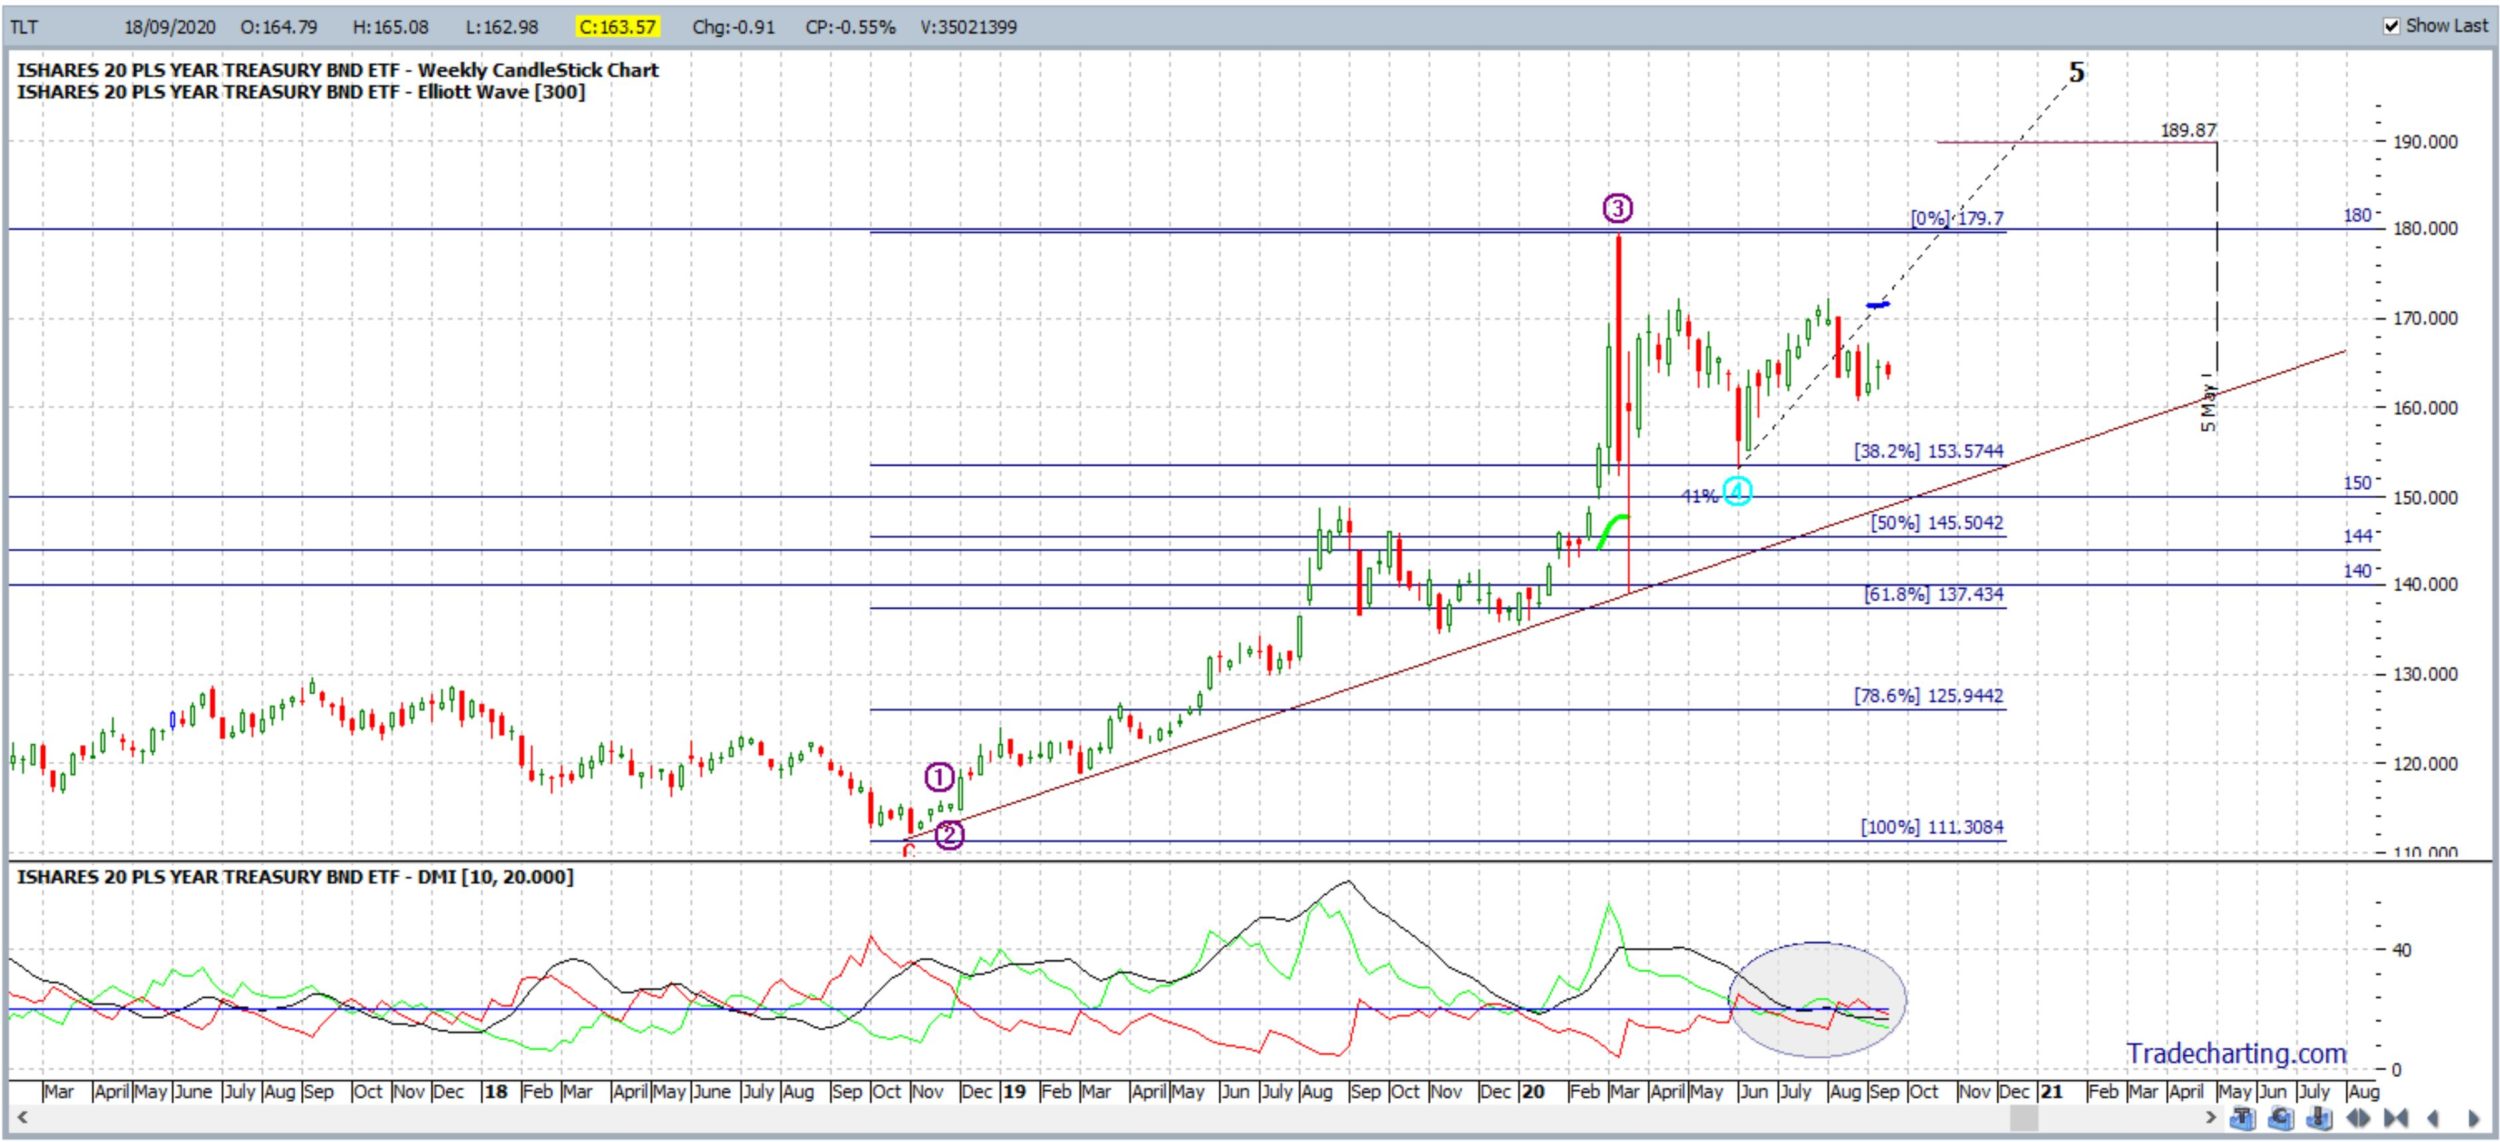
- Bonds / TLT: The Bond ETF, TLT, closed with a bearish-coloured Spinning Top weekly candle reflecting indecision; this is the third consecutive such indecision-style weekly candle. The Elliott Wave indicator is still suggesting an uptrend from here and any continued sell-off with stocks would likely underpin this Bond ETF:
TLT weekly:
-
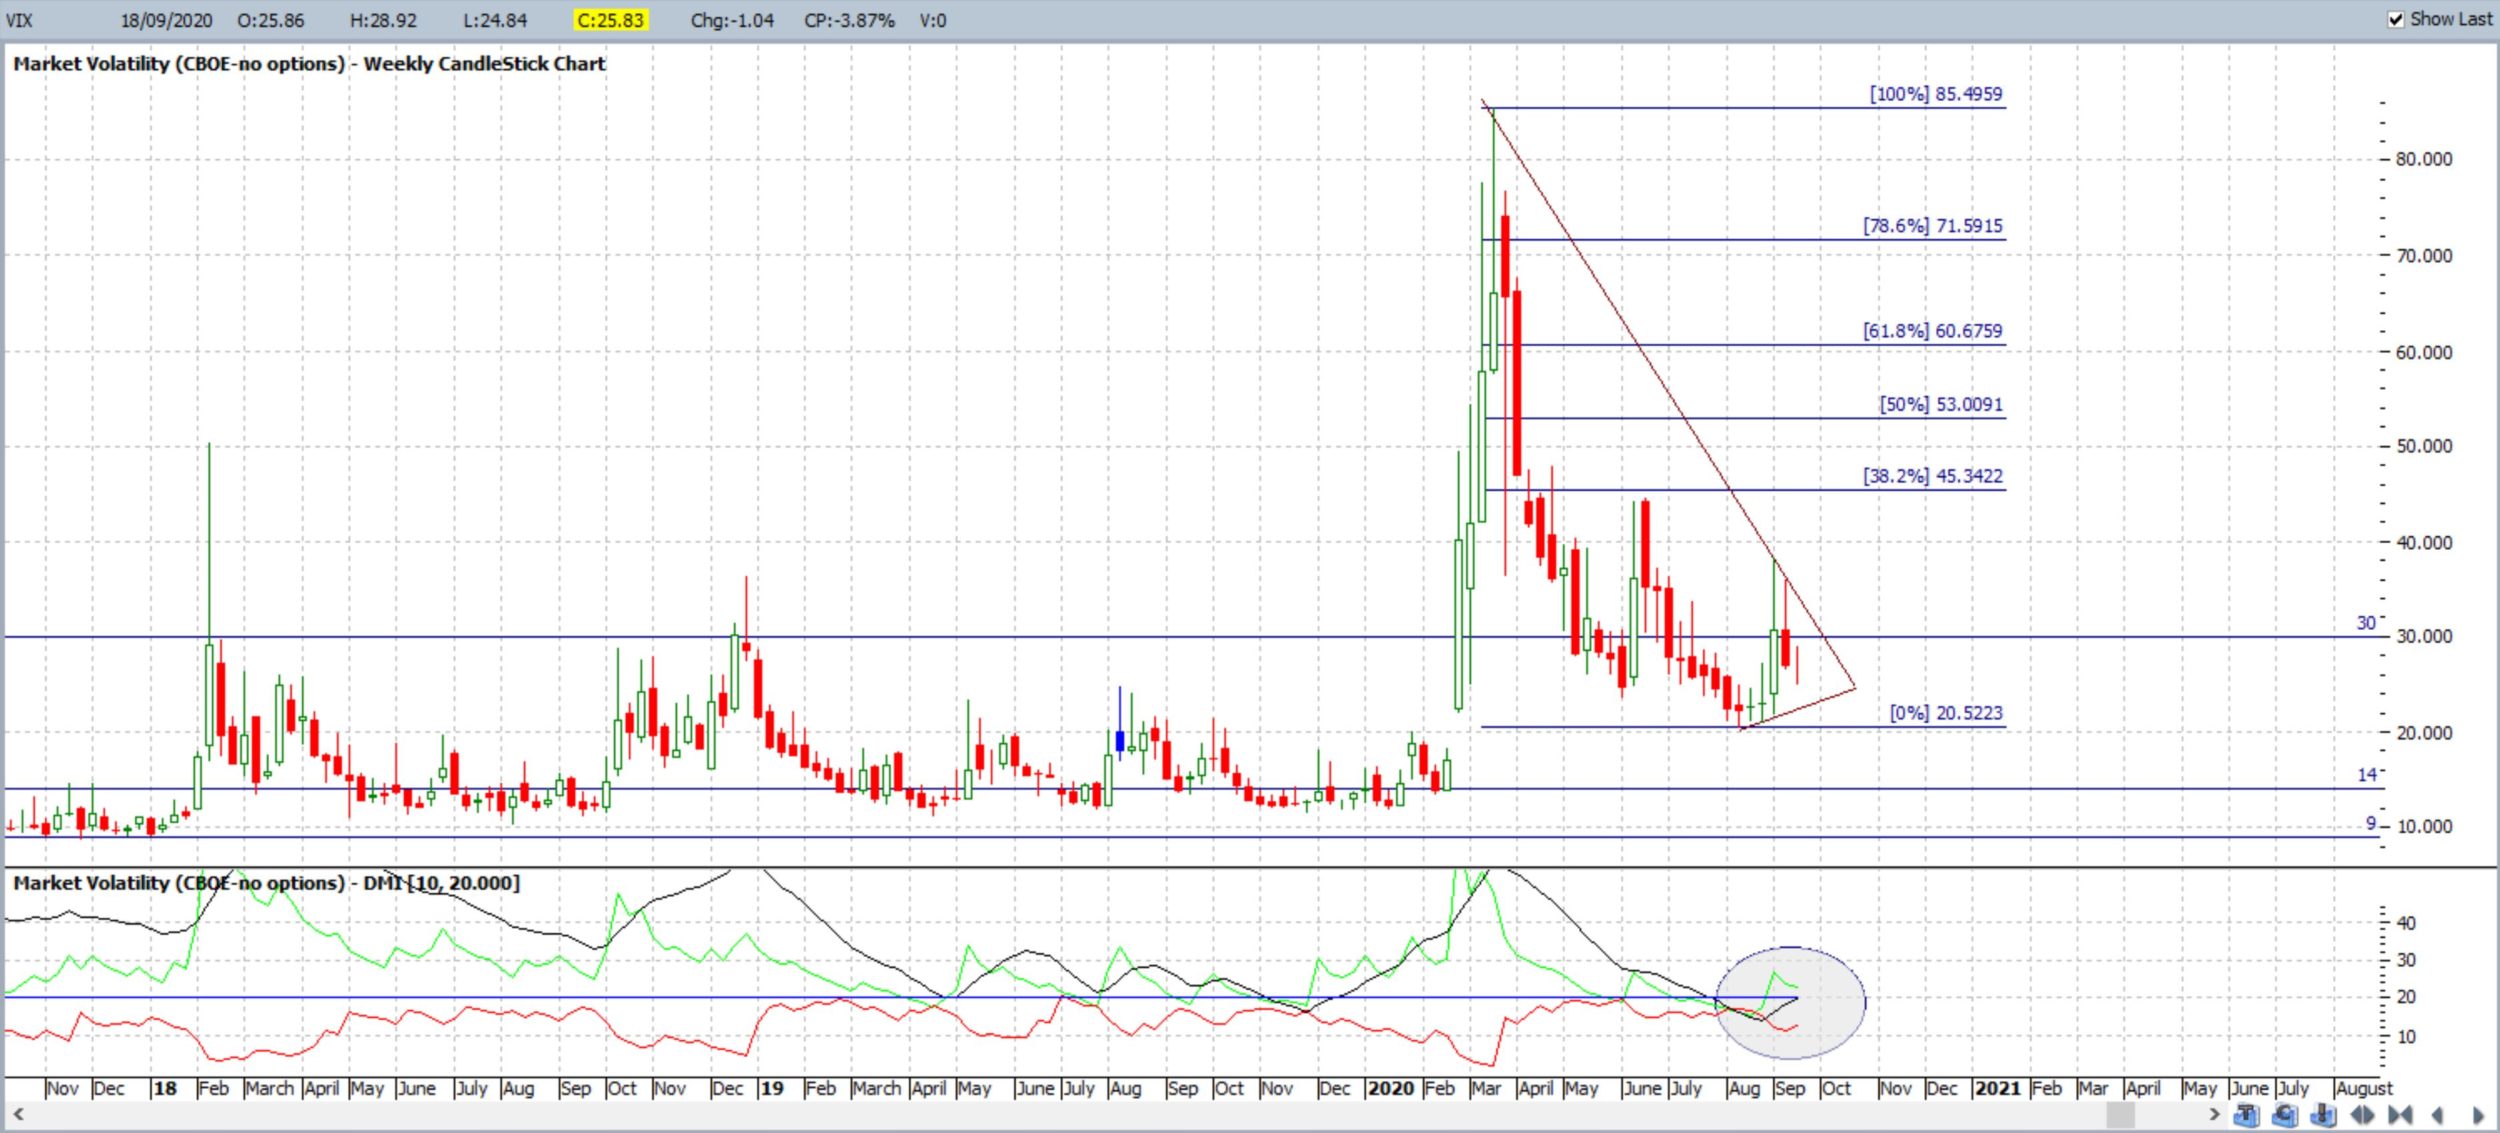
- VIX: the Fear index closed with a bearish-coloured Doji weekly candle reflecting indecision and remains below the key 30 level. Note the revised trend lines. Any sell off with stocks would likely help to underpin the index:
VIX weekly: watch the 30 level for any new make or break:
Calendar: Courtesy of Forex Factory:

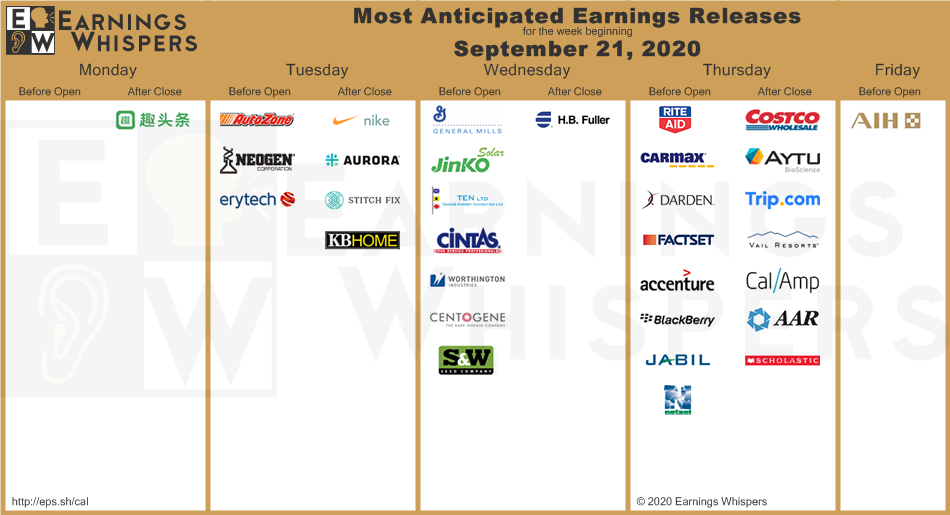
Earnings: Courtesy of Earnings Whispers: winding down:
Market Analysis:
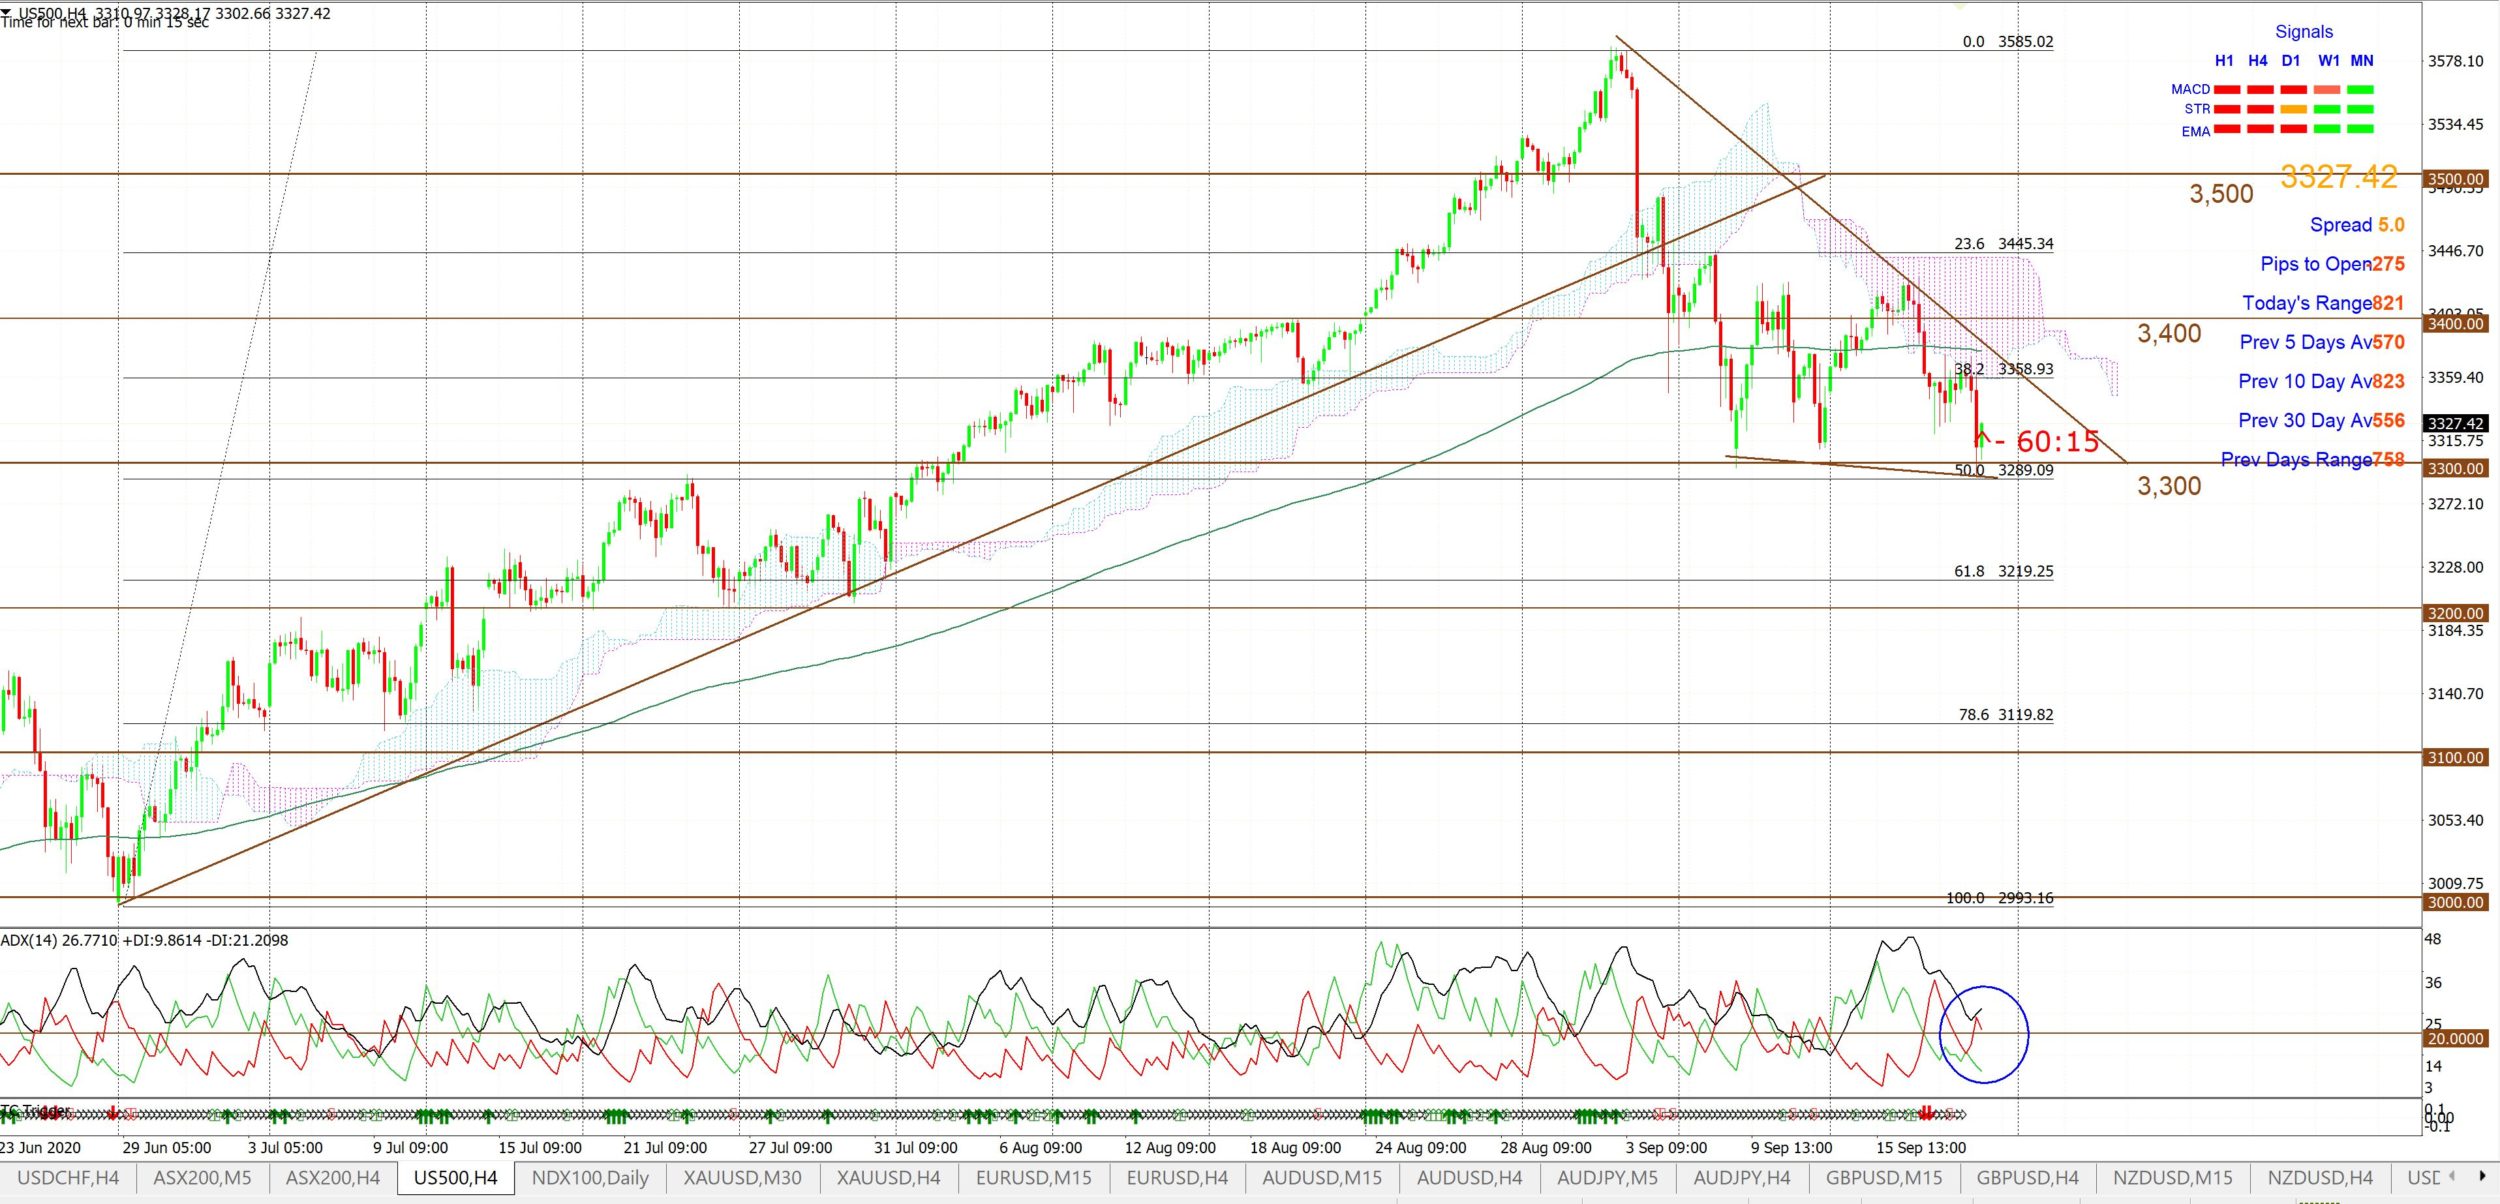
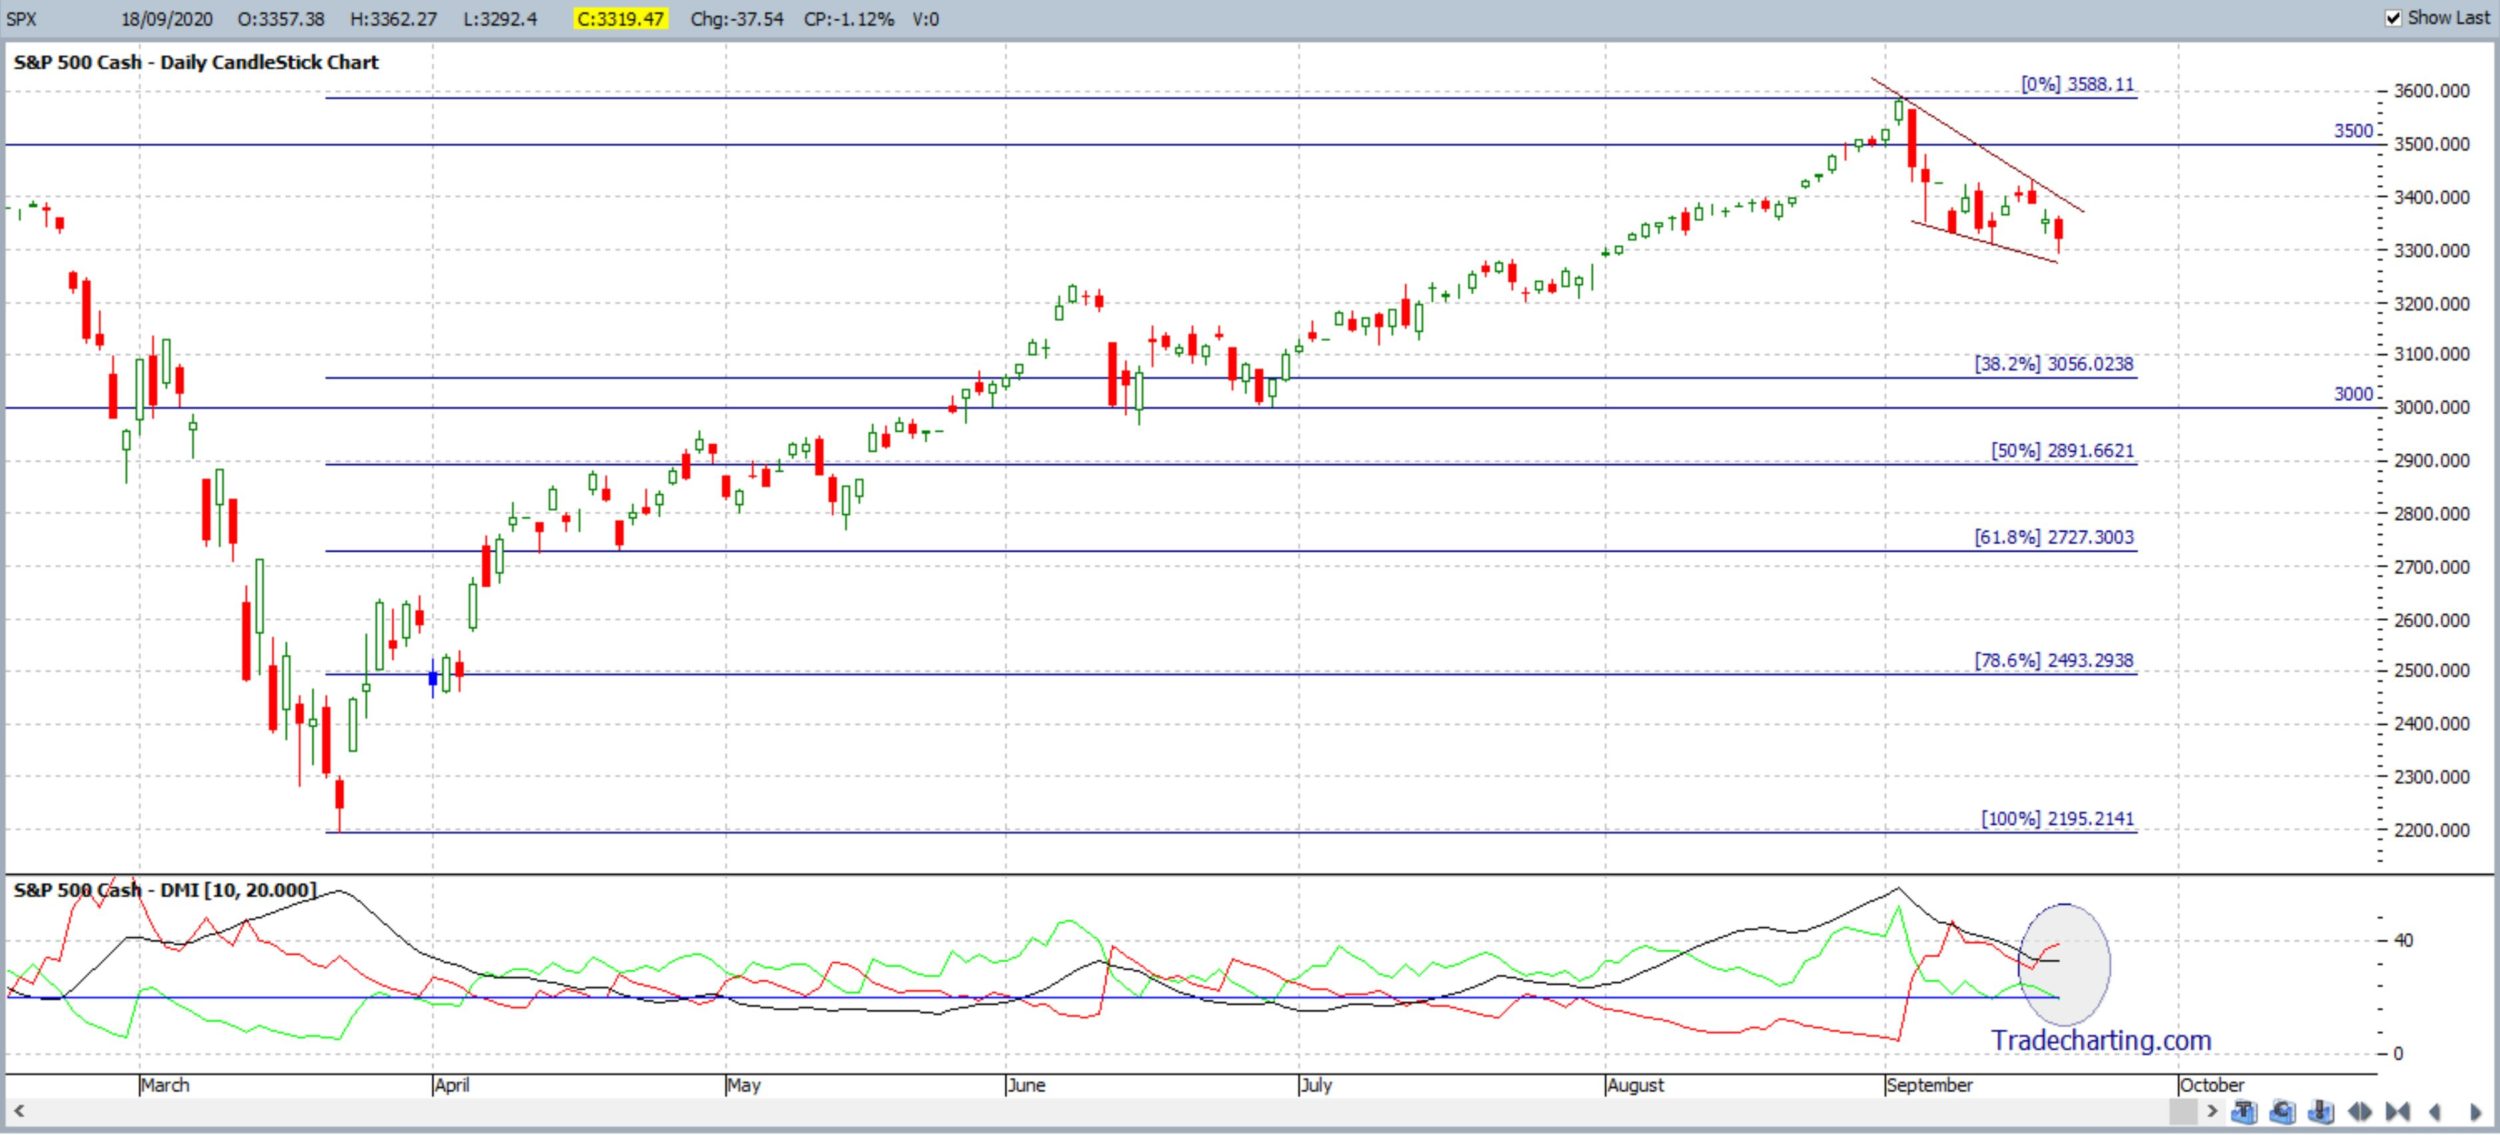
S&P500: The S&P500 index closed with another bearish-coloured Spinning Top weekly candle but continues to set up within a potential Bull Flag. Trading volume remains below the 200 SMA BUT I have re-drawn the bear trend line on Volume so as to better see any change here that might support any Bull Flag trend line breakout; either up or down:
S&P500 ETF: SPY weekly: Watch for any uptick with Volume that might help confirm a Bull Flag b/o:

Price action on the S&P500 is back near the whole-number 3,300 this week so this remains the first support level to monitor for any new make or break. There are revised 4hr chart Bull Flag trend lines to monitor as well.
As noted recently: The weekly S&P500 chart below shows that the 61.8% Fibonacci level of this recent swing-High move (March 2020- September 2020) is down near the 2,700 region. Technical analysts would suggest that a pullback to this 61.8% level would be in order; even if there is to be ultimate bullish continuation. Trends do not travel in straight lines unabated so traders should be aware of this zig-zag potential.
Bullish targets: any bullish 4hr chart bounce up from 3,300 would bring the 4hr chart’s bear trend line followed by 3,400 & 3,500 S/R into focus.
Bearish targets: any bearish 4hr chart break below 3,300 would bring the 3,200 level into focus as this is near the 4hr chart’s 61.8% Fibonacci level. Beyond that, the weekly chart’s 61.8% Fibonacci, down near 2,700, would come into focus.
- Watch the 4hr chart’s Bull Flag trend lines and 3,300 for any new make or break:

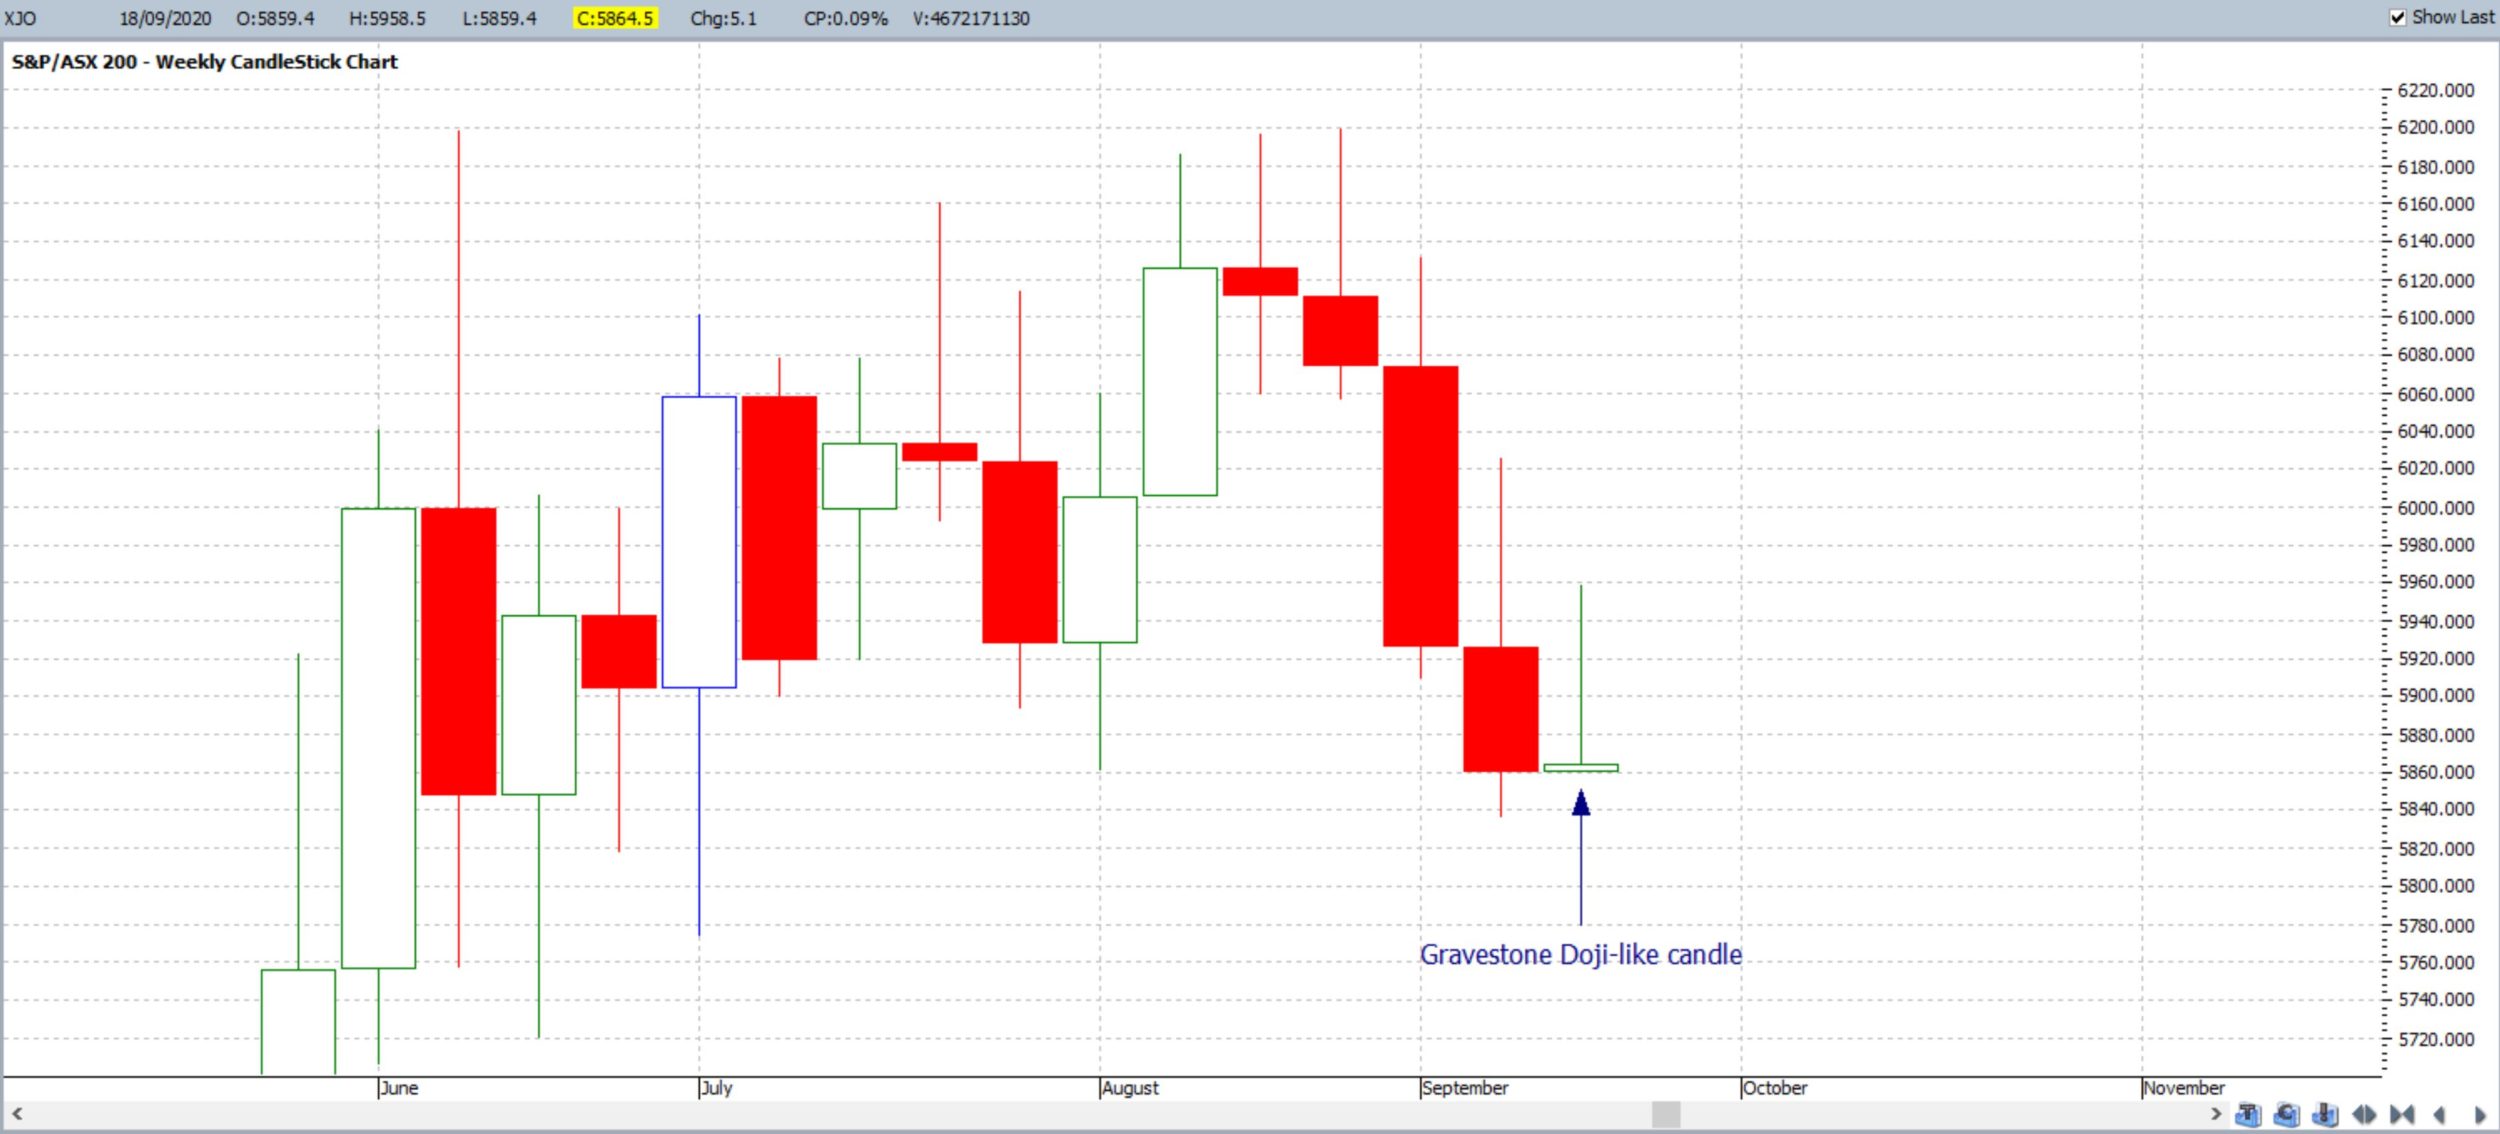
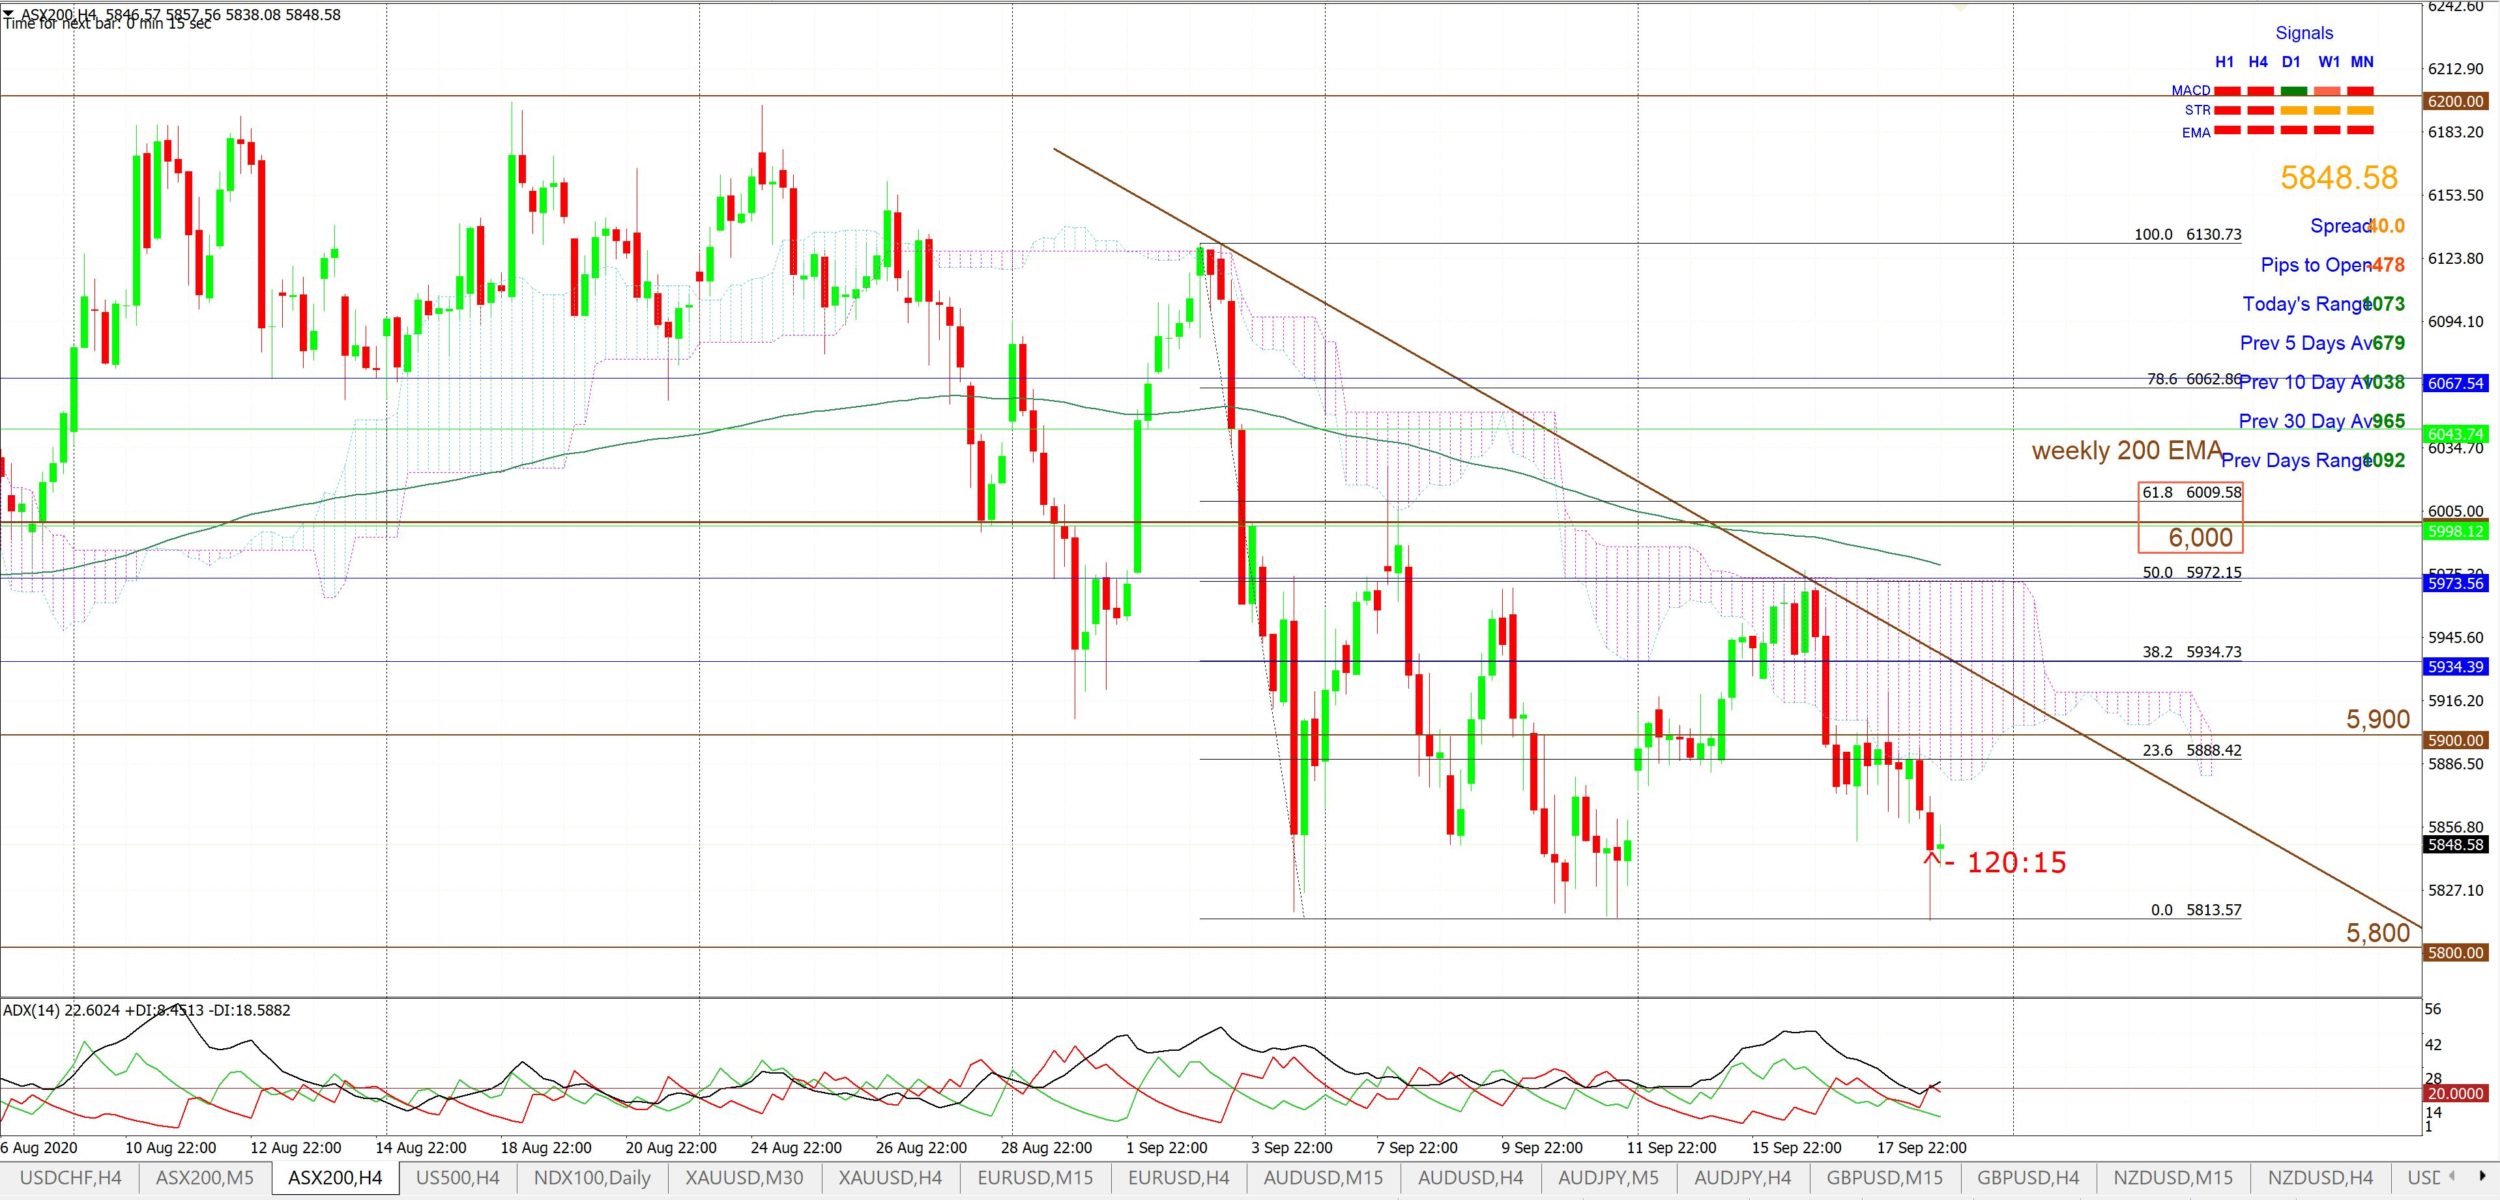
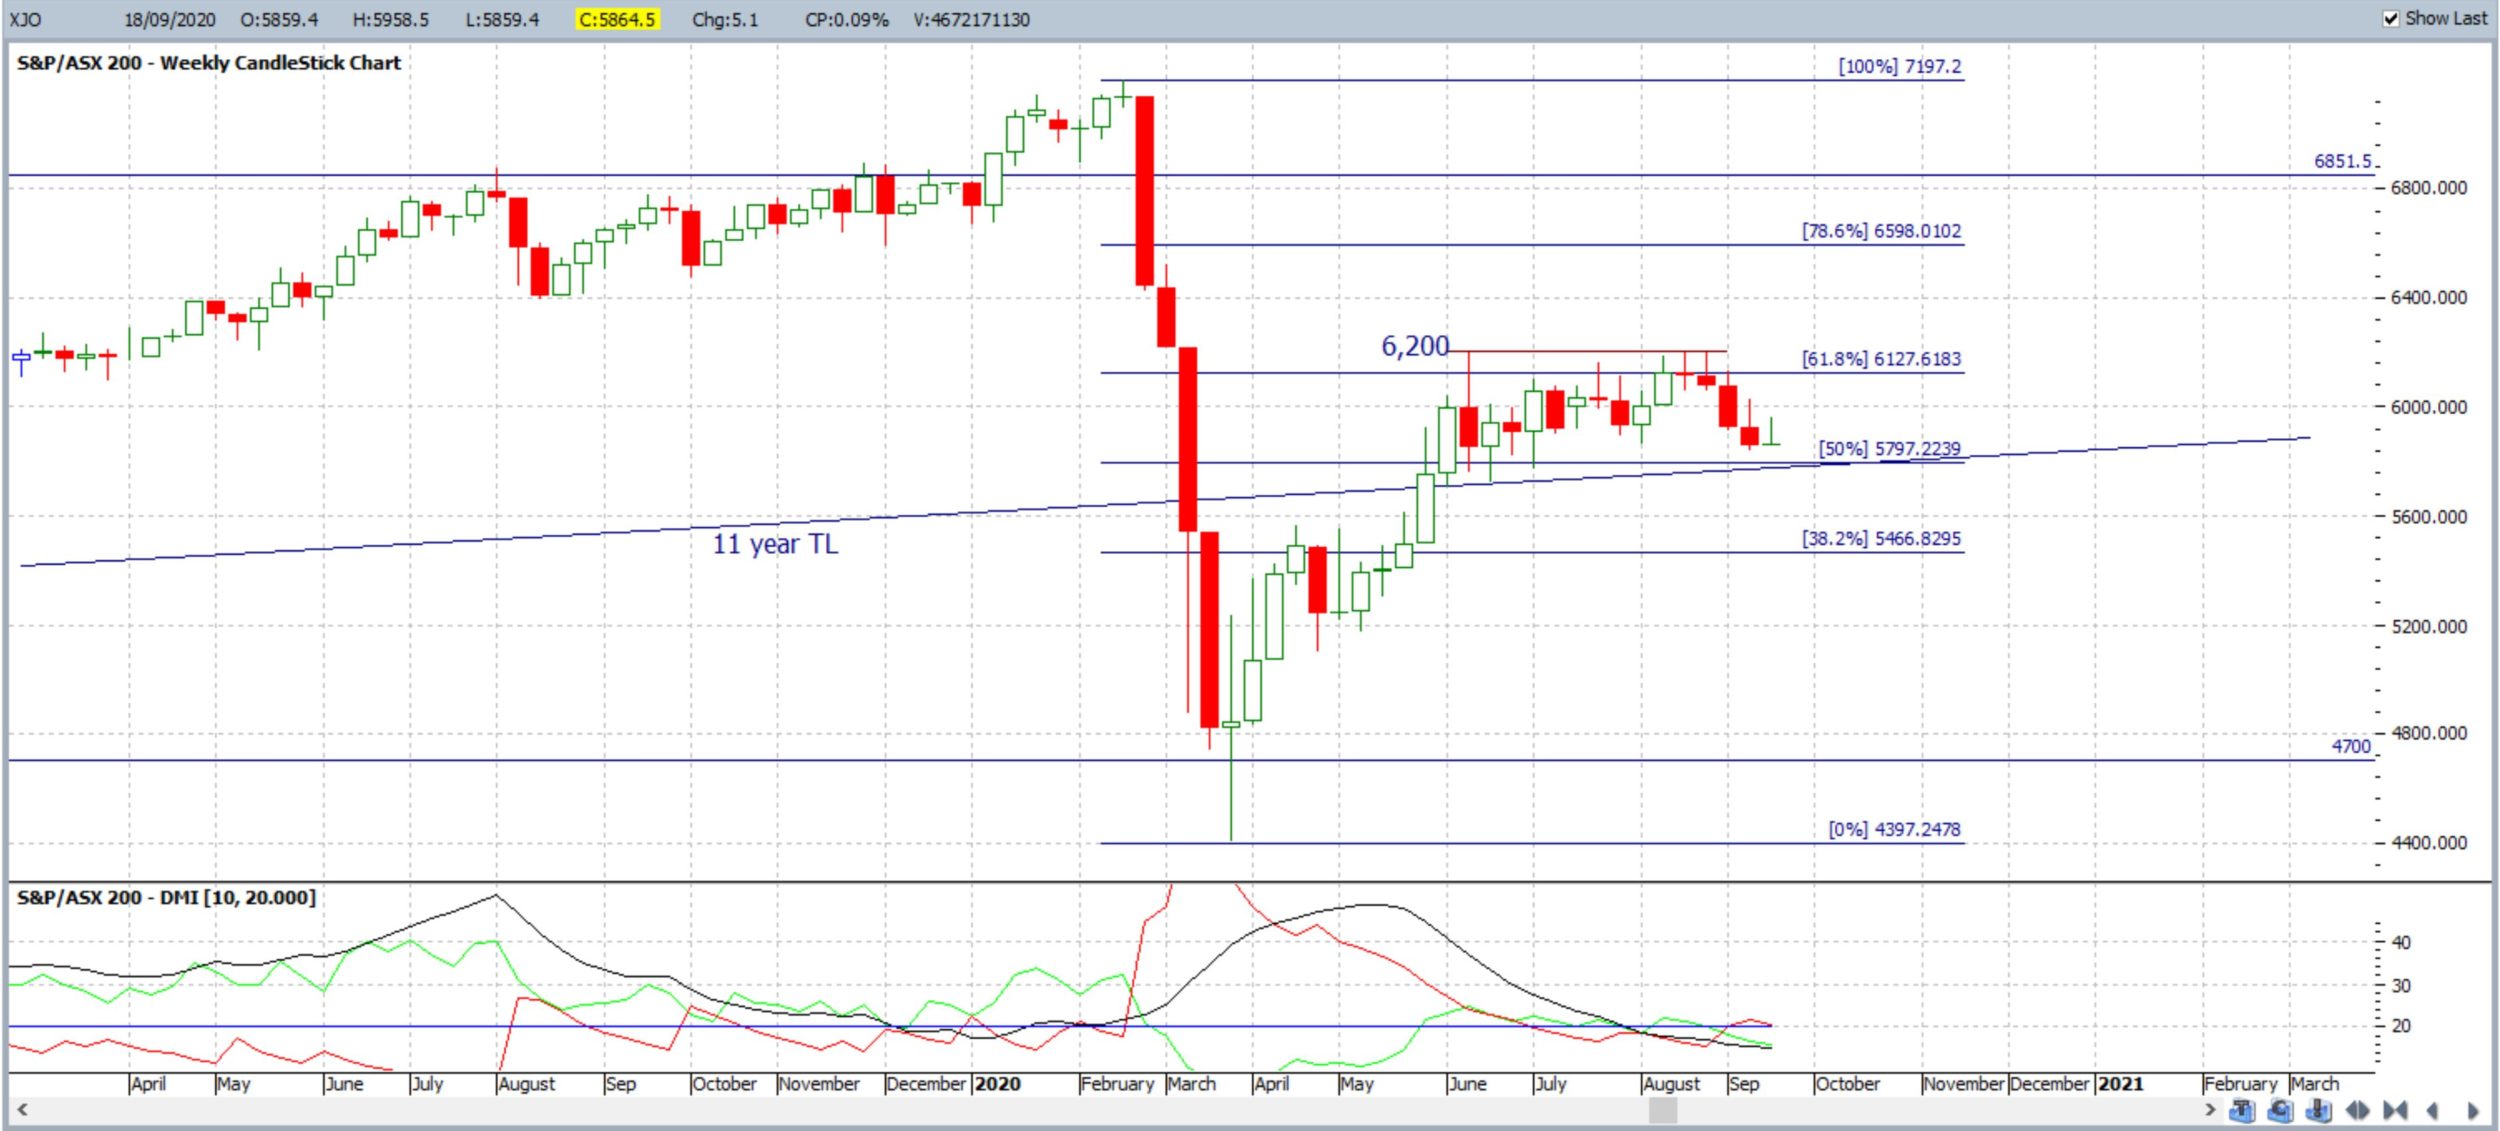
ASX-200: XJO: The ASX-200 closed with a bullish-coloured Gravestone Doji-like weekly candle and still below the psychological 6,000 level. These types of candle reflect the potential for bullish-reversal when they print after a downtrend so ASX traders need to keep an open mind here!
XJO weekly: note the unusual weekly candle; a bit Gravestone Doji like:
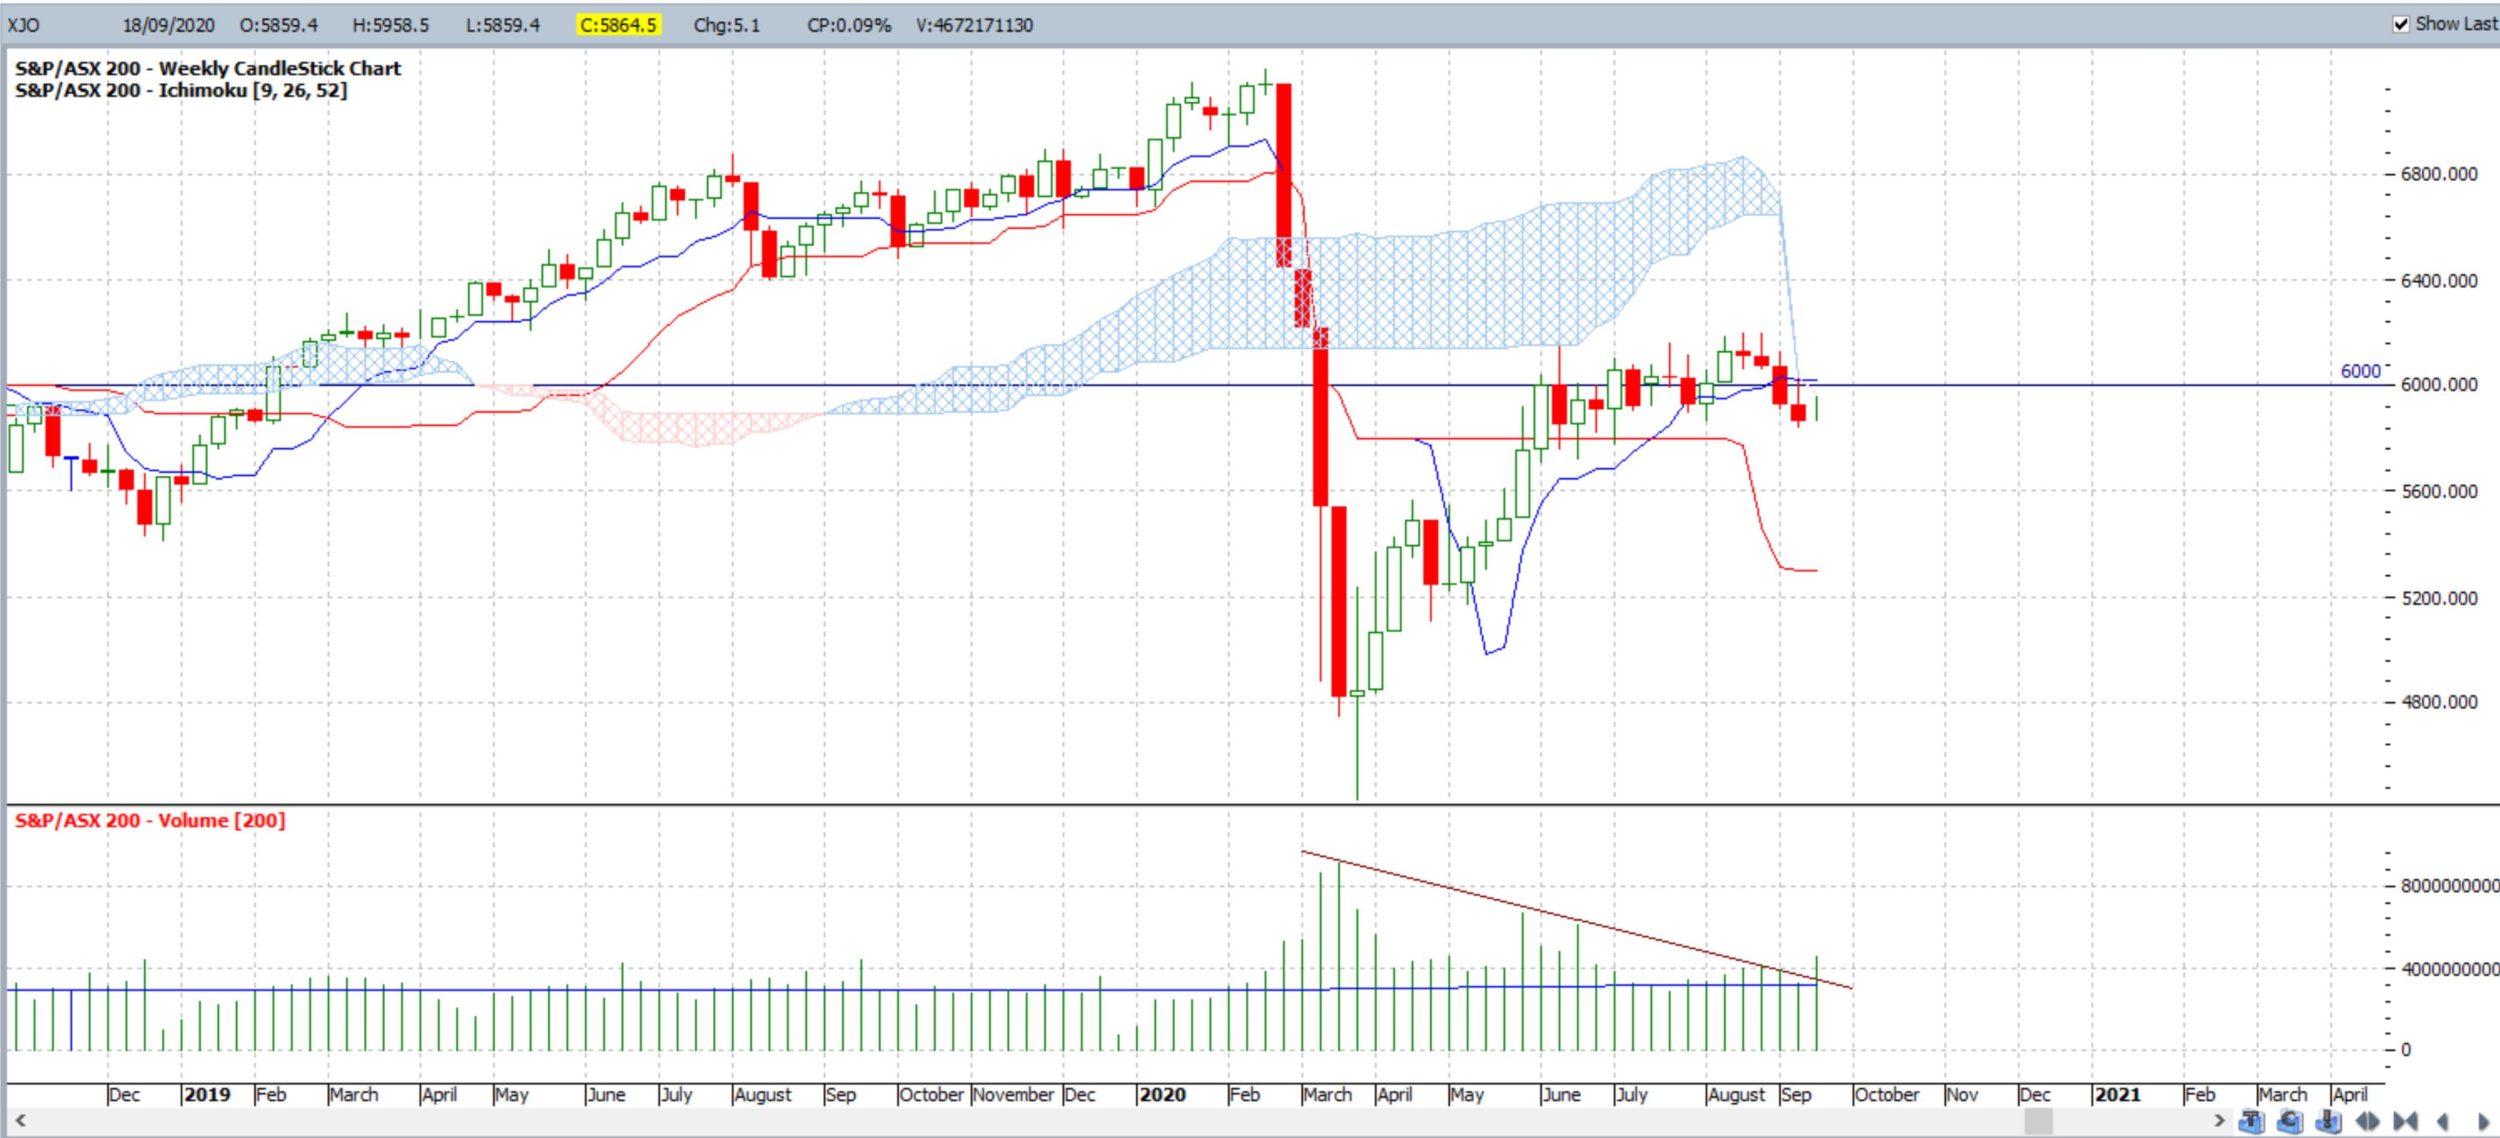
Another bullish signal was the uptick with trading Volume on the print of this bullish weekly candle:
XJO weekly: note the bullish trend line breakout with trading volume:
There was a print of better than expected Employment data for Australia last week but larger pressures, mentioned last week, still remain. That being deteriorating Australia-China relations and Covid-related border closures: Australia’s external border remains closed and there ongoing arguments surrounding the closure of many internal borders.
The index closed near 5,850 again so 5,900 remains as the whole-number level resistance above current price and 5,800 is whole-number support below to watch for any new make or break. There are also new 4hr chart trend lines to monitor for any new momentum breakout.
Bullish targets: Any bullish 4hr chart trend line breakout above 5,900 would bring 6,000 into focus as this is still near the 61.8% fib of the recent swing Low move and also near the 4hr chart’s 200 EMA. After that, watch the recent High, near 6,200, and, after that, whole number levels on the way back to the previous all time High, circa 7,200.
Bearish targets: Any bearish 4hr chart trend line breakout below 5,800 would bring the previously broken 11-yr trend line back into focus along with 5,700 S/R.
- Watch for any new 4hr chart trend line breakout:
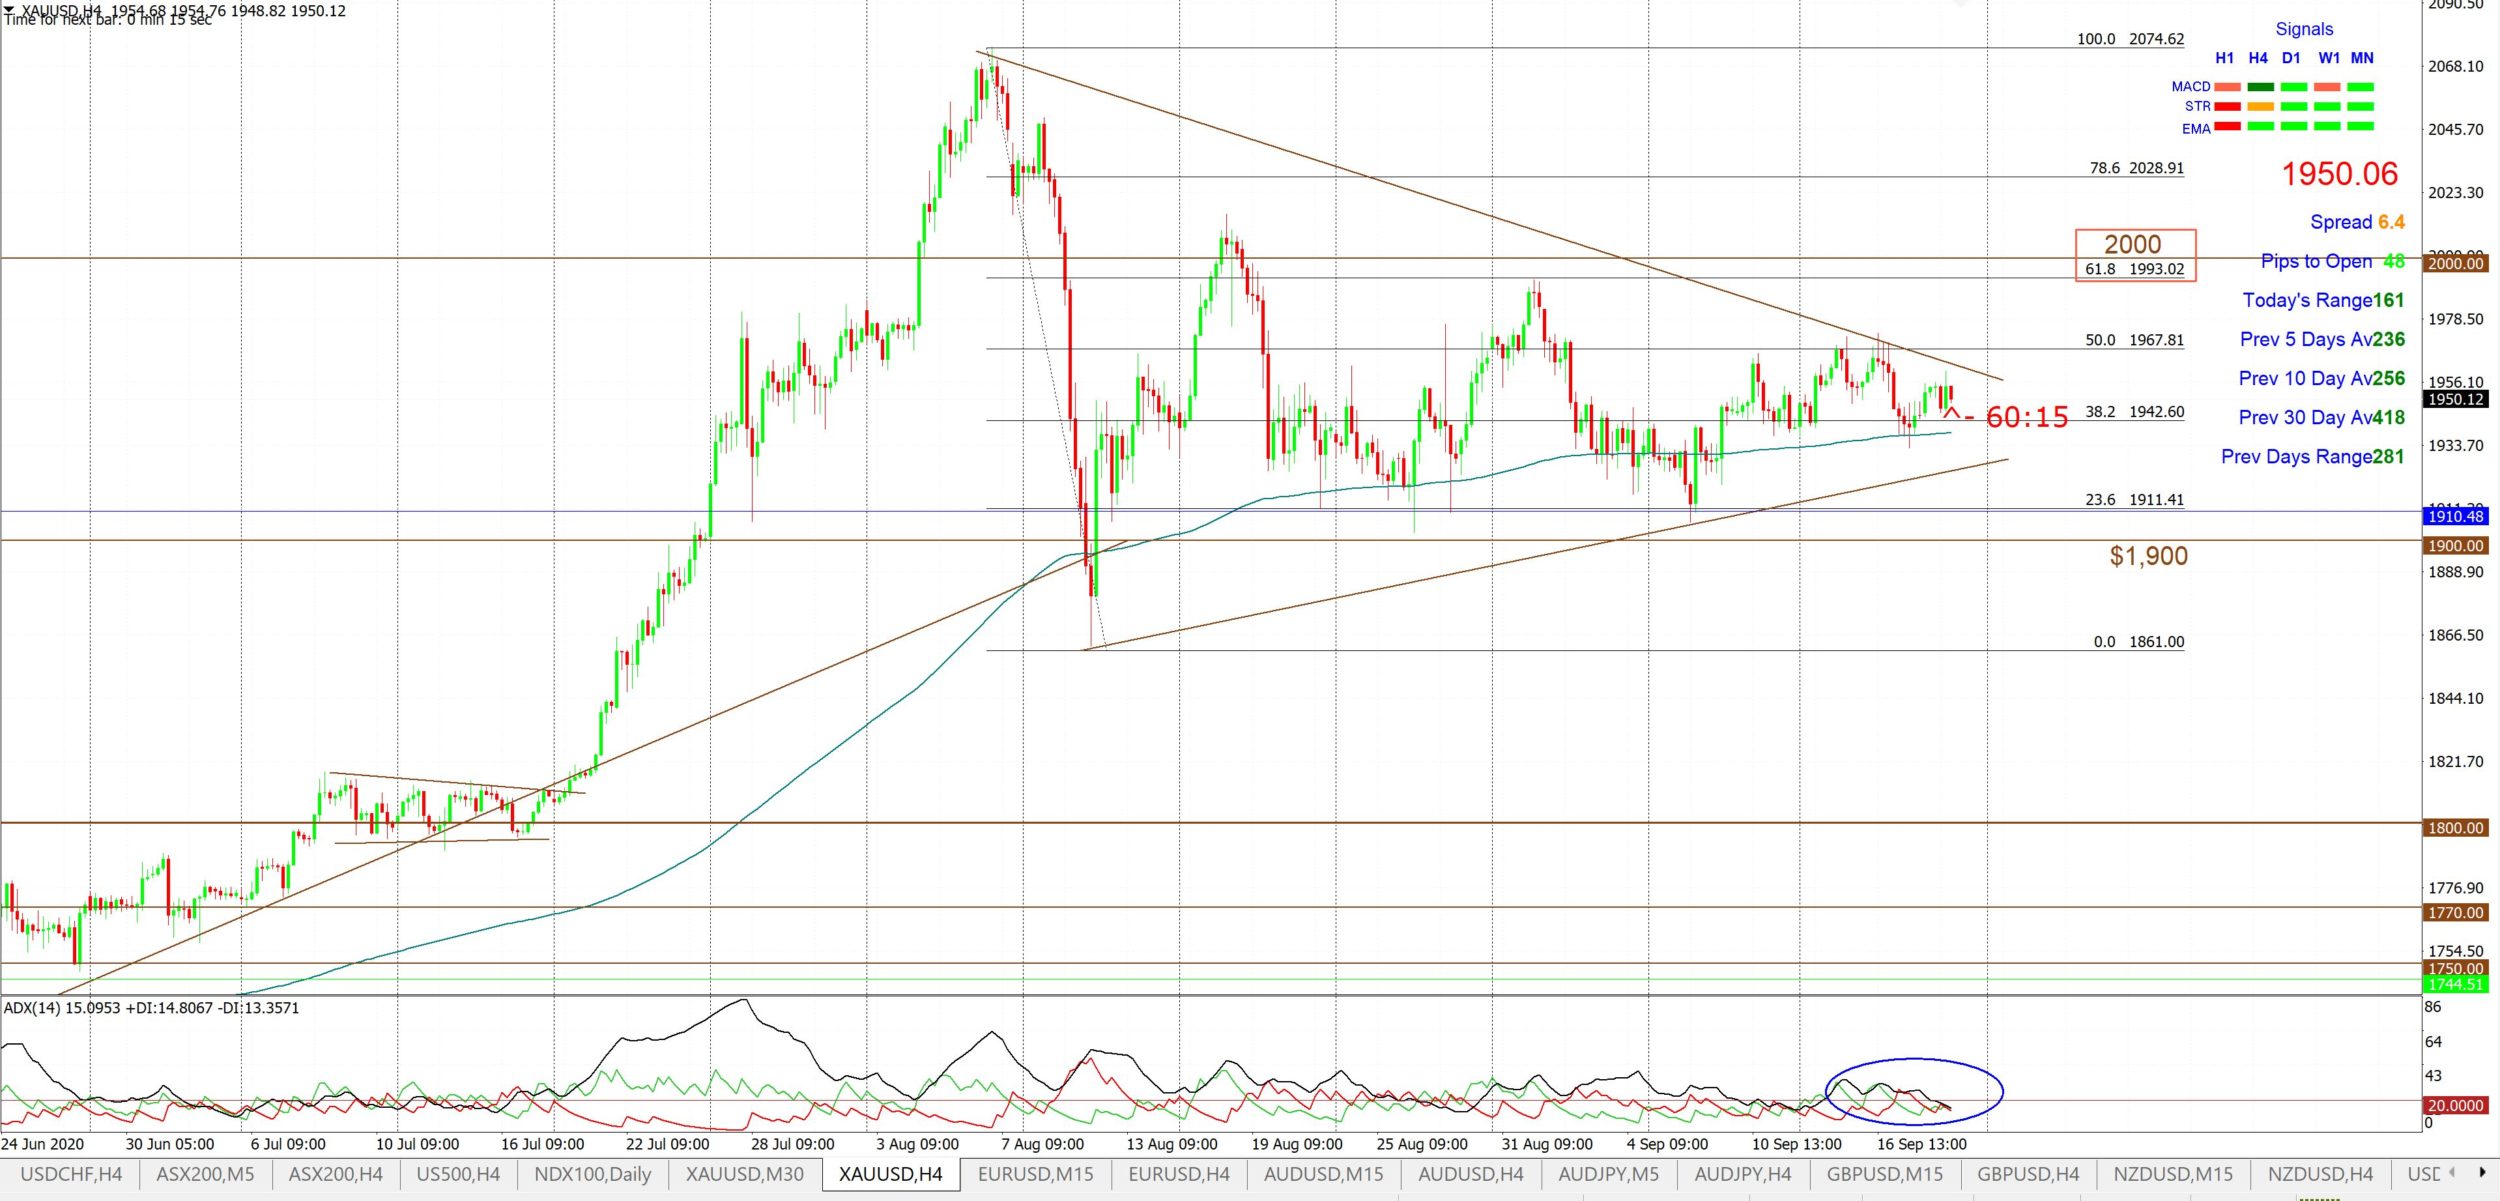
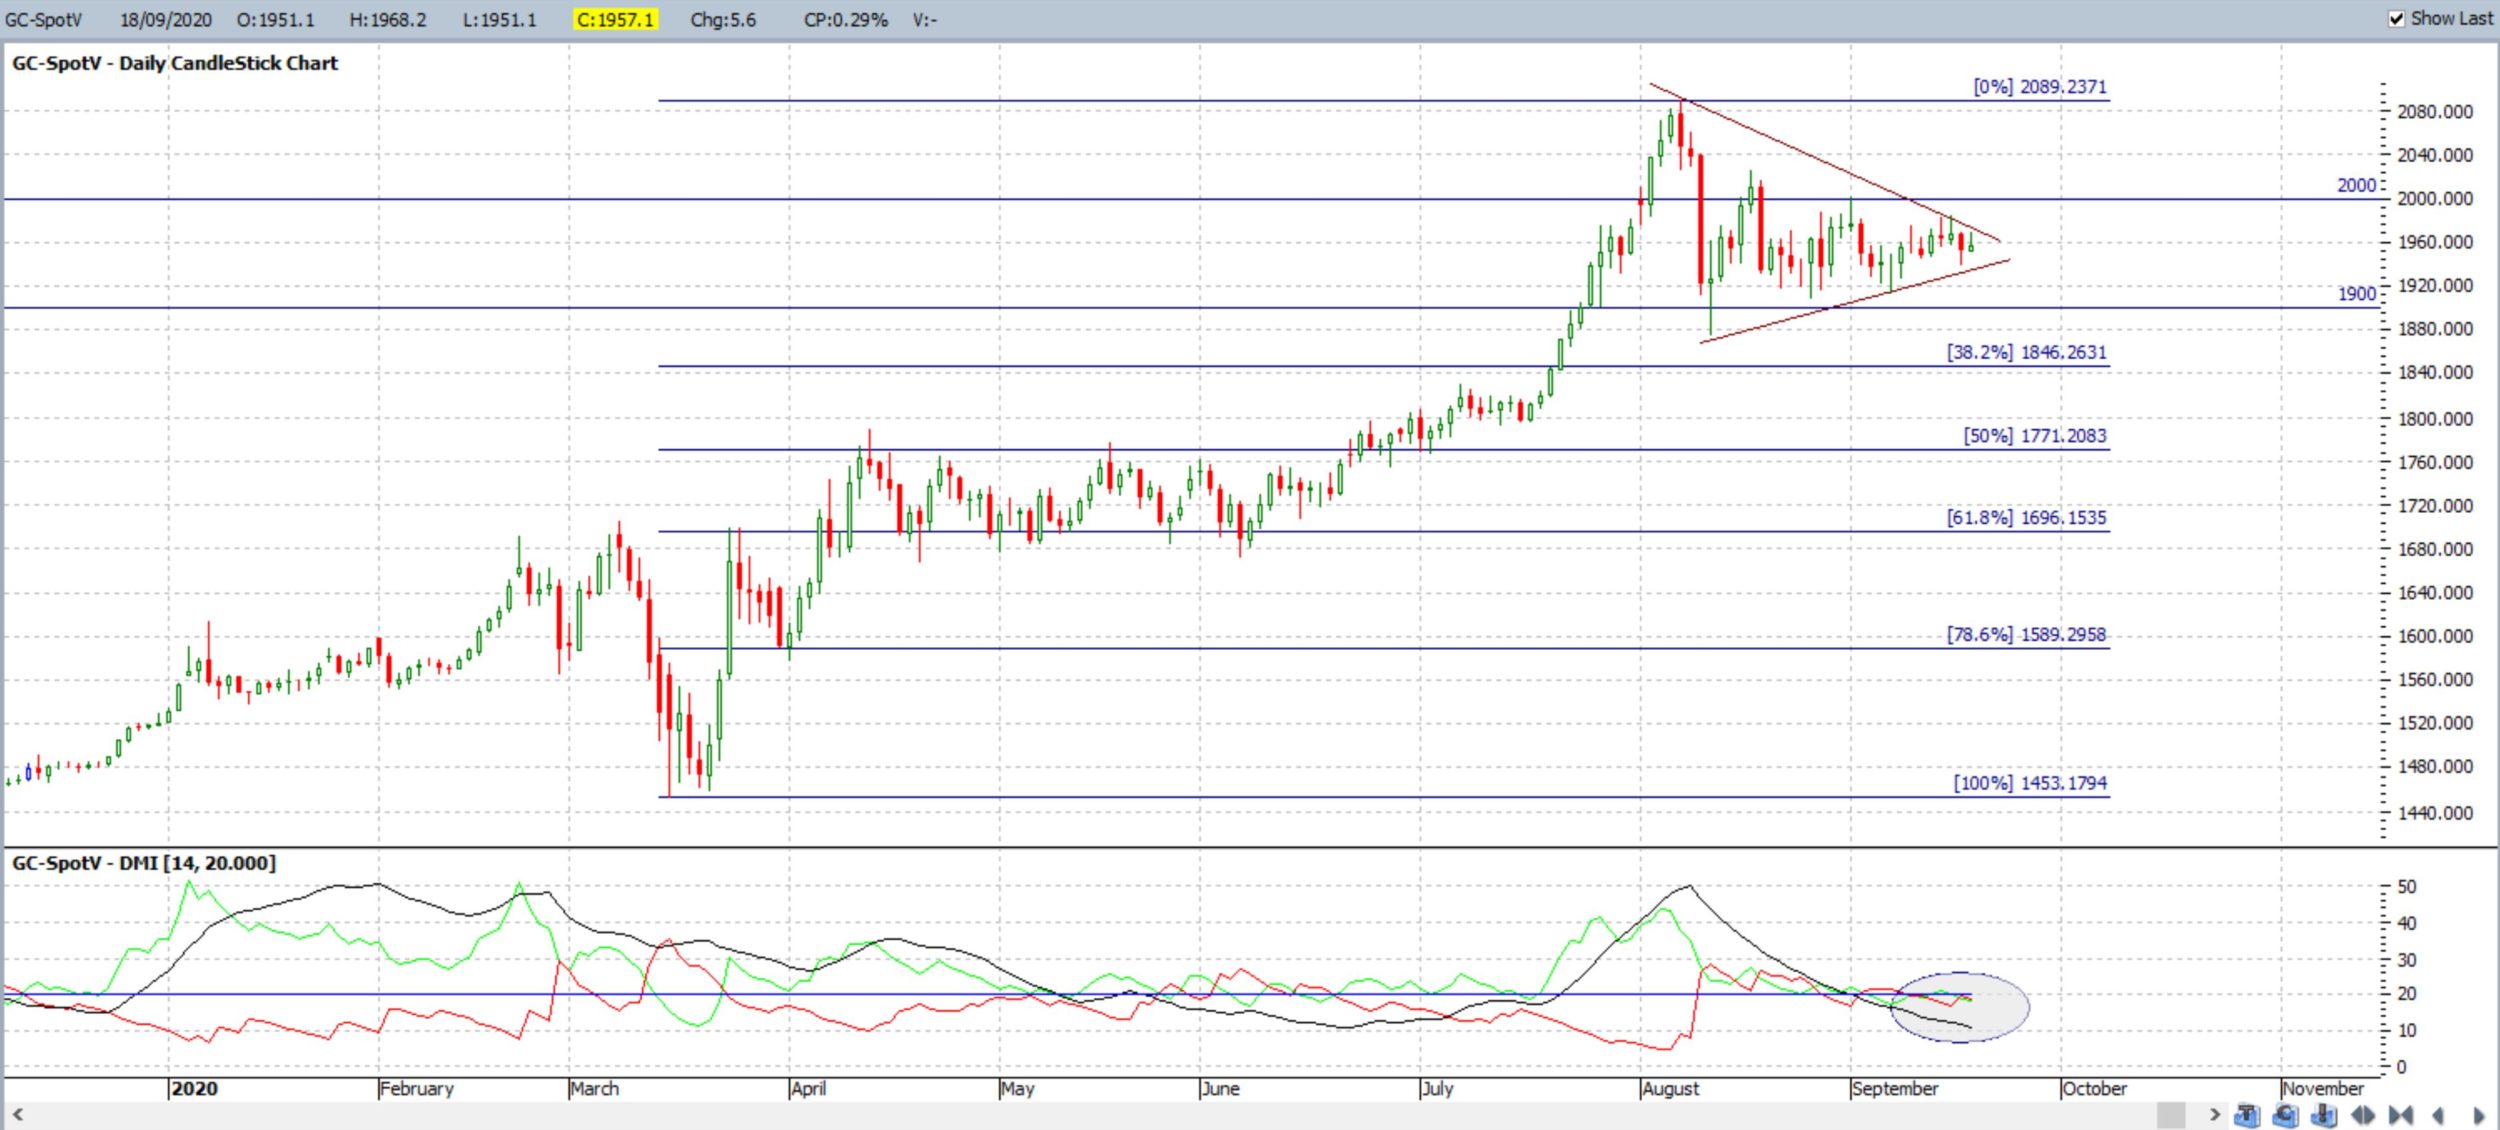
Gold: Once again, there has been little change here as Gold closed with yet another Spinning Top style weekly candle; this is the fifth consecutive such indecision-style weekly candle!
There is clearly ongoing indecision as the precious metal hovers above the key $1,900 level. The other point to keep note of is the continued lack of momentum on the 4hr and daily chart: note how the ADX is back below the threshold 20 level on both time frames. The good thing here remains that this will make it easier to identity the next momentum-based breakout move.
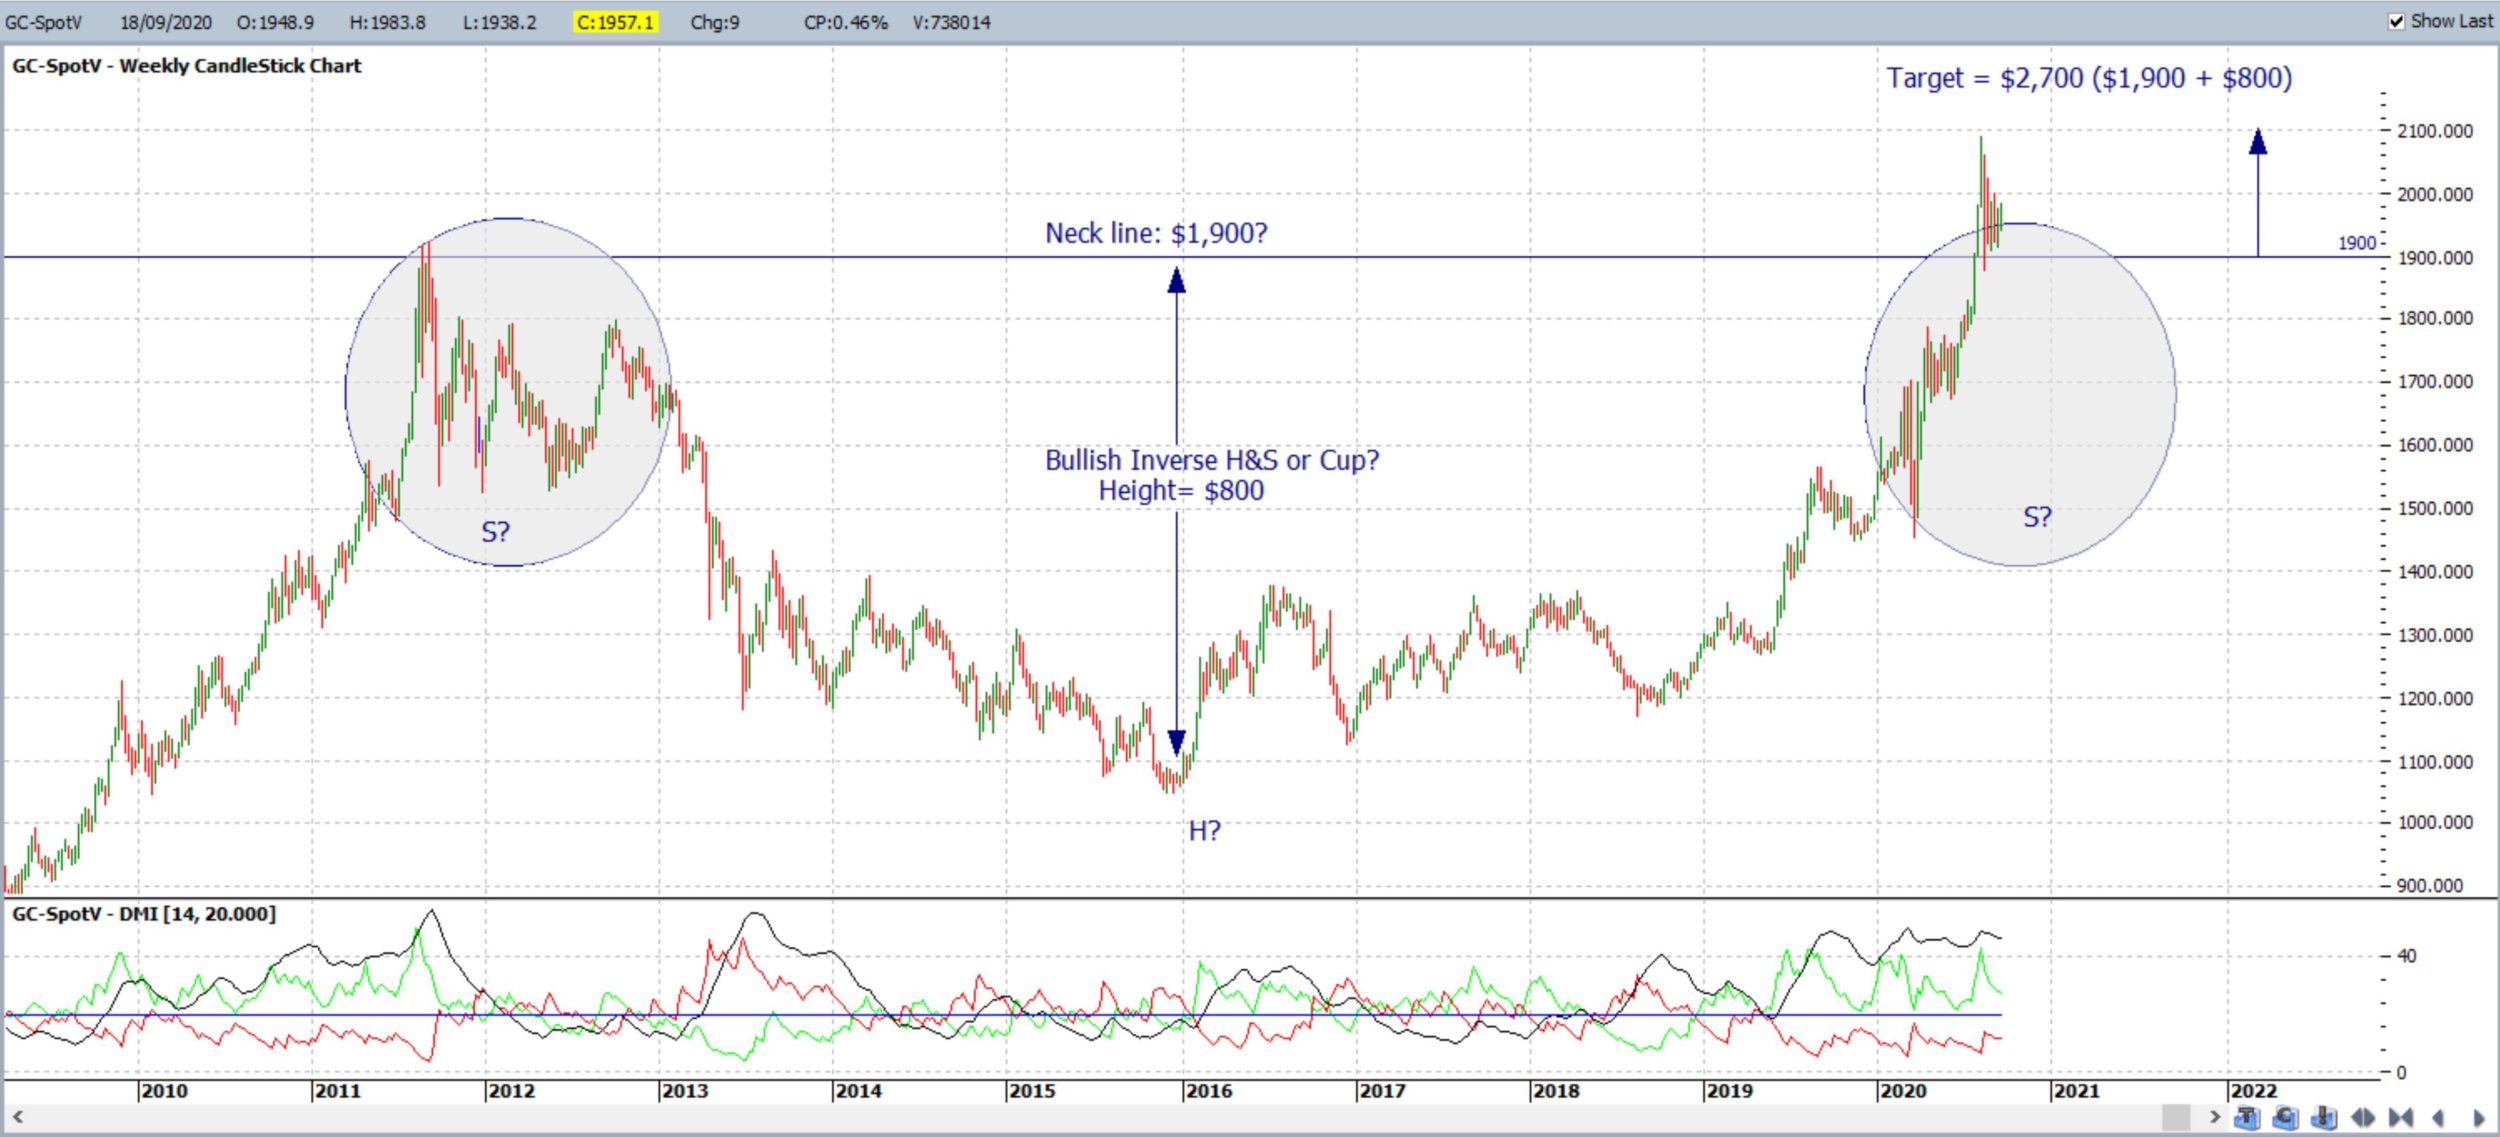
As mentioned over recent weeks: the weekly chart still has the look of a broad Inverse H&S pattern; or some may see this as a broad Cupping style pattern. Both are rather similar though as they are bullish patterns and suggest follow-through to the order of magnitude of the depth of the Cup / height of Head. In this case, that move is of around either $800. Keep watch of $1,900 now that price action is trading above this neckline region!
$1,900 remains the region in focus for any bullish Cup or Inverse H&S breakout:
- Any hold above $1,900 would support the Cup pattern thesis.
- Any new move move back below $1,900 would support the Inverse H&S pattern thesis.
Traders need to watch this $1,900 level over the coming days / weeks especially as the US$ index is struggling under the recently broken 10-year support trend line:
- any US$ hold below this multi-year support trend line could help send Gold much higher.
- any US$ recovery above this support trend line could keep Gold range-bound. This would help to further develop the Inverse H&S pattern.
Price action continues to consolidate in a 4hr chart triangle, having done so for the last six weeks, so watch these trend lines for any new breakout. The longer an instrument consolidates sideways then, often, the more powerful the breakout when it does eventually trigger.
Bullish targets: any bullish 4hr chart triangle breakout would bring $2,000 into focus as this is still near the 4hr chart’s 61.8% Fibonacci.
Bearish targets: any bearish 4hr chart triangle breakout would bring $1,900 S/R back into focus.
- Watch for any new momentum-based 4hr chart triangle breakout:
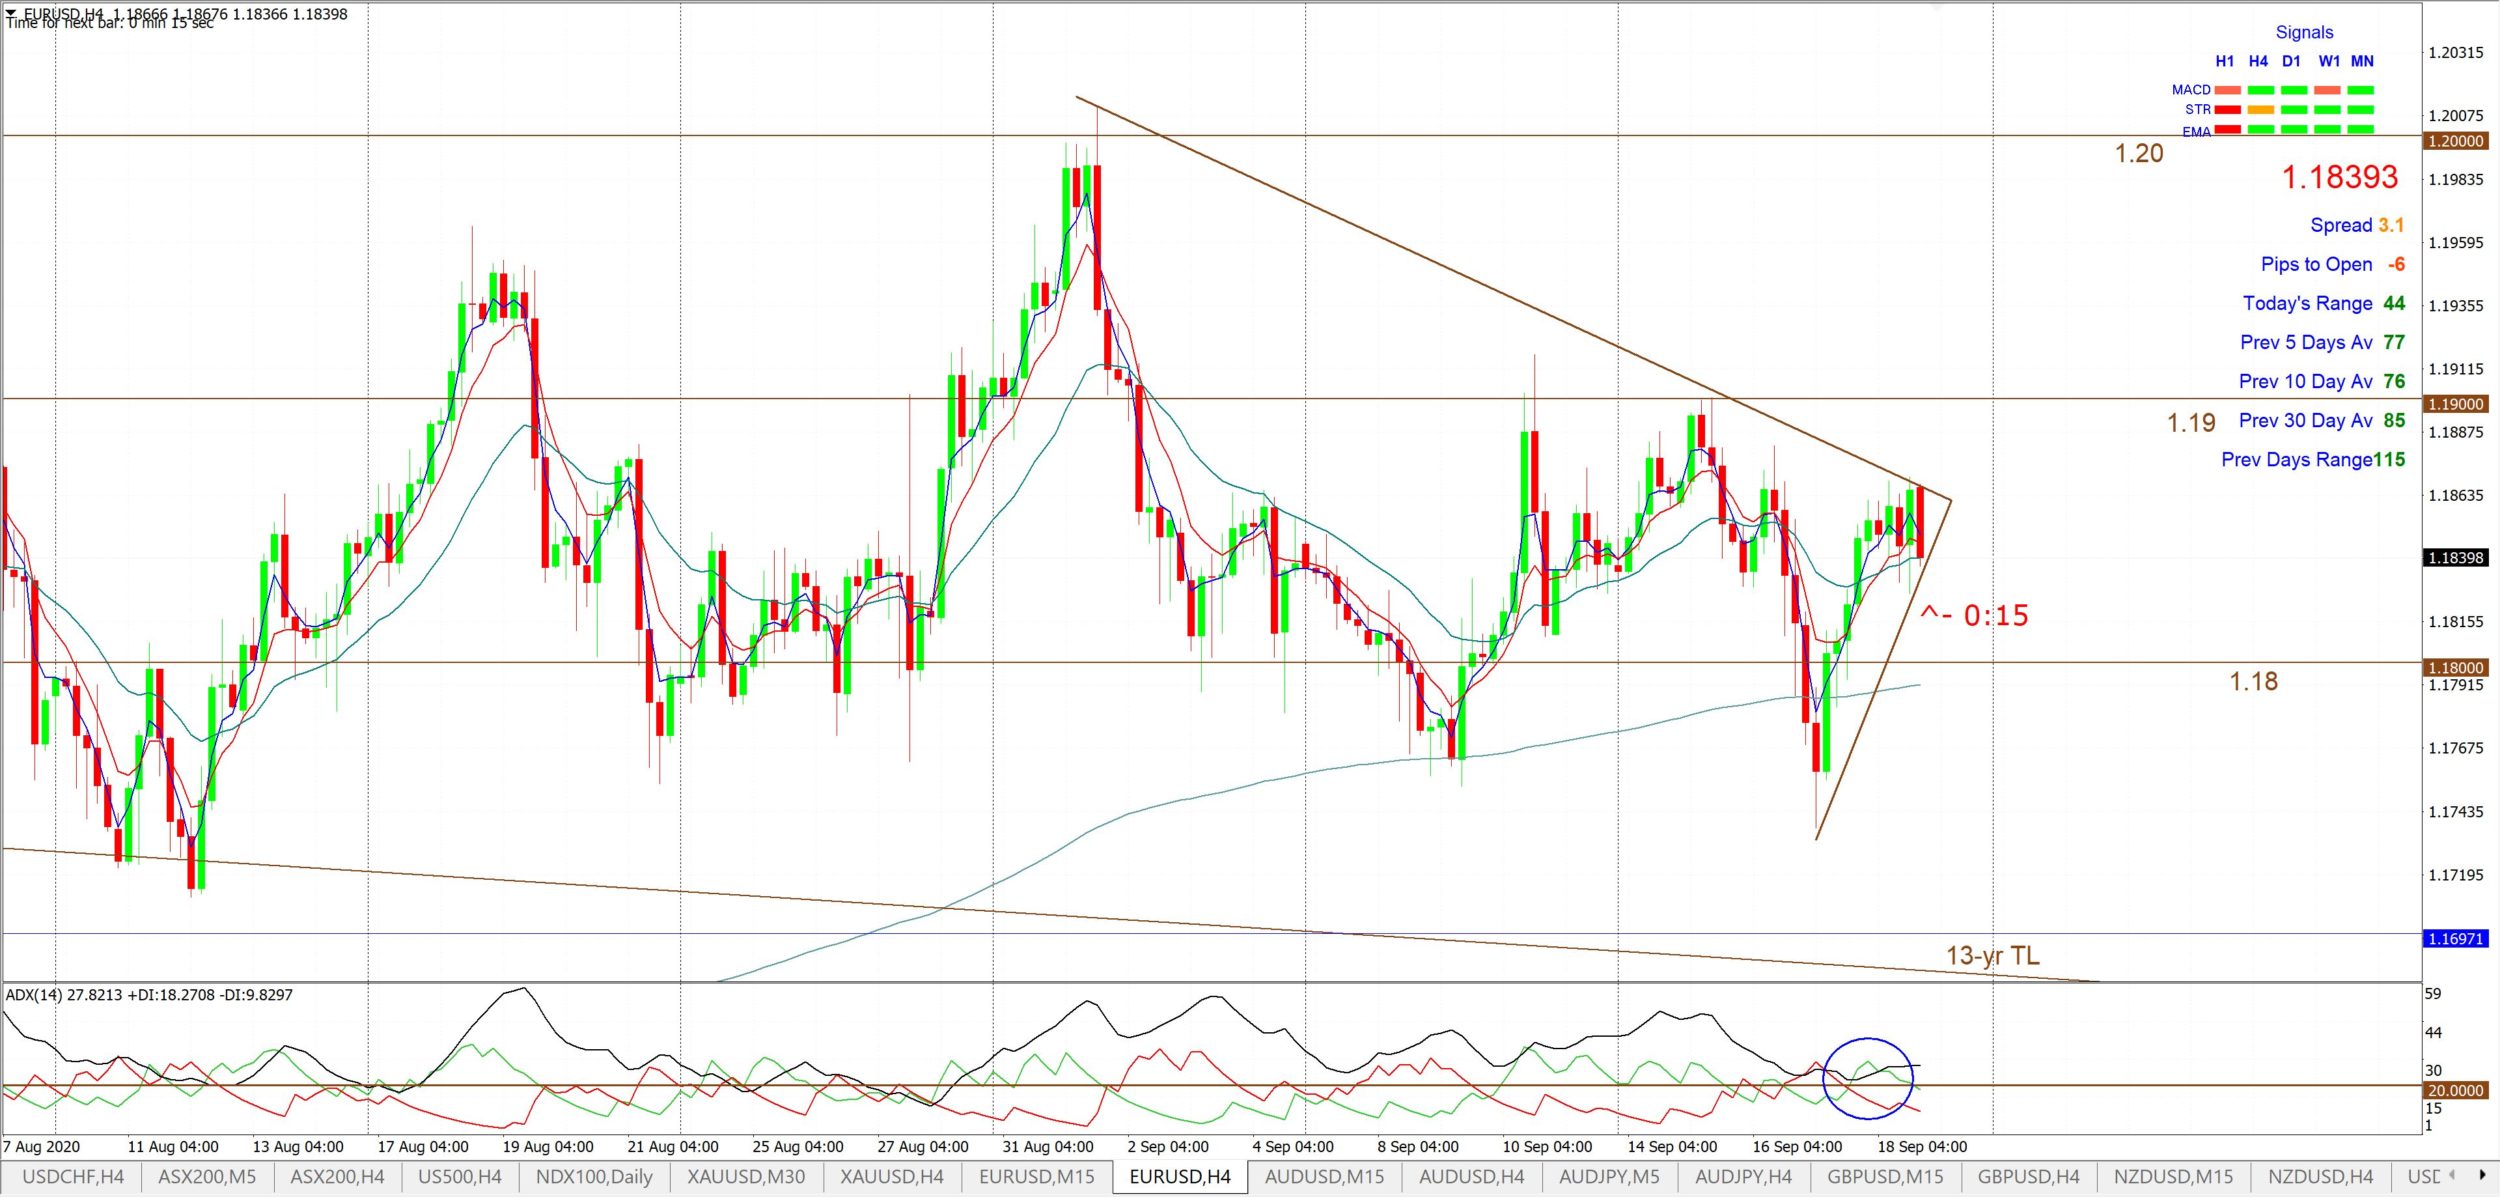
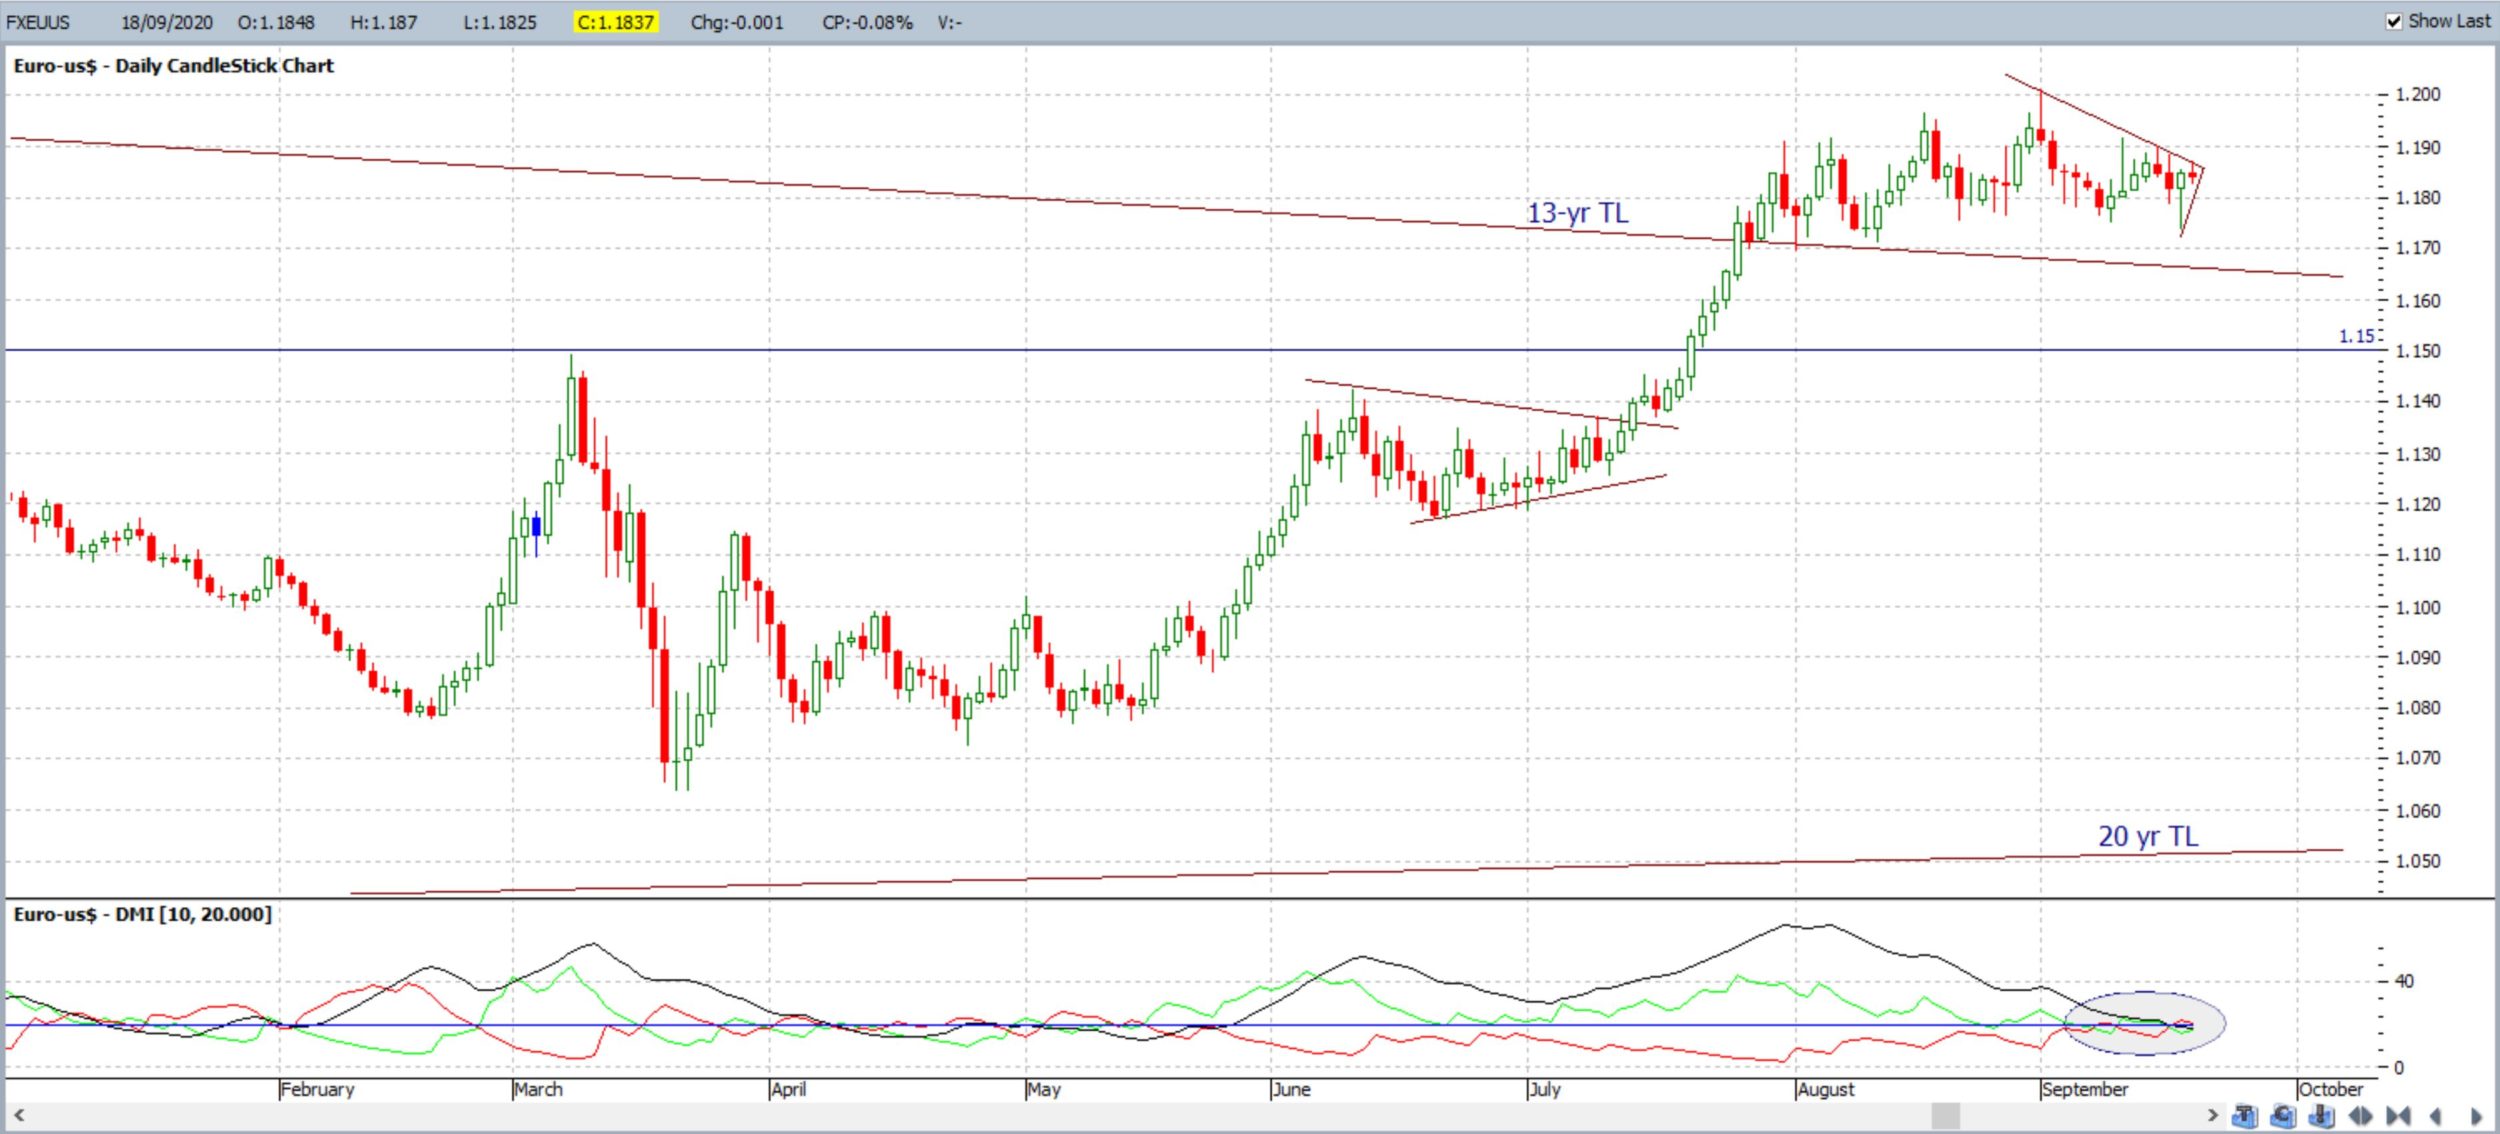
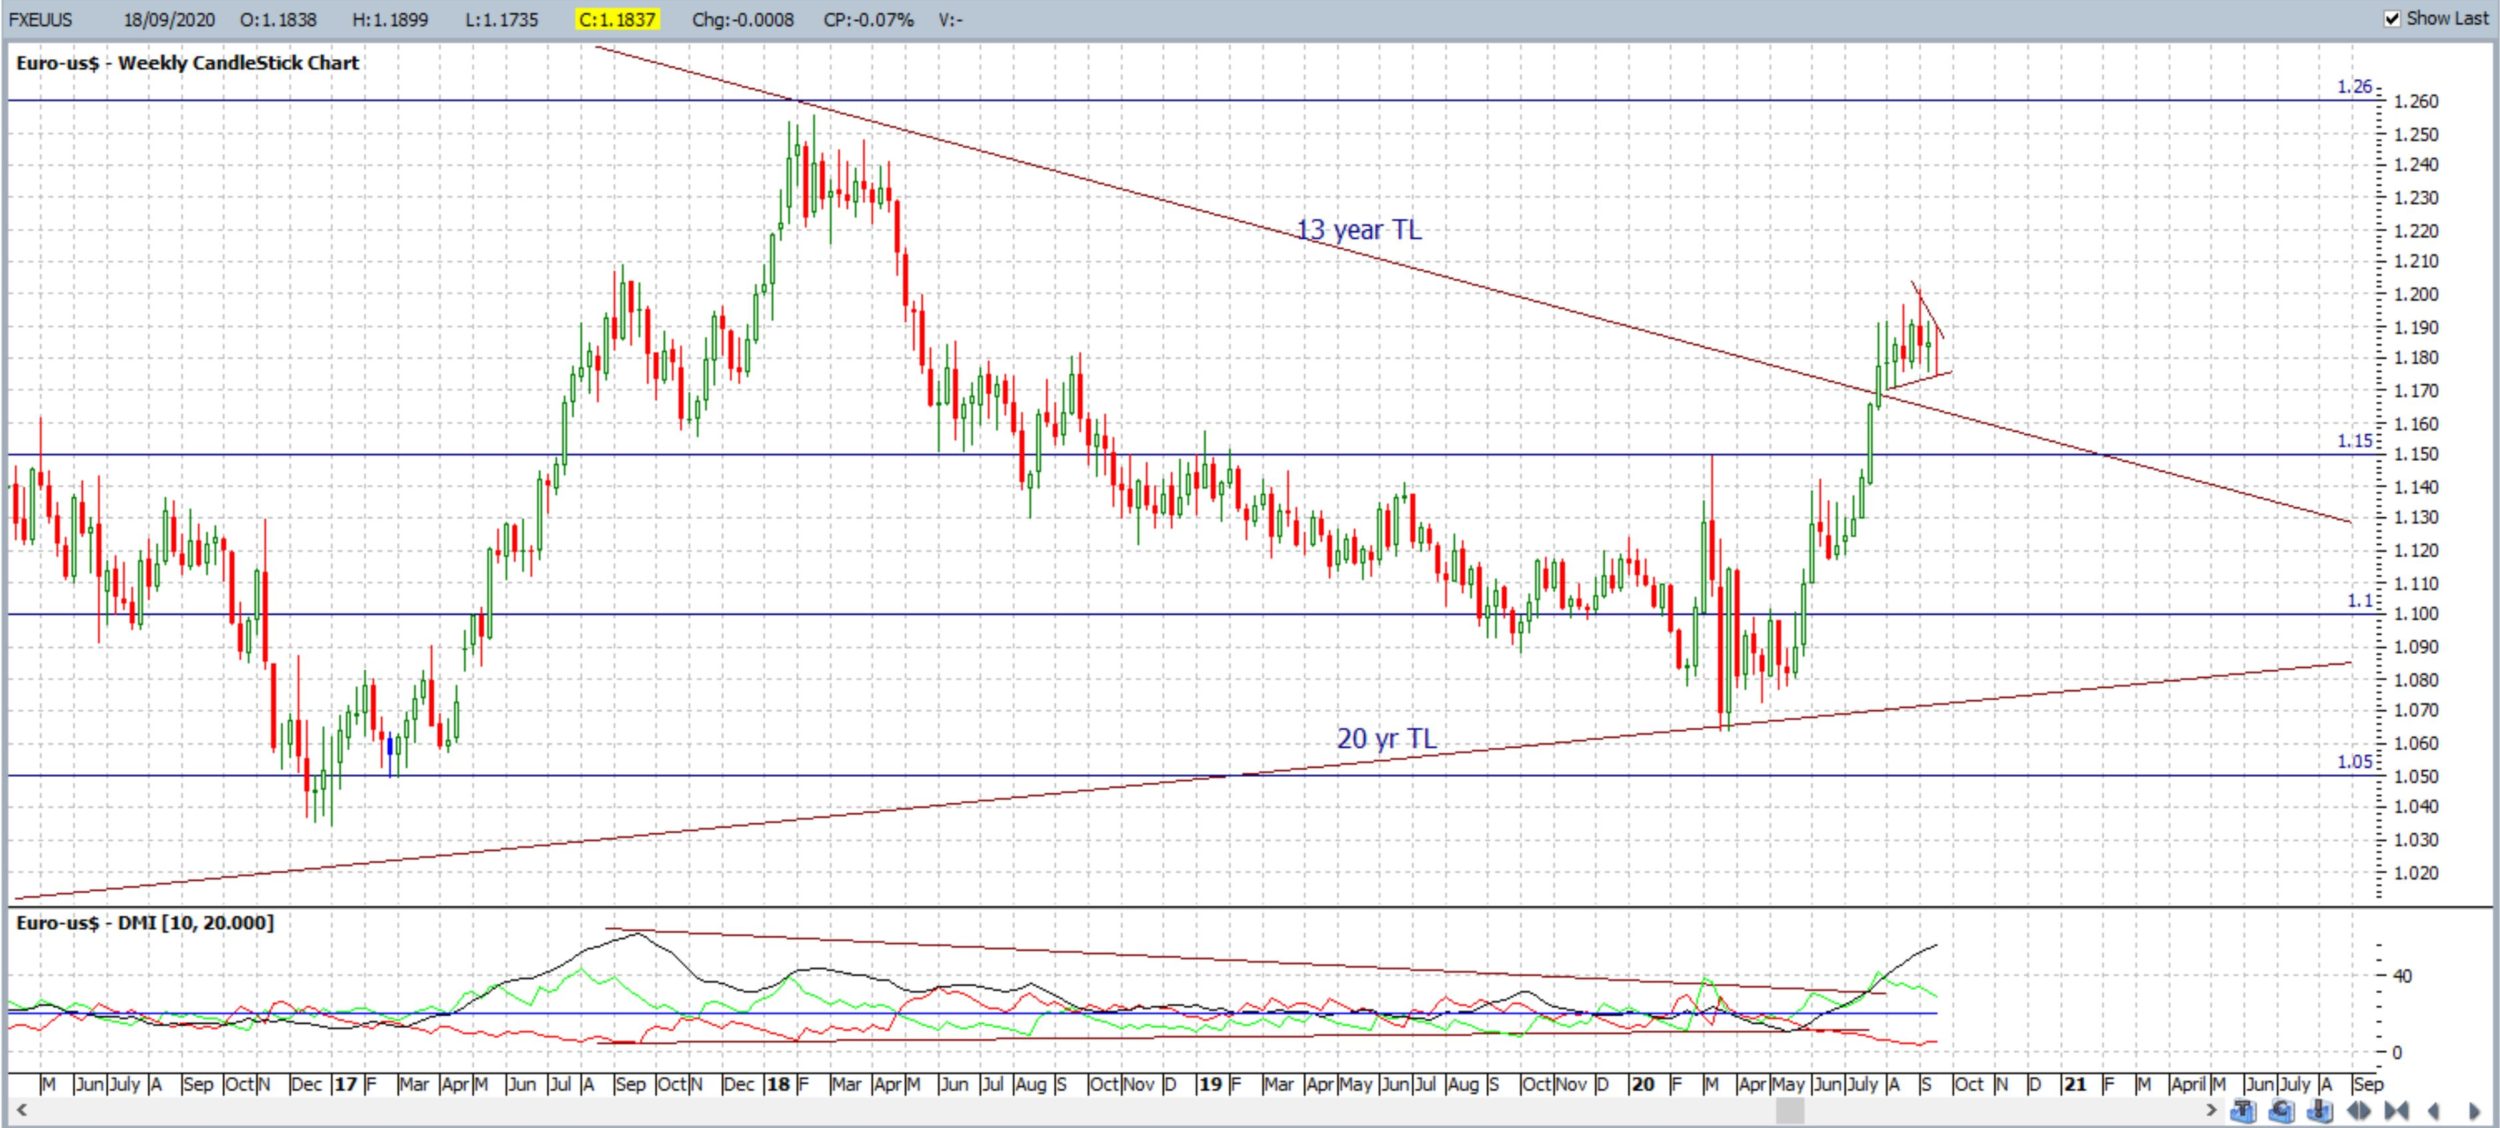
EUR/USD: The EUR/USD closed with a bearish-coloured Doji weekly candle reflecting great indecision; this is the third consecutive such weekly candle. However, price action continues to hold above the recently broken 13-year bear trend line and there is the look of a Bull Flag on the weekly chart.
There are revised 4hr chart trend lines to monitor for any new breakout.
Bullish targets: Any bullish 4hr chart triangle breakout would bring 1.19 and 1.20 S/R into focus followed by whole-number levels on the way up to the previous weekly chart High, circa 1.26.
Bearish targets: Any bearish 4hr chart triangle breakout would bring 1.18 and, then, the 13-year bear trend line into focus.
- Watch for any 4hr chart trend line breakout:
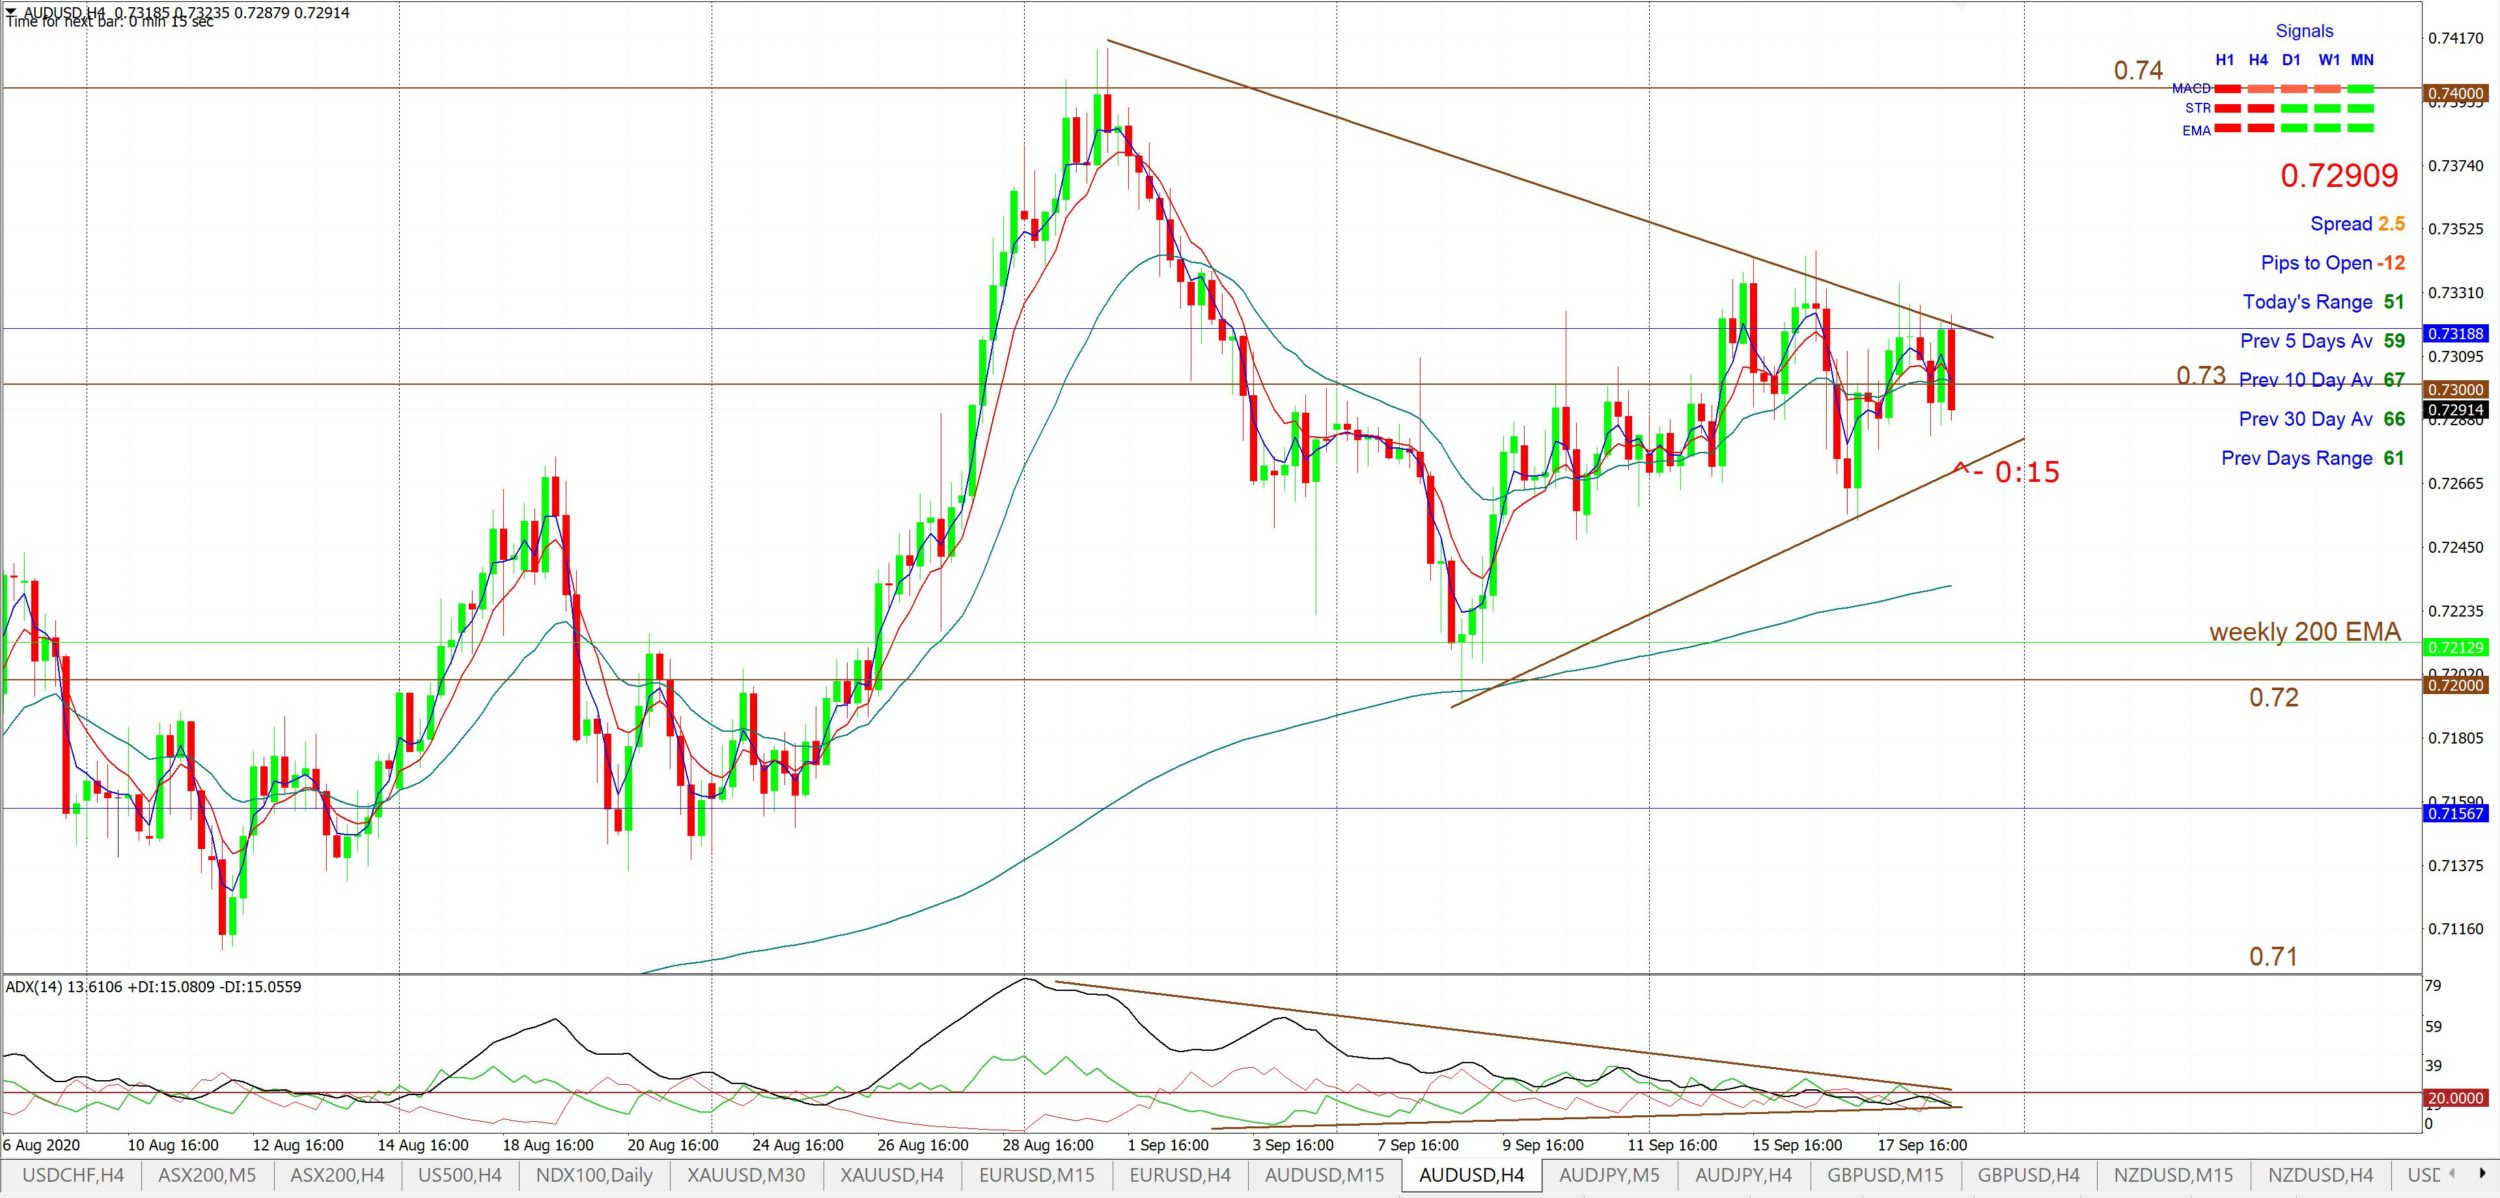
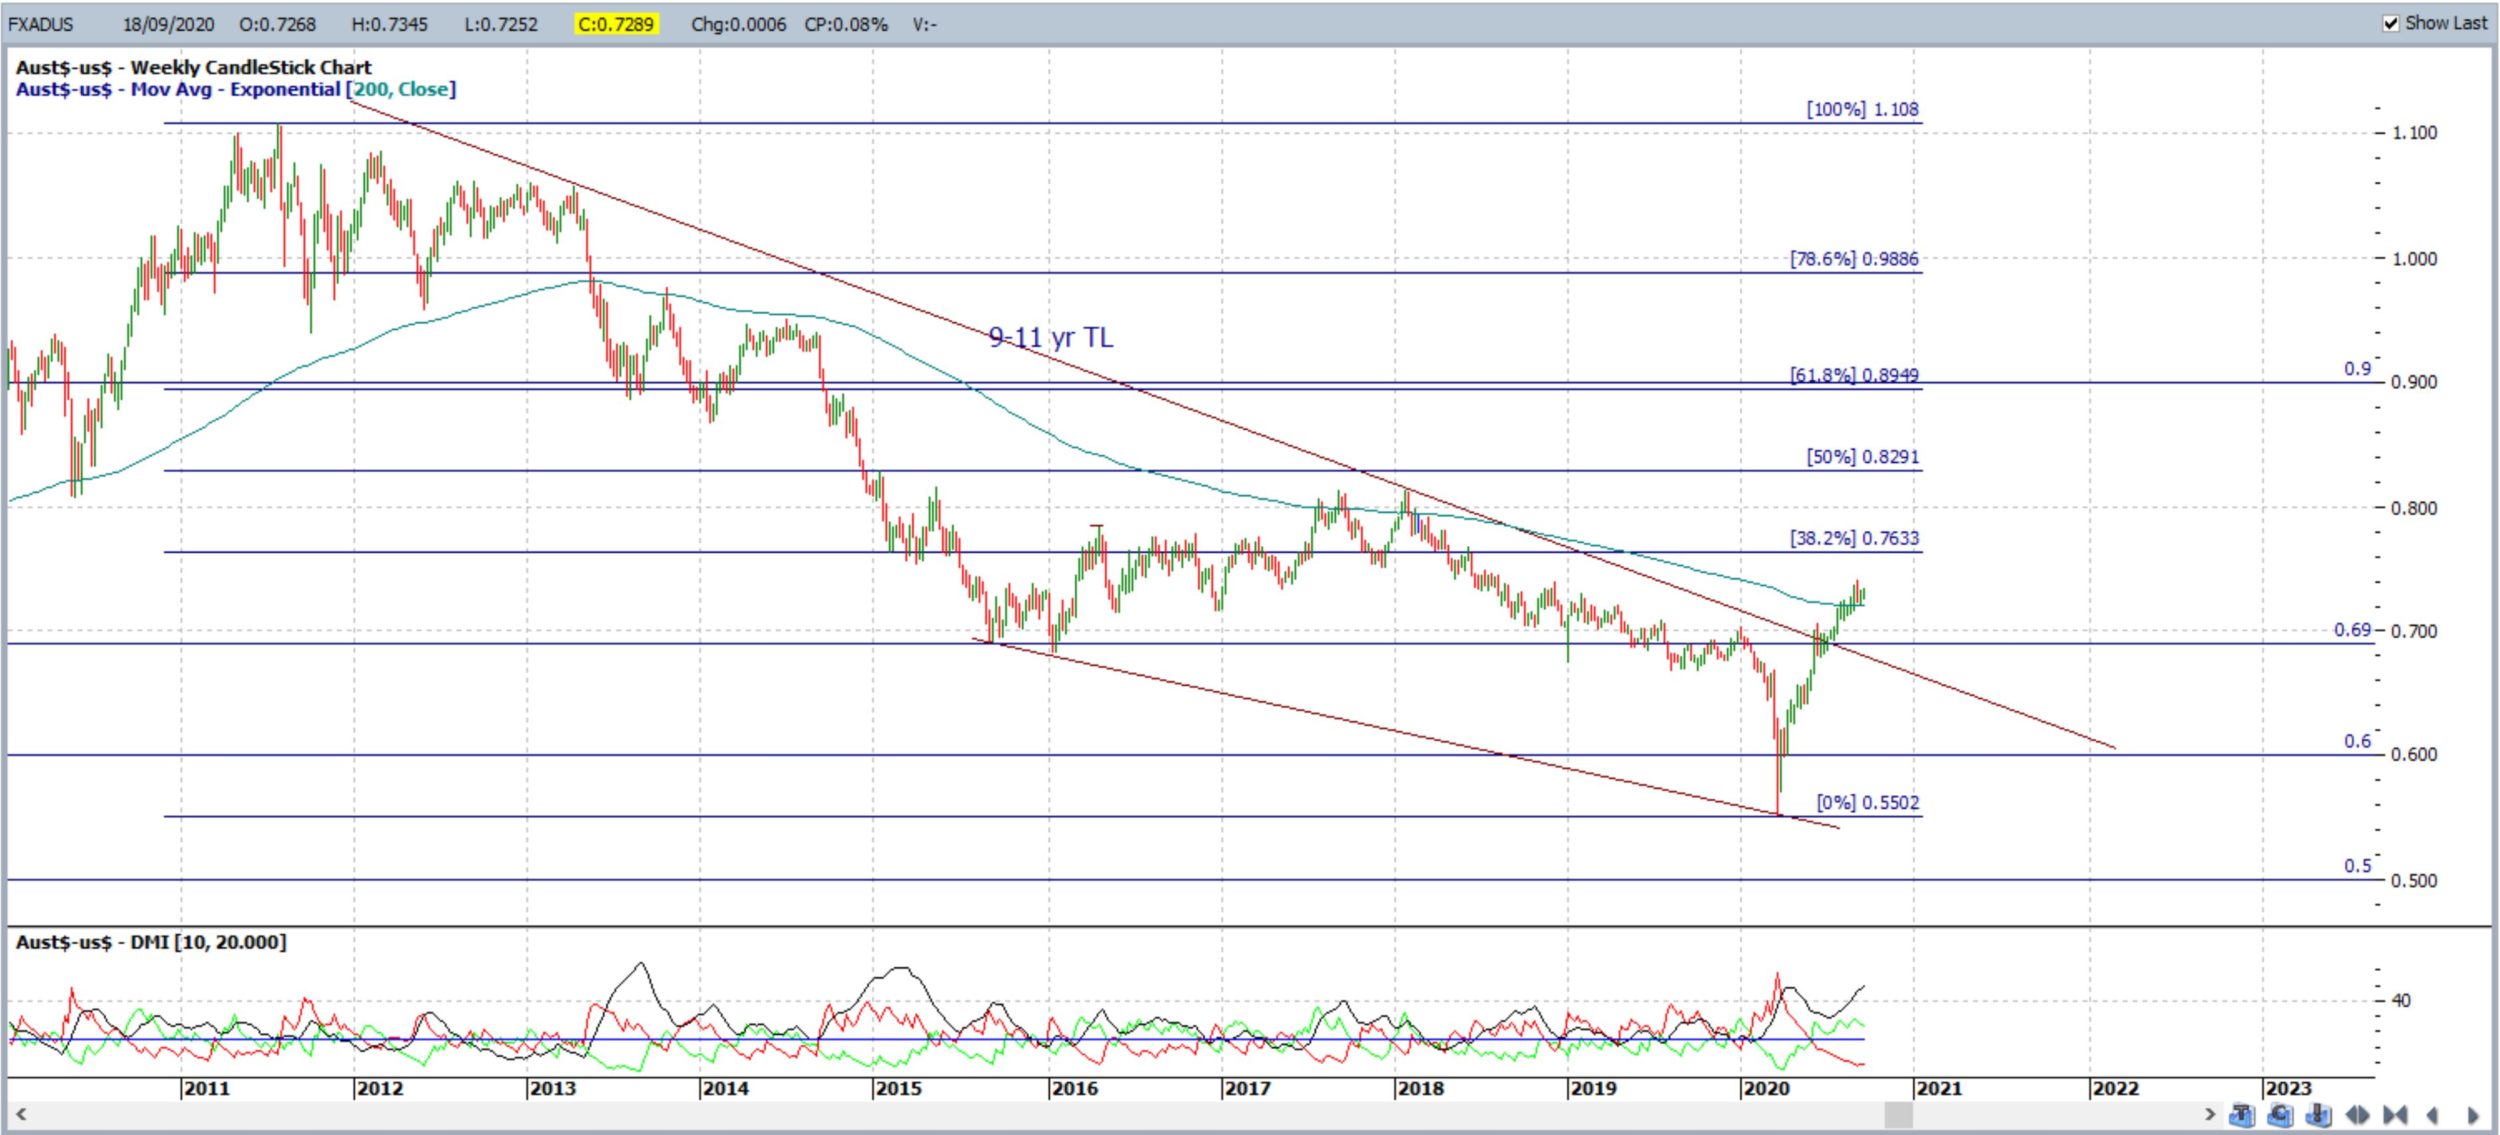
AUD/USD: The Aussie closed with a bullish-coloured Spinning Top weekly candle reflecting continued indecision; this is the third consecutive indecision style candle here. Note also how momentum on the 4hr chart has been declining and contracting over the last three weeks.
Also keep in mind that price action continues to hold above the recently broken upper trend line of the multi-year bullish-reversal Descending Wedge.
There are revised trend lines on the 4hr chart to monitor for any new momentum-based breakout.
Bullish targets: Any bullish 4hr chart trend line breakout would bring 0.74 into focus followed by whole-number levels on the way up 0.90 S/R.
Bearish targets: Any bearish 4hr chart trend line breakout would bring 0.72 into focus followed by 0.71 and, then, 0.70 and the 9-11 year bear trend line.
- Watch for any new 4hr chart triangle breakout;
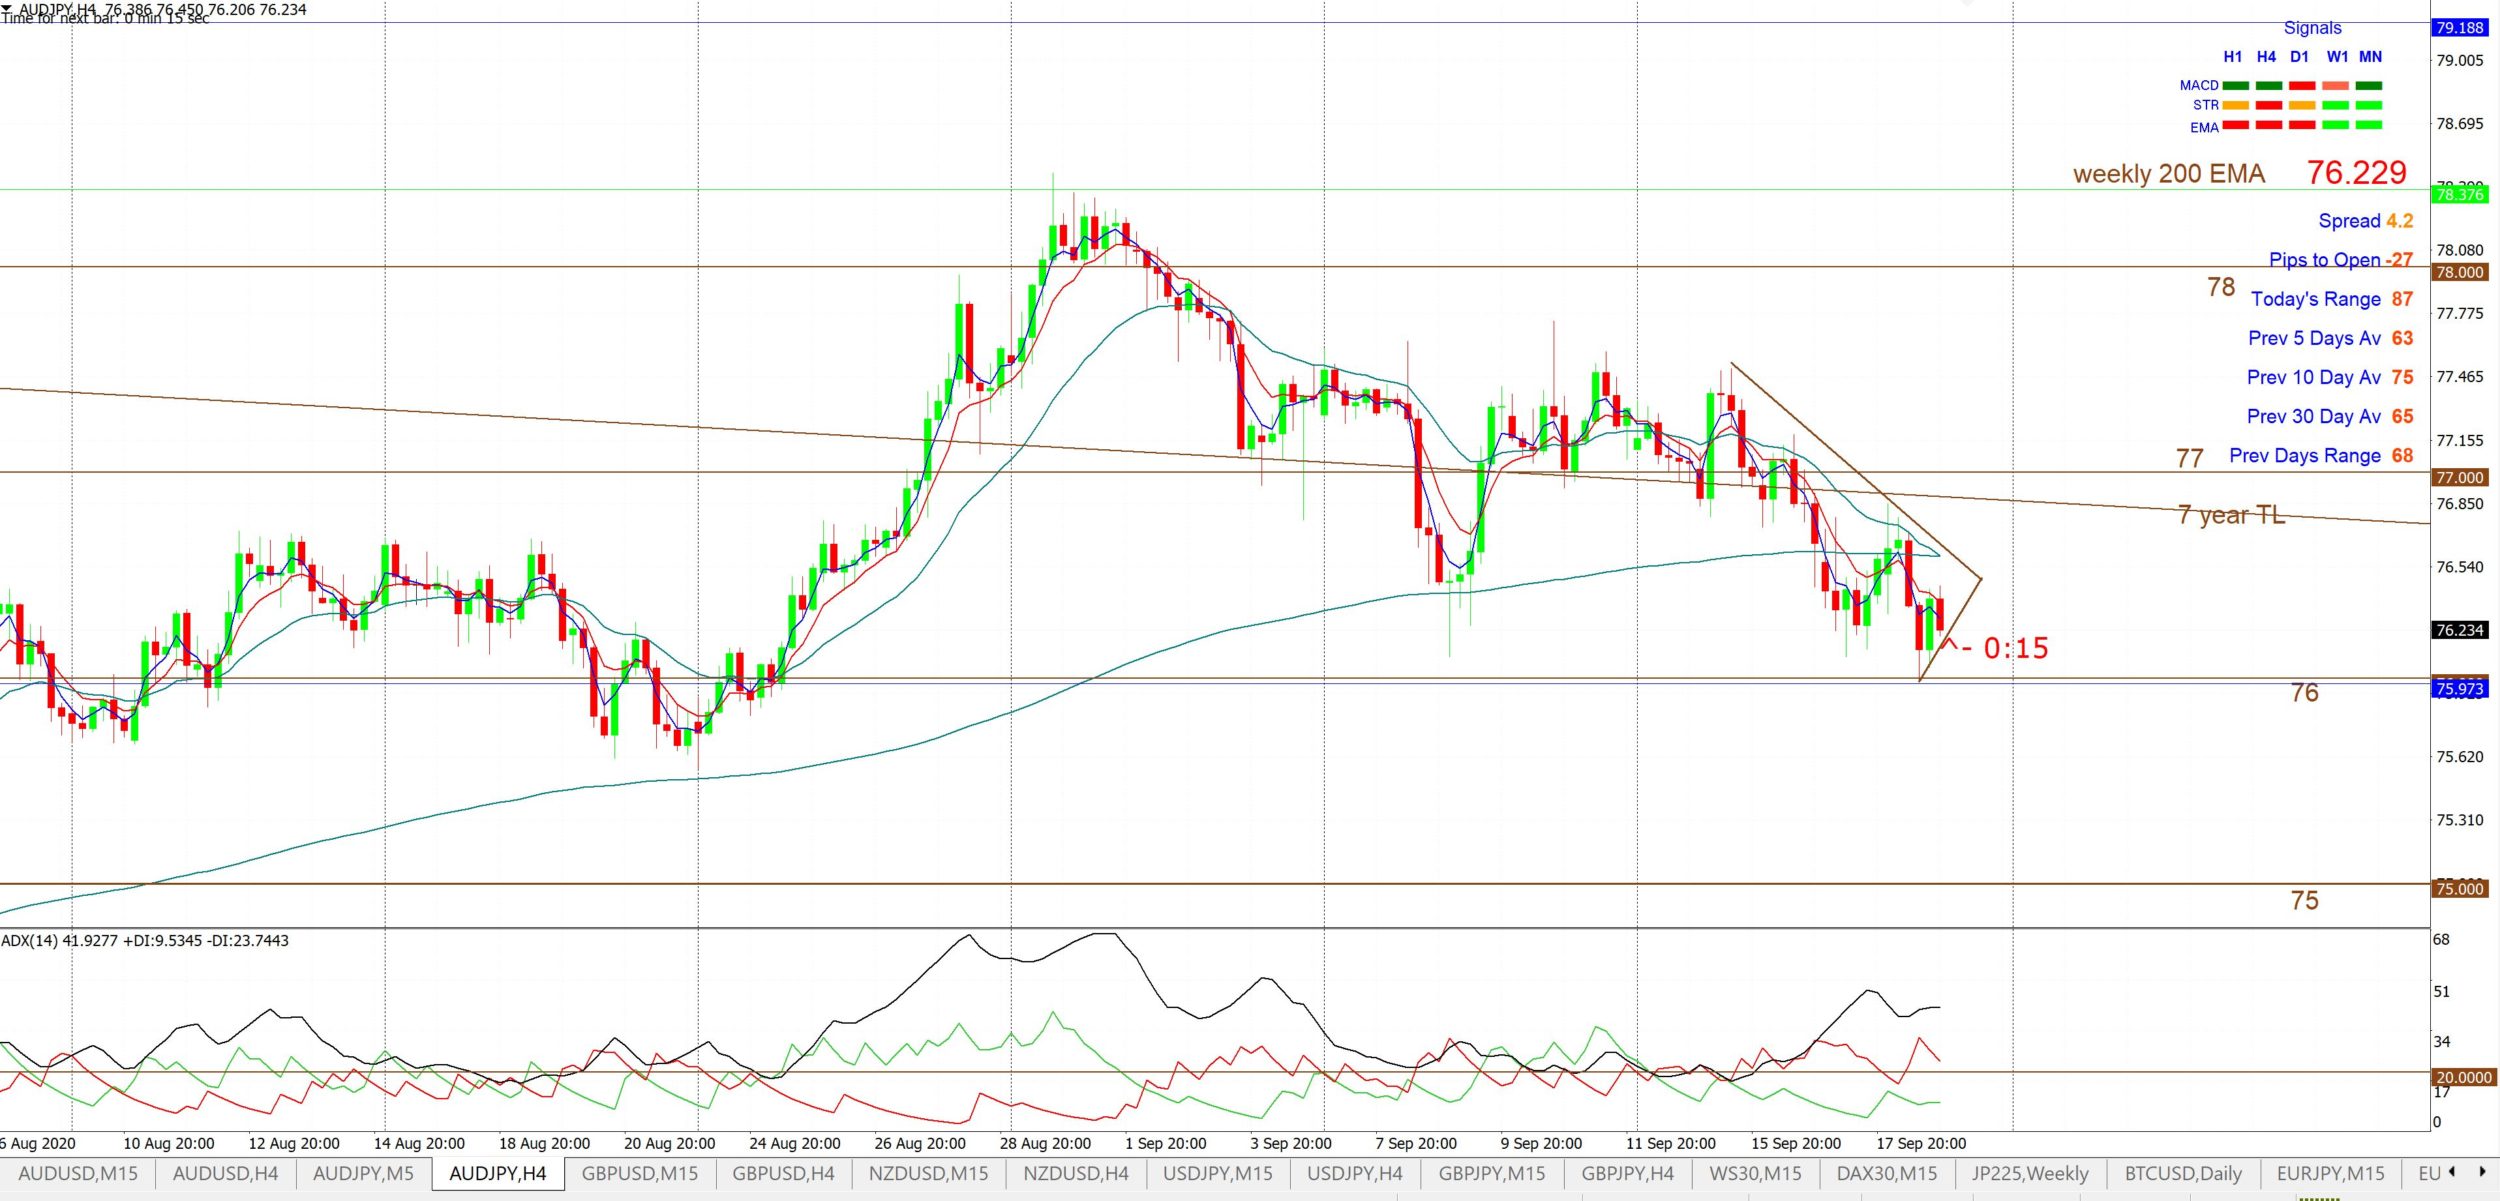
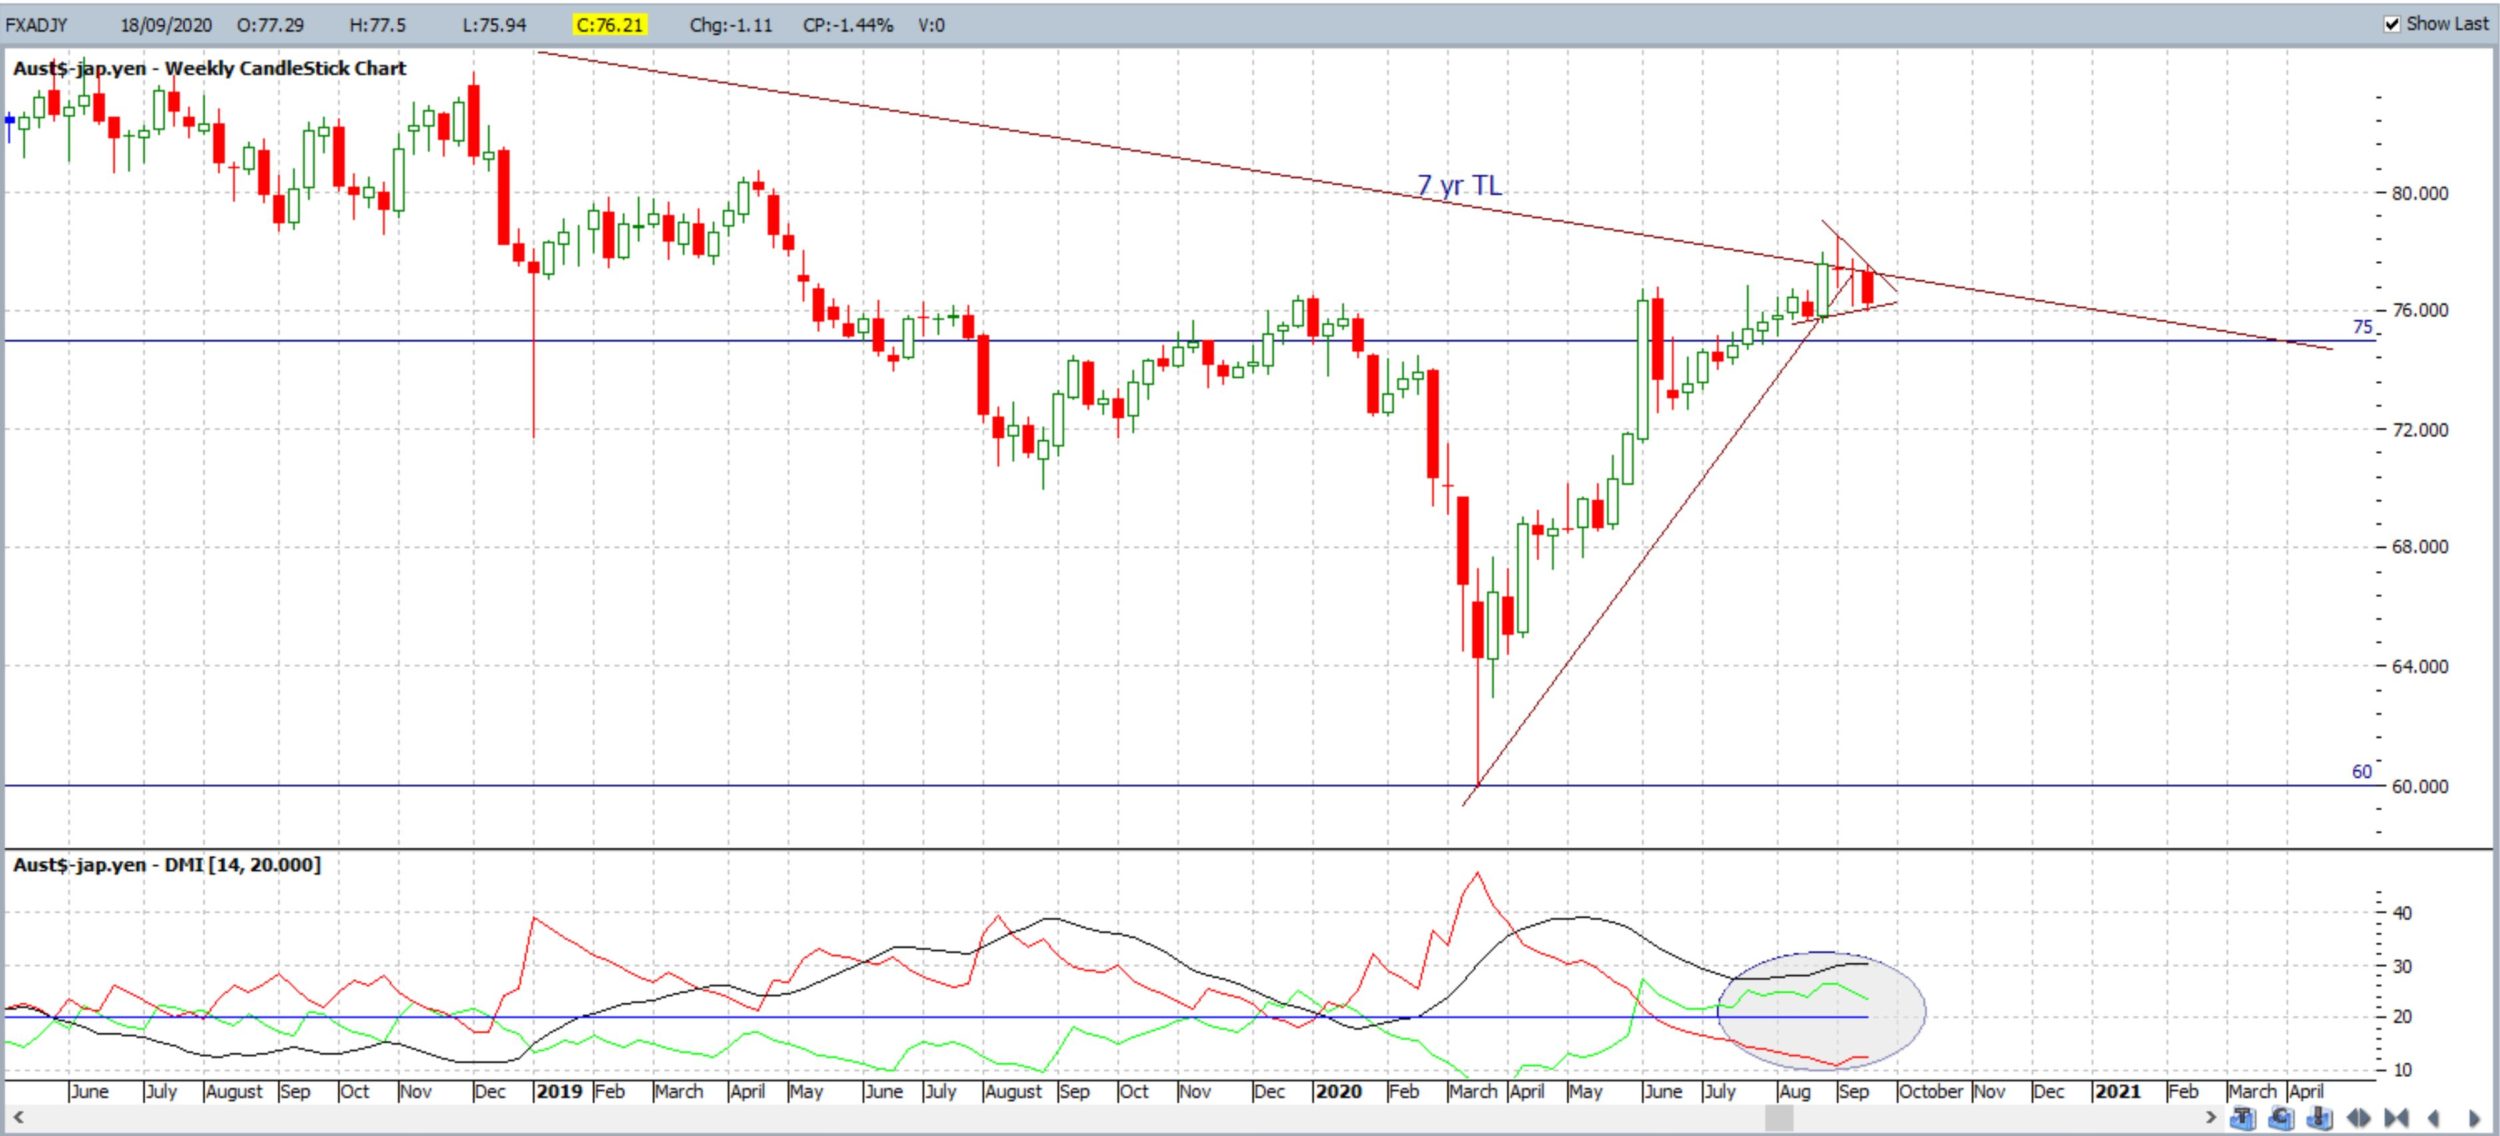
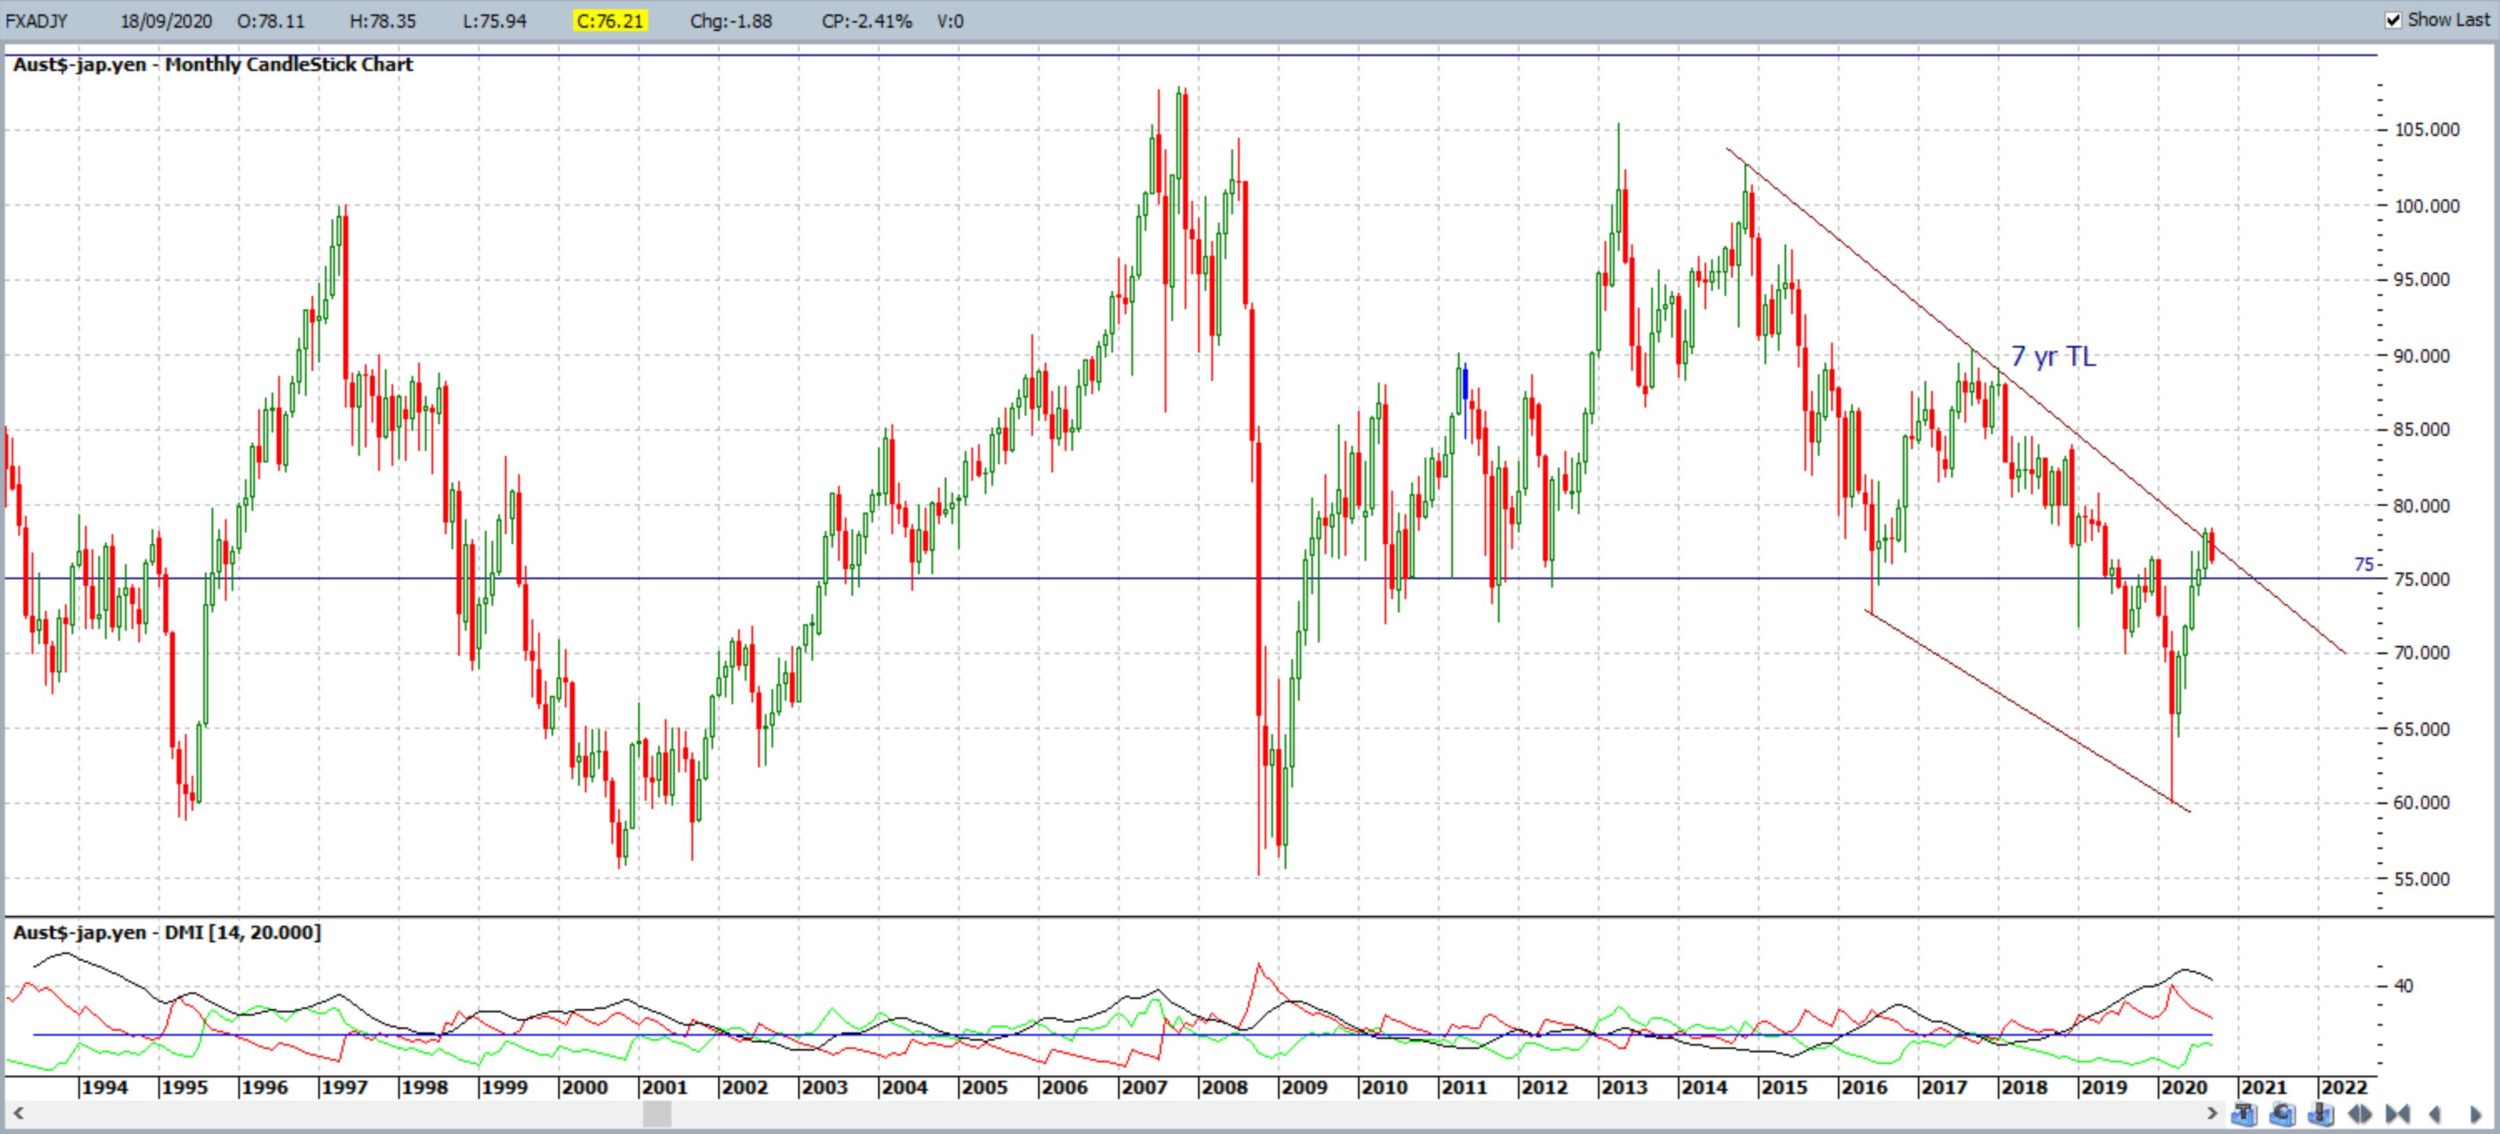
AUD/JPY: The AUD/JPY closed with a decent sized bearish weekly candle and back below the recently broken 7-year bear trend line. Price action closed above the 76 S/R level but it is the 75 level that would be in greater focus if bearish activity continues. The monthly chart below shows the importance of this 75 S/R level.
As mentioned over recent weeks: How the AUD/JPY reacts at the 7-year bear trend line above might depend on how the S&P500 reacts as it trades near the all-time High so keep an eye on both!
There are revised 4hr chart triangle trend lines to monitor for any new momentum breakout.
Bullish targets: Any bullish 4hr chart triangle breakout would bring the 7-yr bear trend line and 77 into focus followed by 78, the weekly 200 EMA, 79 and, then, 80 S/R.
Bearish targets: Any bearish 4hr chart triangle breakout would bring 76 and 75 into focus followed by whole-numbers on the way down to 65 S/R.
- Watch for any new 4hr chart triangle breakout;
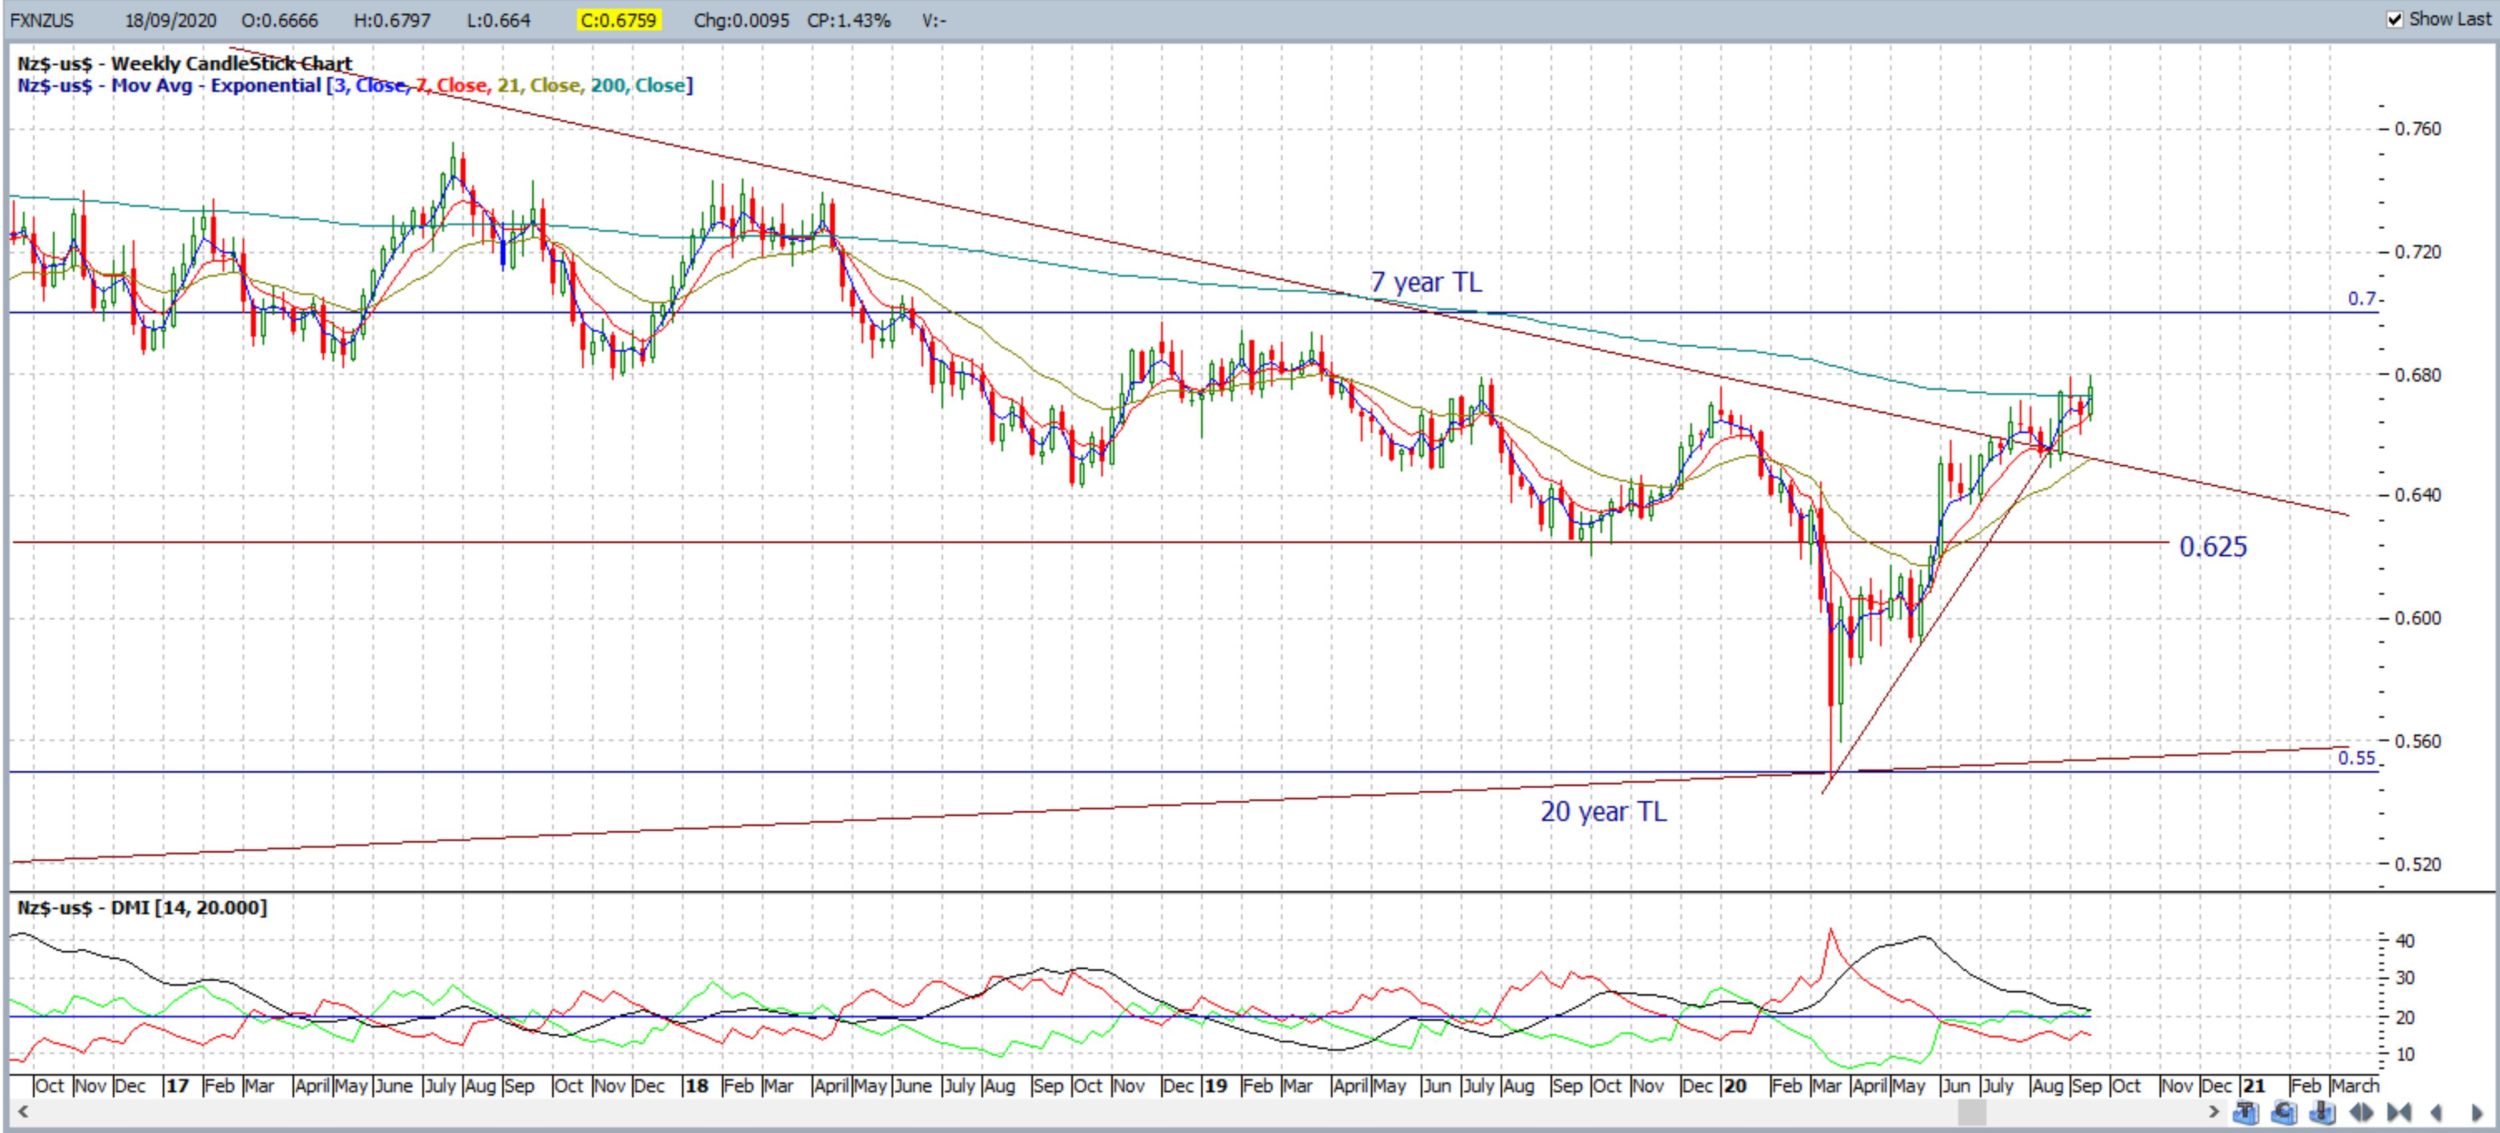
NZD/USD: The Kiwi closed with a bullish weekly candle as price continues to hold above the recently broken 7-year bear trend line. This bullish action is at odds though with the sentiment that has impacted broader stock markets and the Yen!
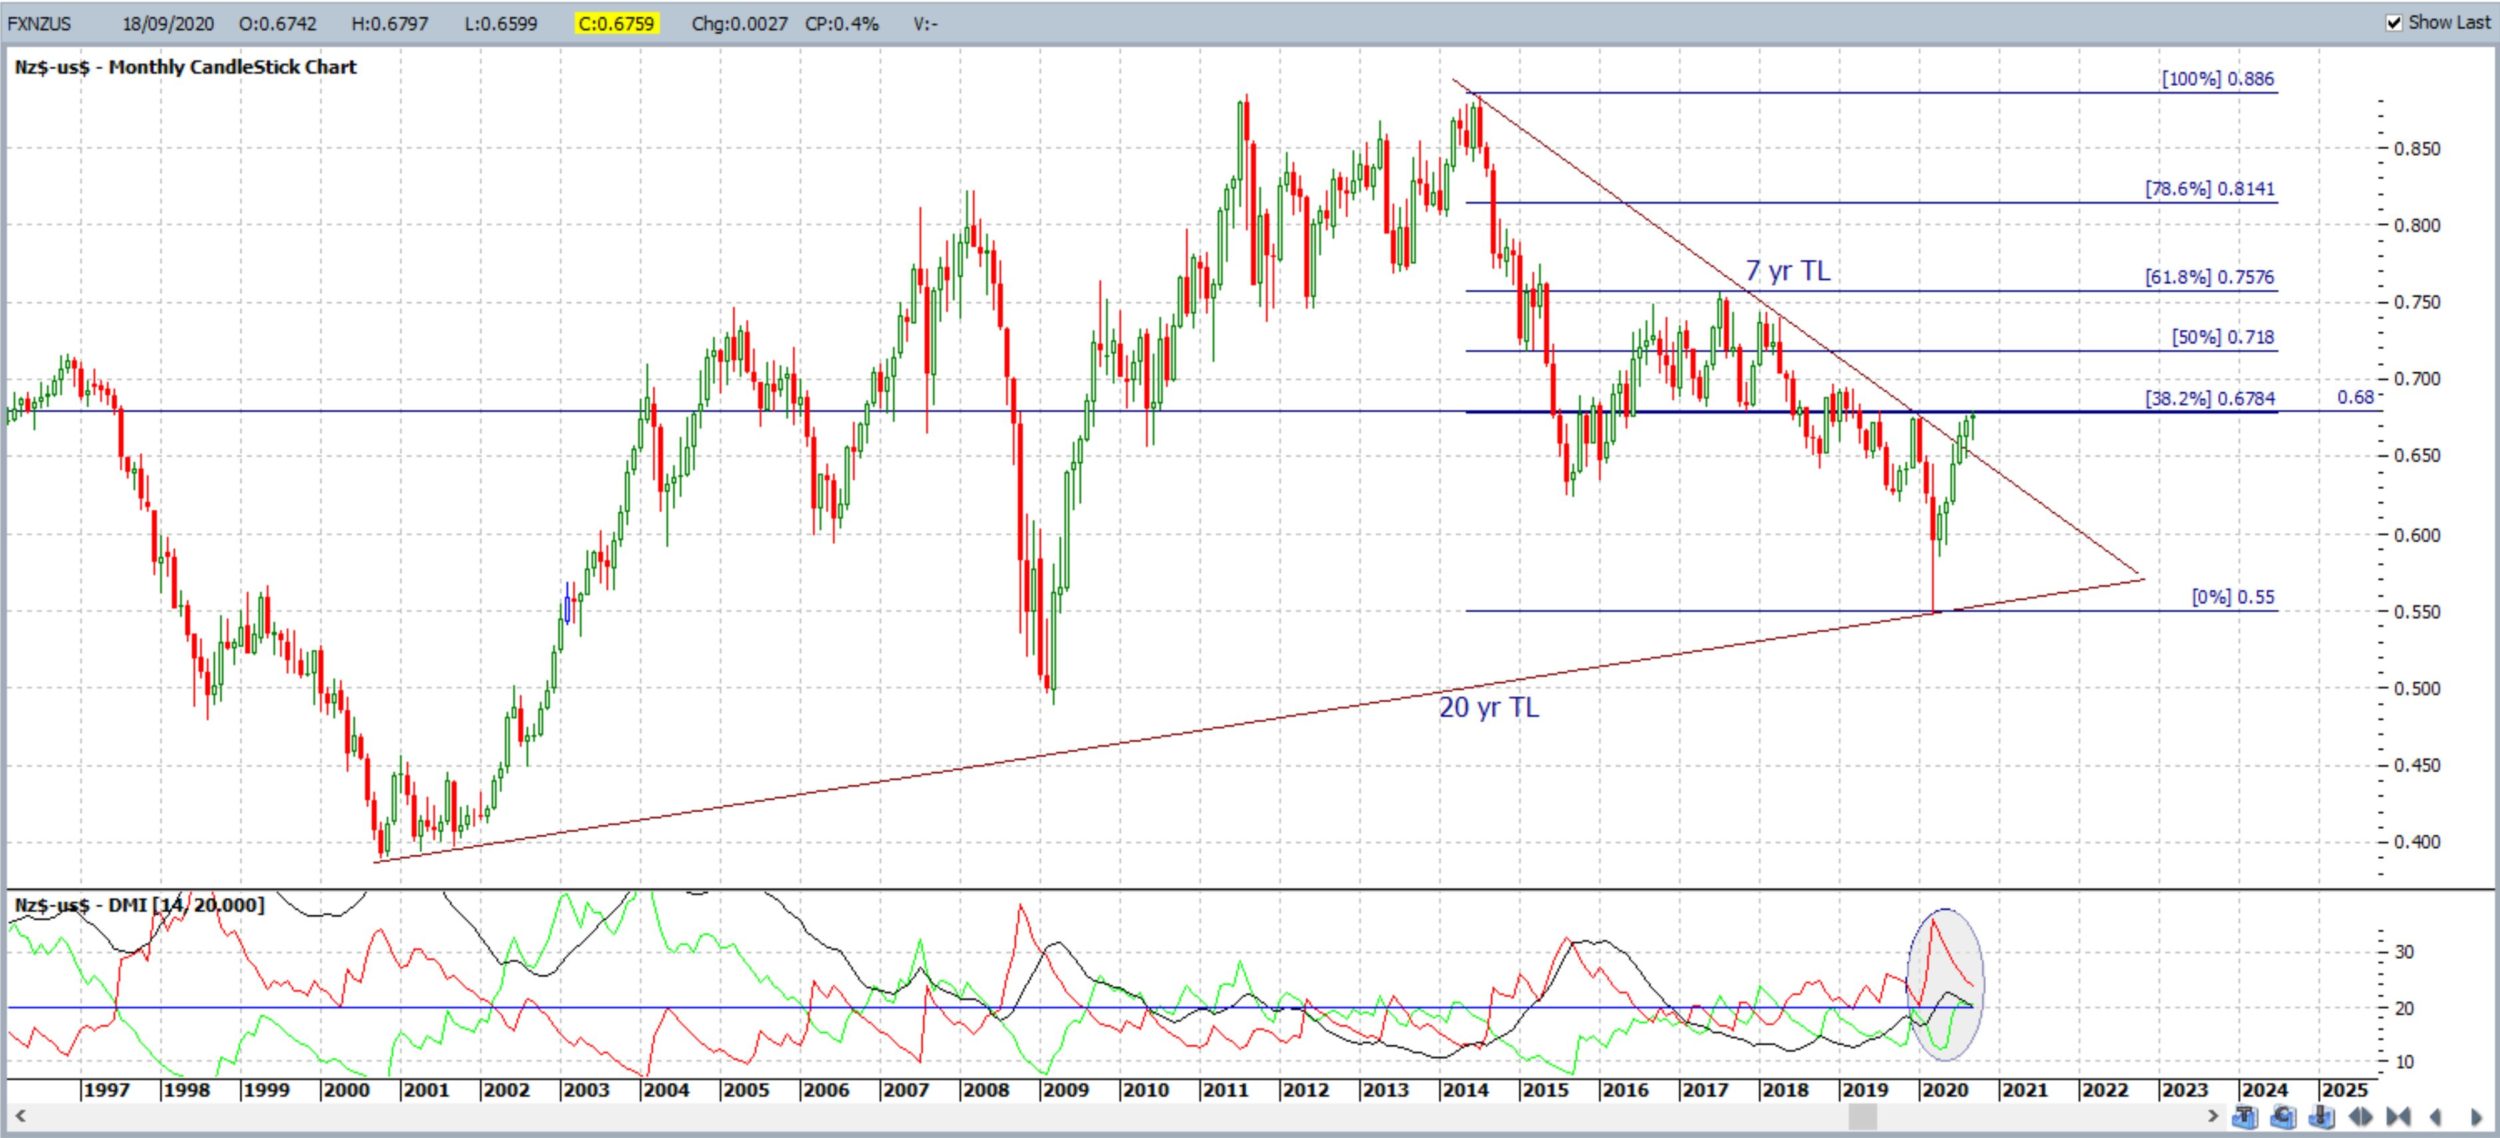
Price action closed just below 0.68 making this the new level to watch for any new make or break; especially with this week’s RBNZ rate update. Bloomberg reports that the New Zealand economy is rebounding strongly following Covid-19 and this will be taken into account with any interest rate decision. The monthly chart below reveals the importance of the 0.68 level; it has been a major reaction zone over the years. There are revised trend lines to monitor as well.
Bullish targets: Any bullish 4hr trend line breakout above 0.68 would bring 0.70 S/R into focus.
Bearish targets: Any bearish 4hr chart trend line breakout would bring 0.67 into focus followed by 0.66 and, then, the recently broken 7-yr trend line.
- Watch 0.68 and for any 4hr chart trend line breakout; especially with this week’s RBNZ rate update:

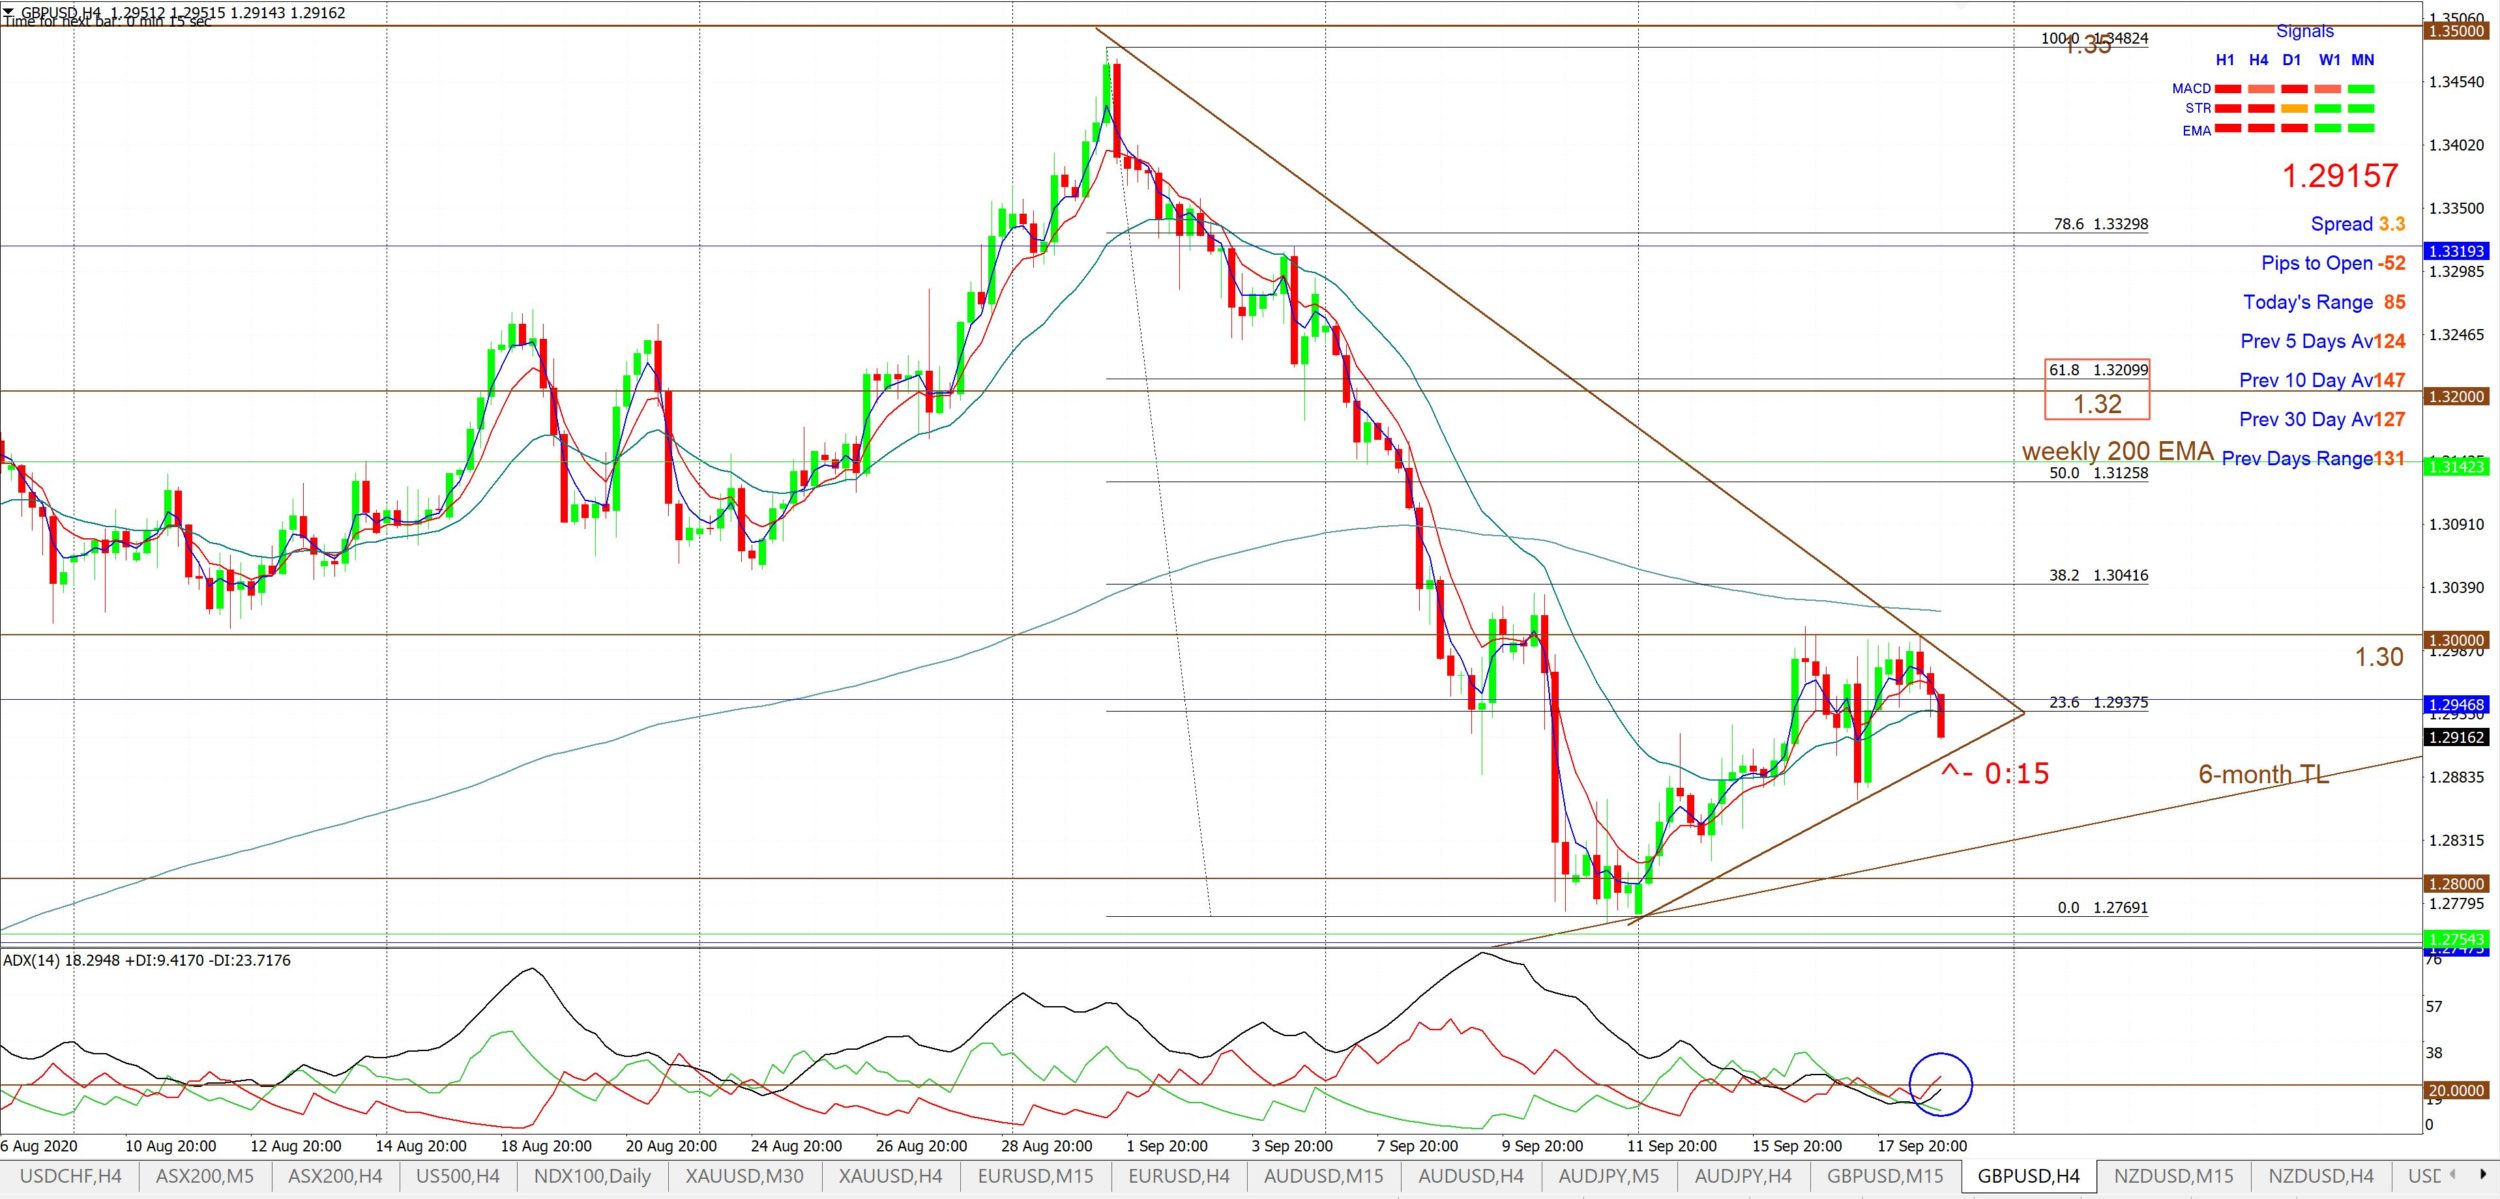
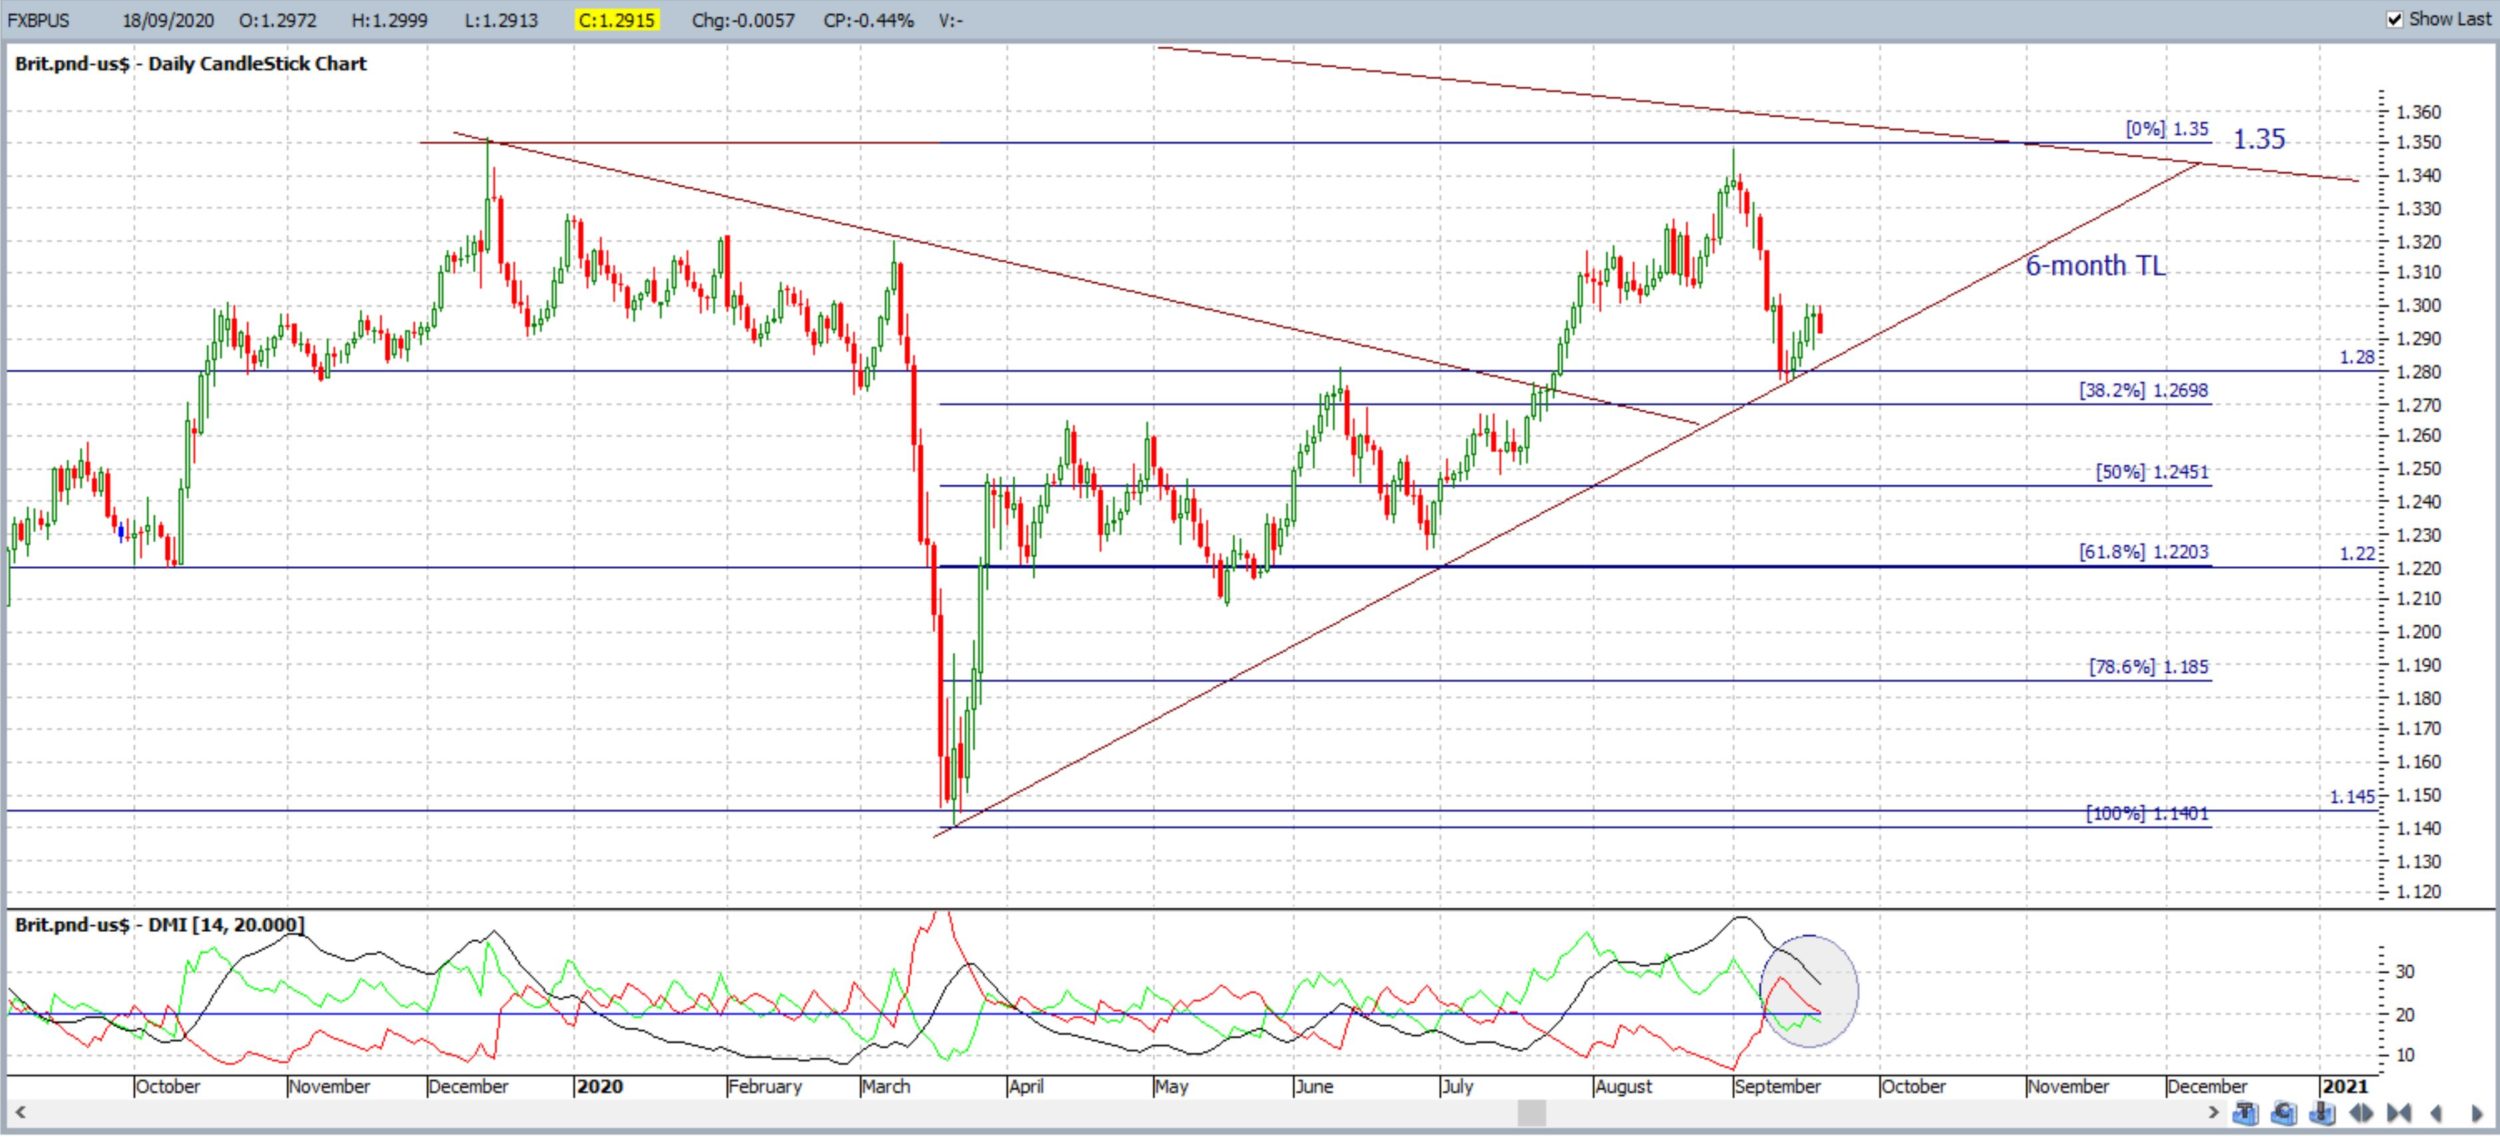
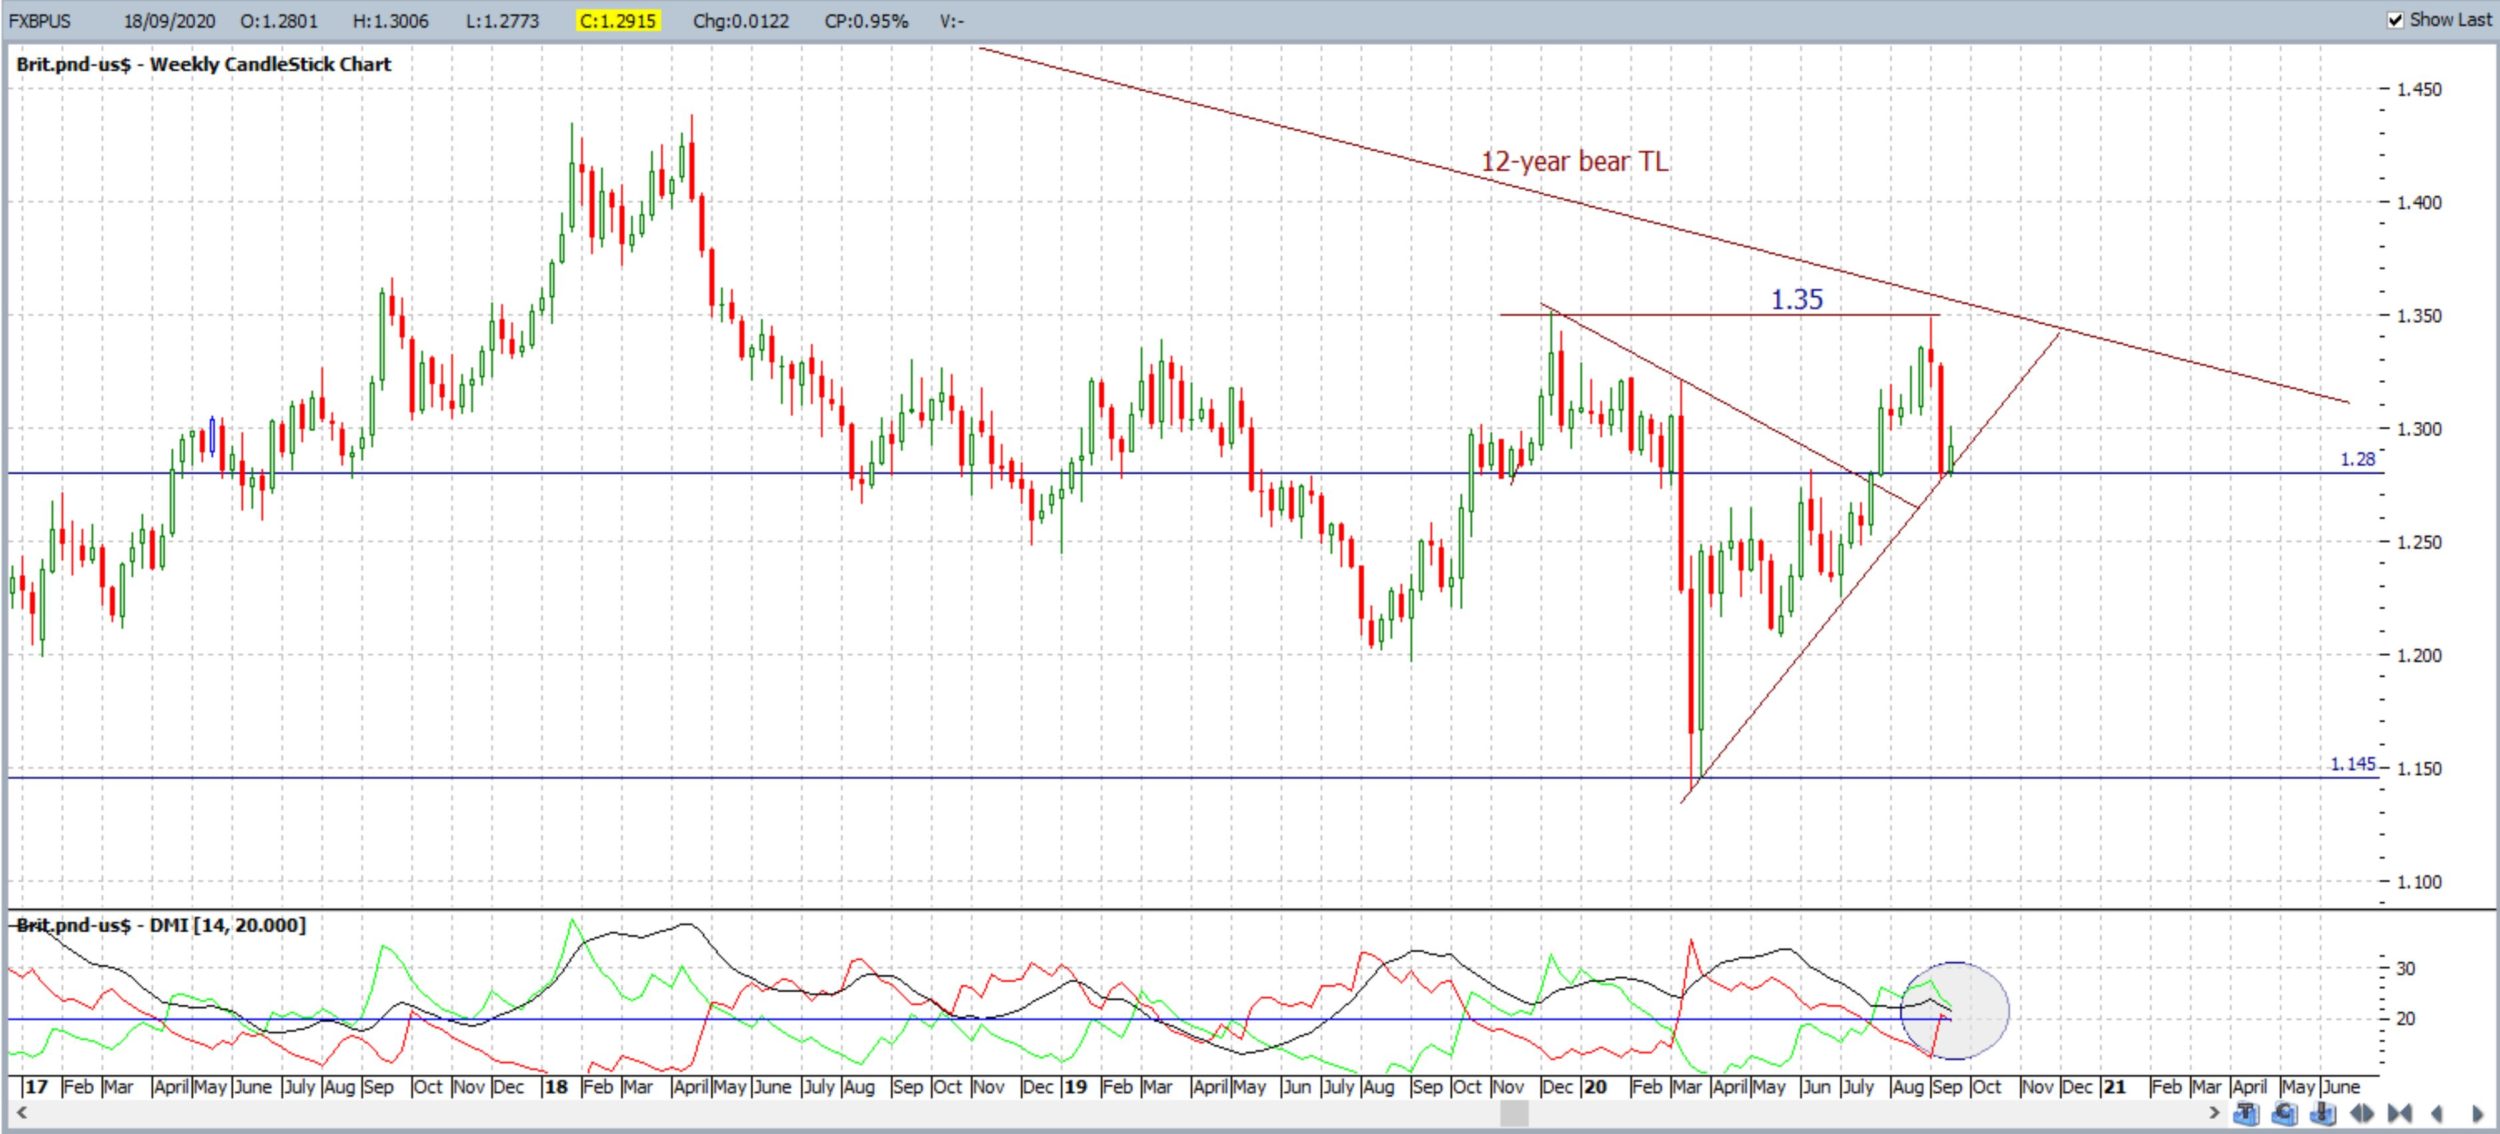
GBP/USD: The Cable closed with a small, bullish-coloured Inside weekly candle reflecting indecision following last week’s large fall. Brexit concern will likely continue to plague the GBP/USD and other GBP pairs but there are revised trend lines to monitor for any new momentum-based breakout.
Bullish targets: Any bullish 4hr chart triangle breakout would bring 1.32 back into focus as this remains near the 4hr chart’s 61.8% Fibonacci.
Bearish targets: Any bearish 4hr chart triangle breakout would bring the revised 6-month support trend line into focus followed by 1.28 S/R.
- Watch for any new 4hr chart triangle breakout:
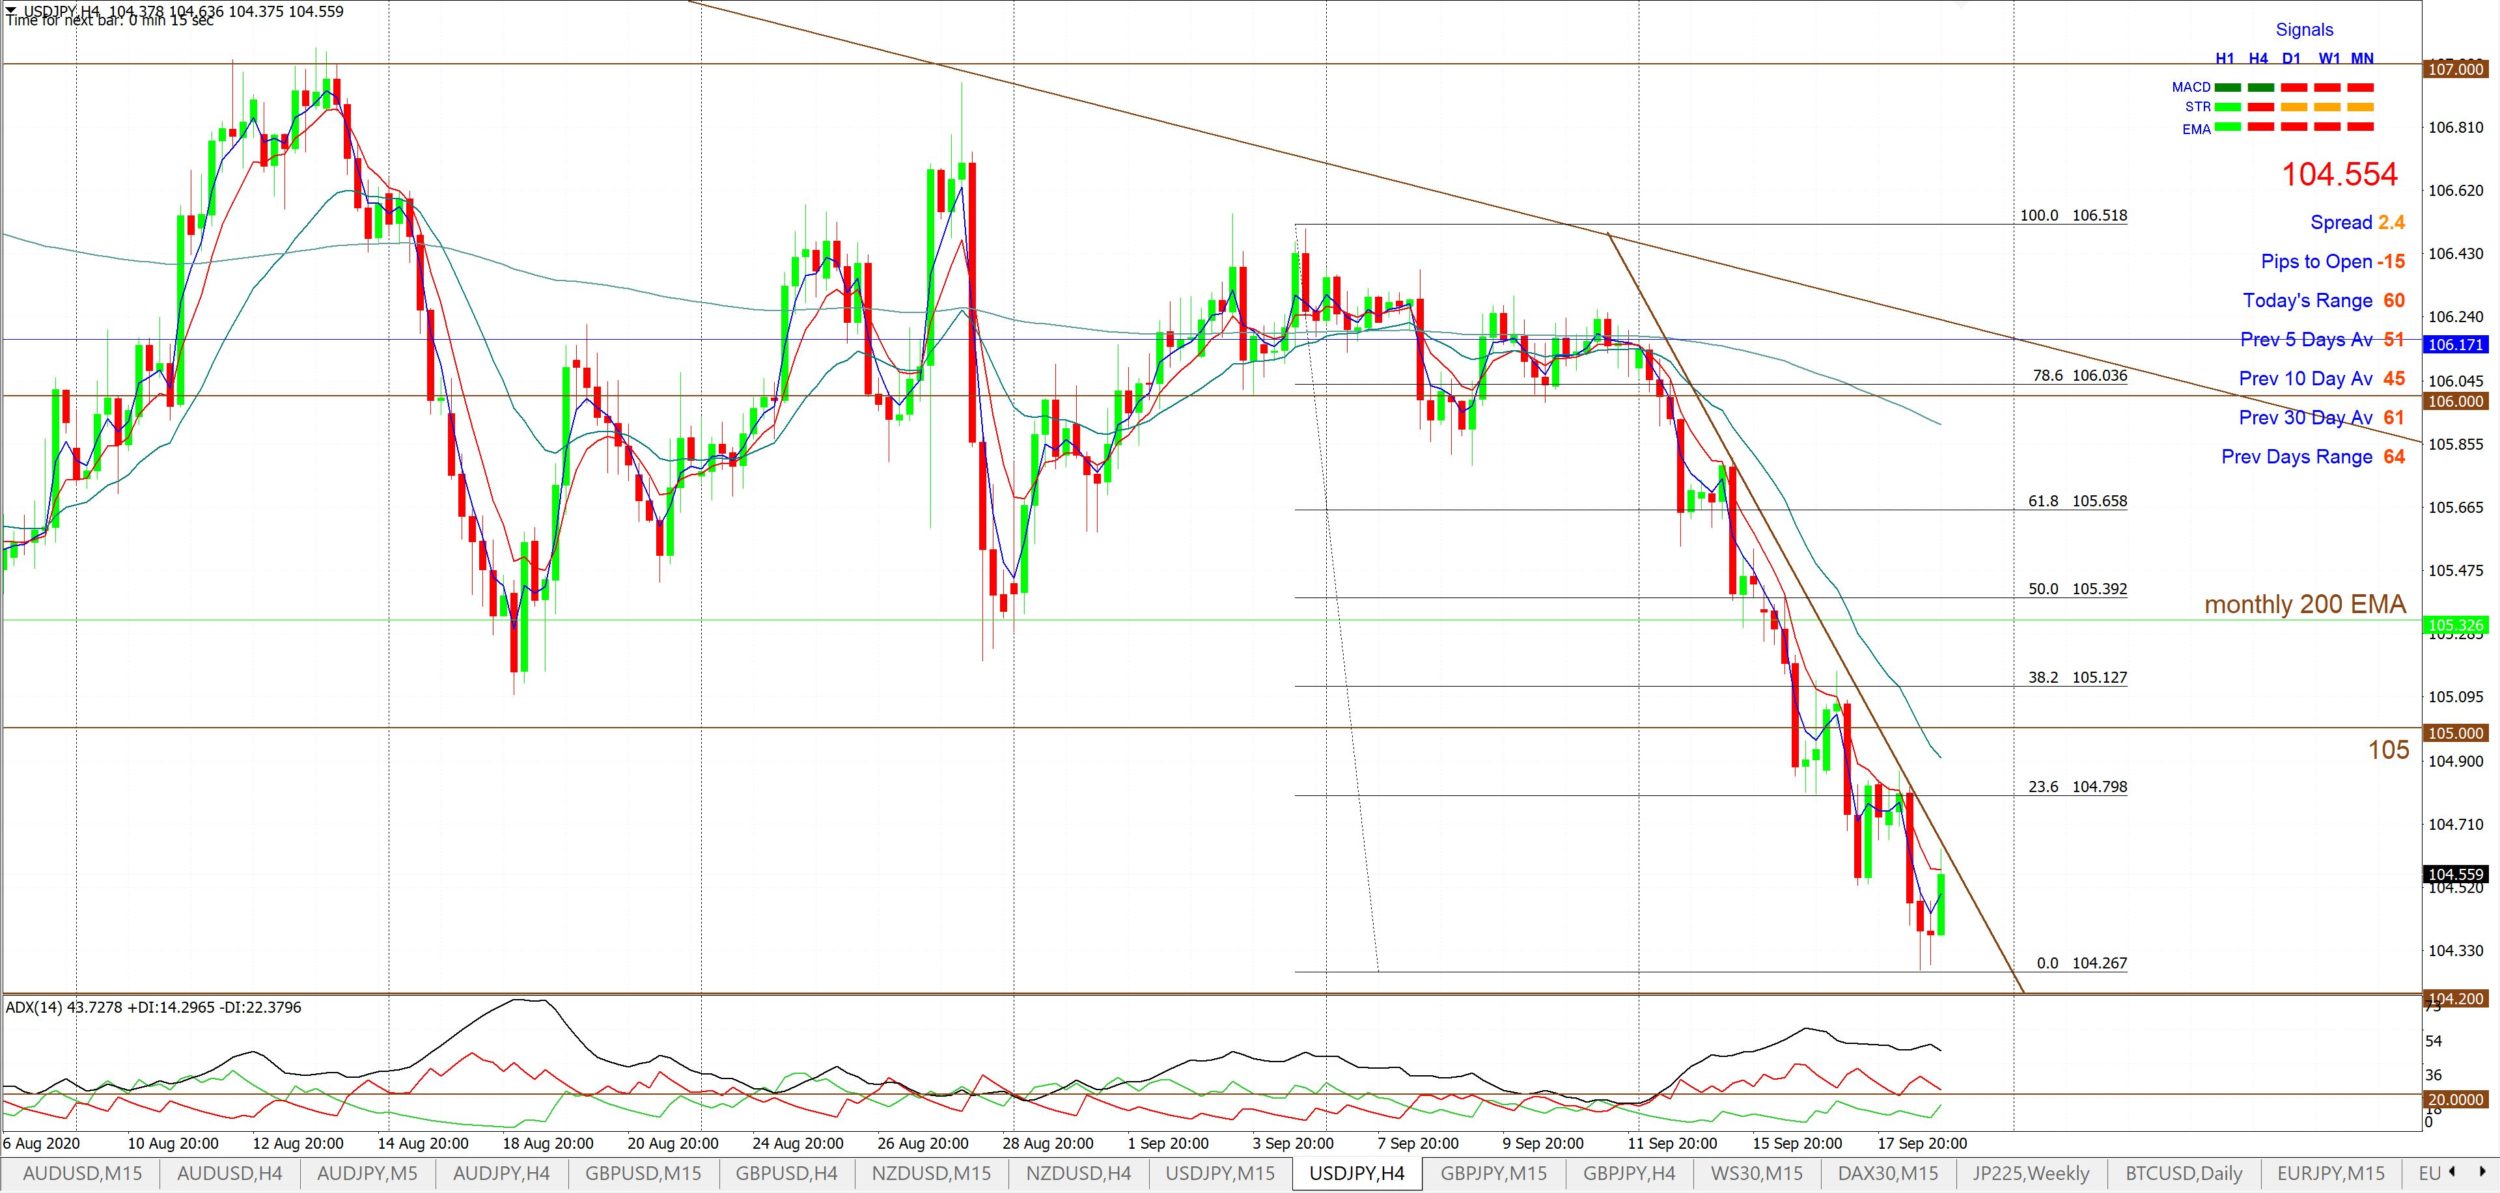
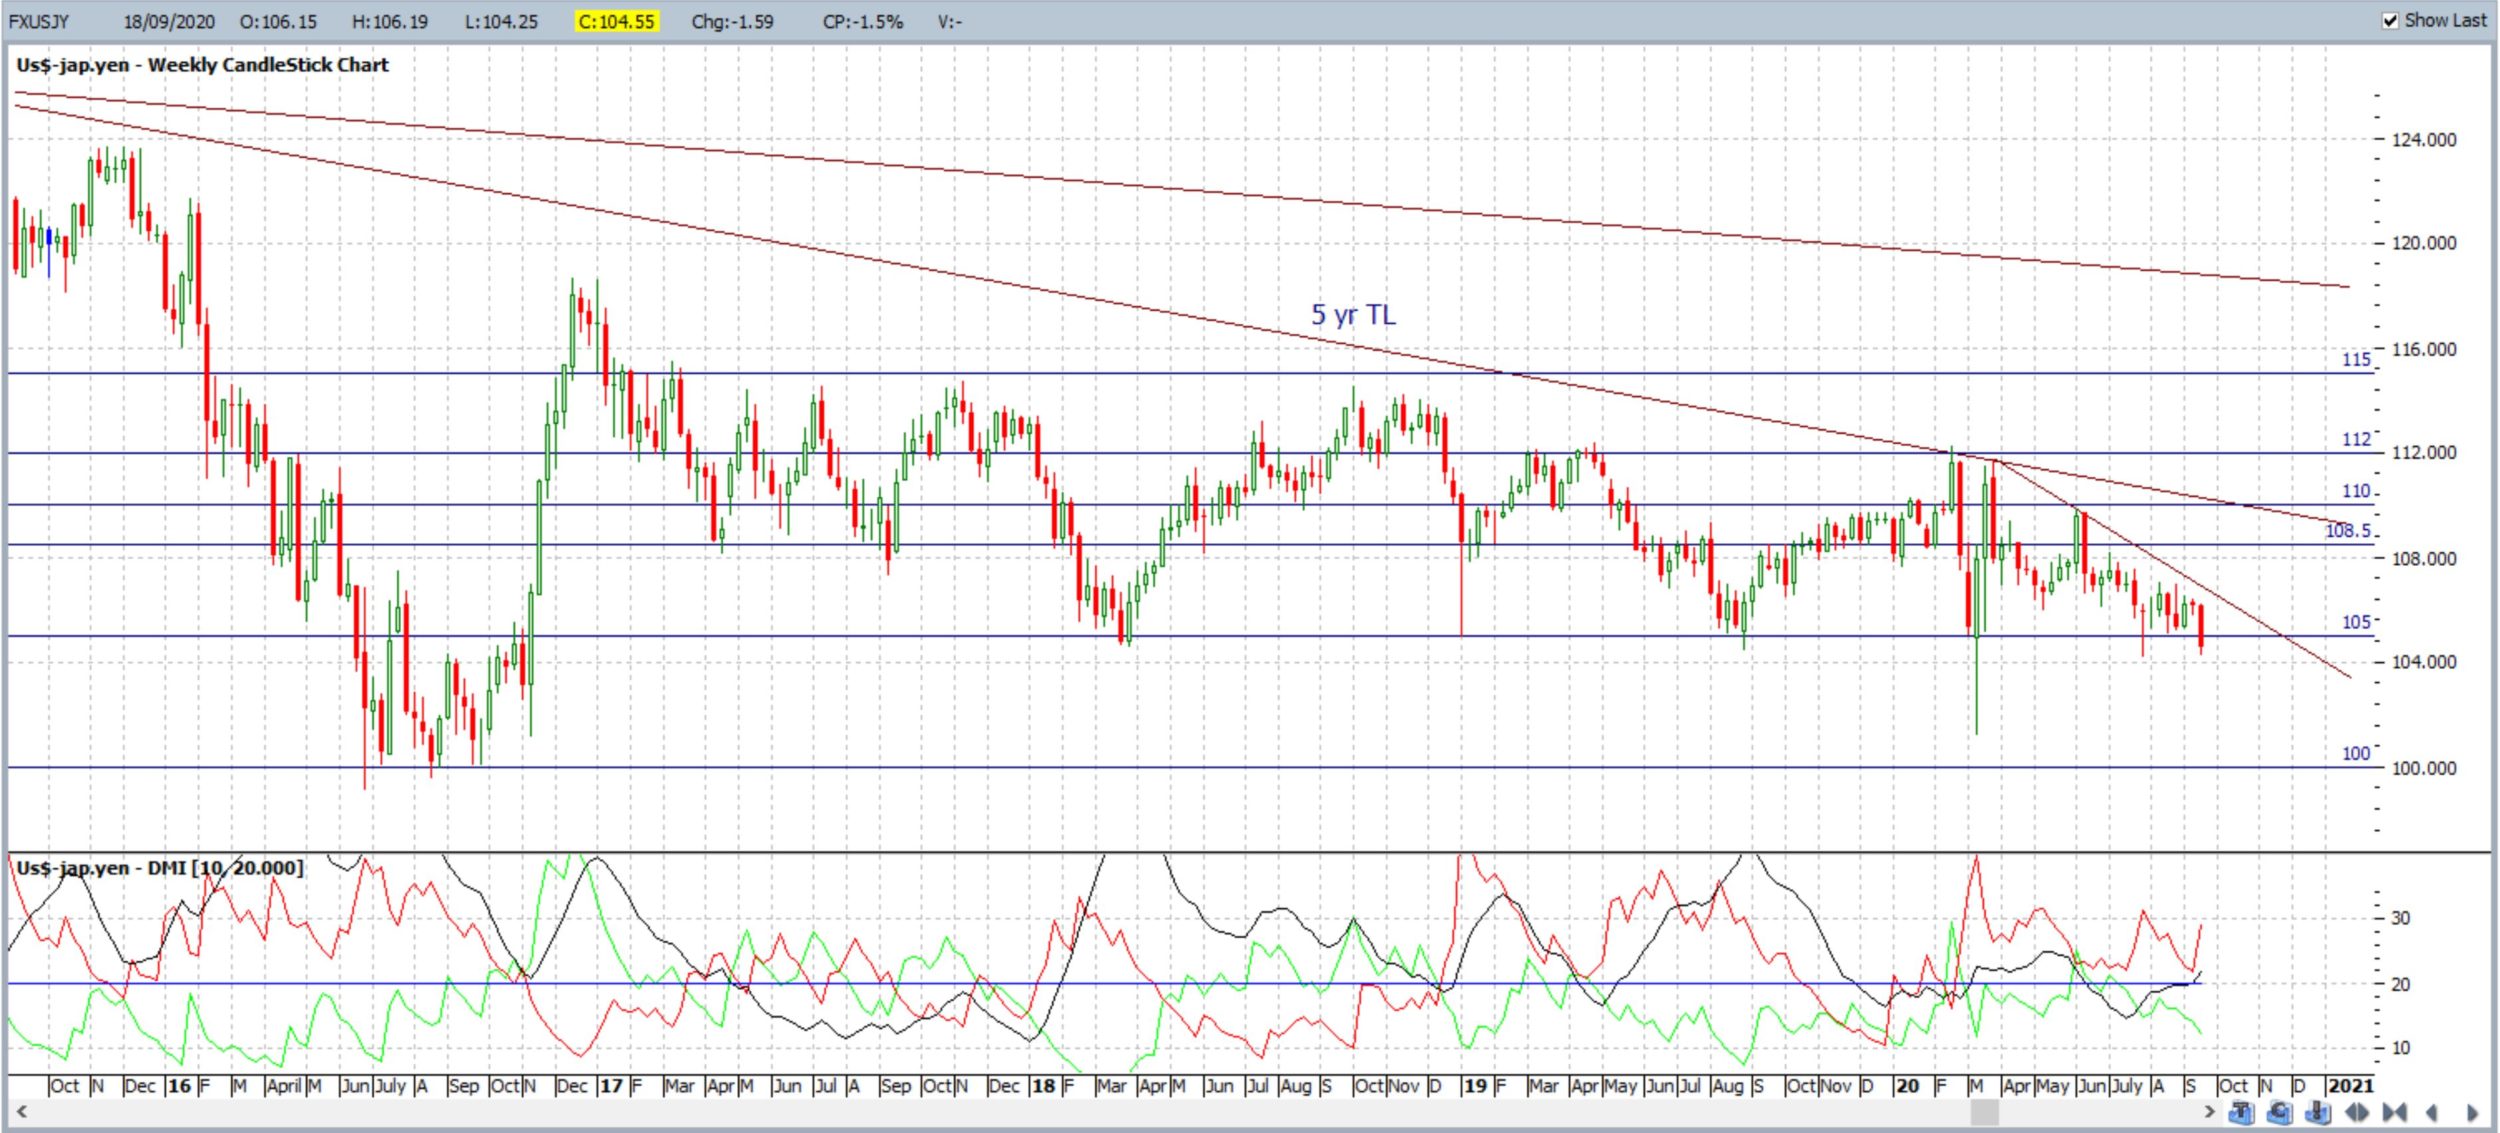
USD/JPY: The USD/JPY closed with a large bearish weekly candle and below the 105 level; the first weekly close below this level for just the second time in almost 4 years!
There are revised 4hr chart trend lines to monitor for any new breakout.
Bullish targets: Any bullish 4hr trend line breakout would bring 105 into focus followed by the monthly 200 EMA and, then, 105.5 as this is near the 4hr chart’s 61.8% Fibonacci.
Bearish targets: Any bearish 4hr trend line breakout below 104.20 would bring whole-number levels into focus on the way down to 100 S/R.
- Watch for any new 4hr chart trend line breakout:
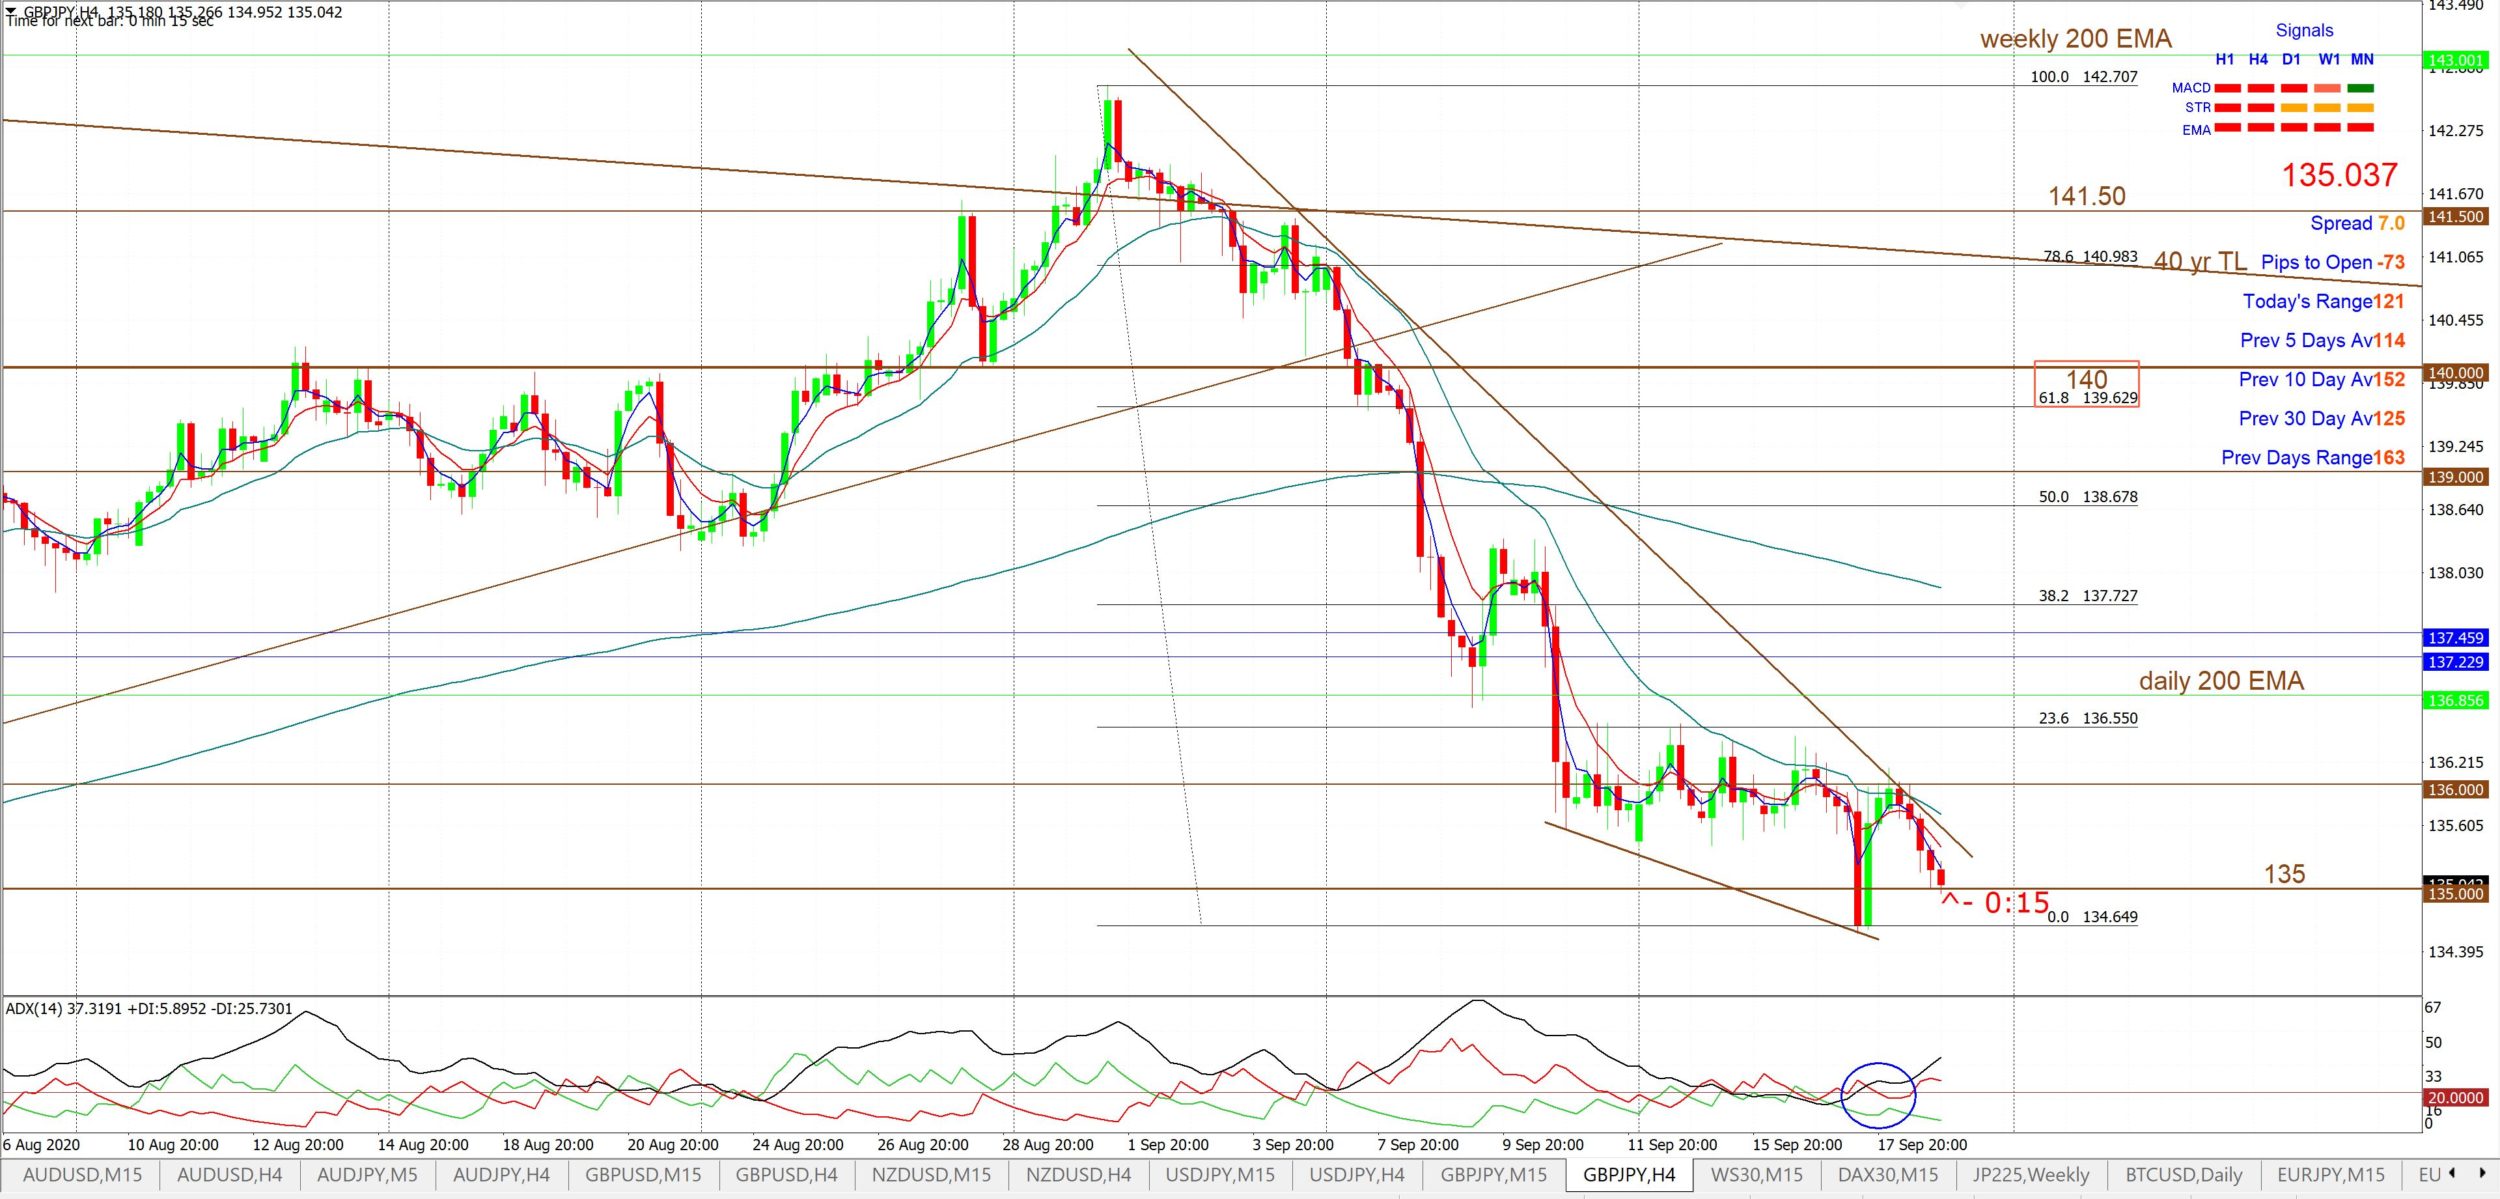
GBP/JPY: The GBP/JPY closed with a bearish-coloured Spinning Top but is still shaping up in a potential bullish reversal Descending Wedge on the 4hr chart time frame.
Bullish targets: Any bullish 4hr chart wedge breakout would bring whole-numbers on the way to 140 into focus as this is near the 4hr chart’s 61.8% Fibonacci.
Bearish targets: Any bearish 4hr wedge breakout would bring whole-numbers on the way down to 130 into focus.
- Watch for any 4hr chart wedge breakout:

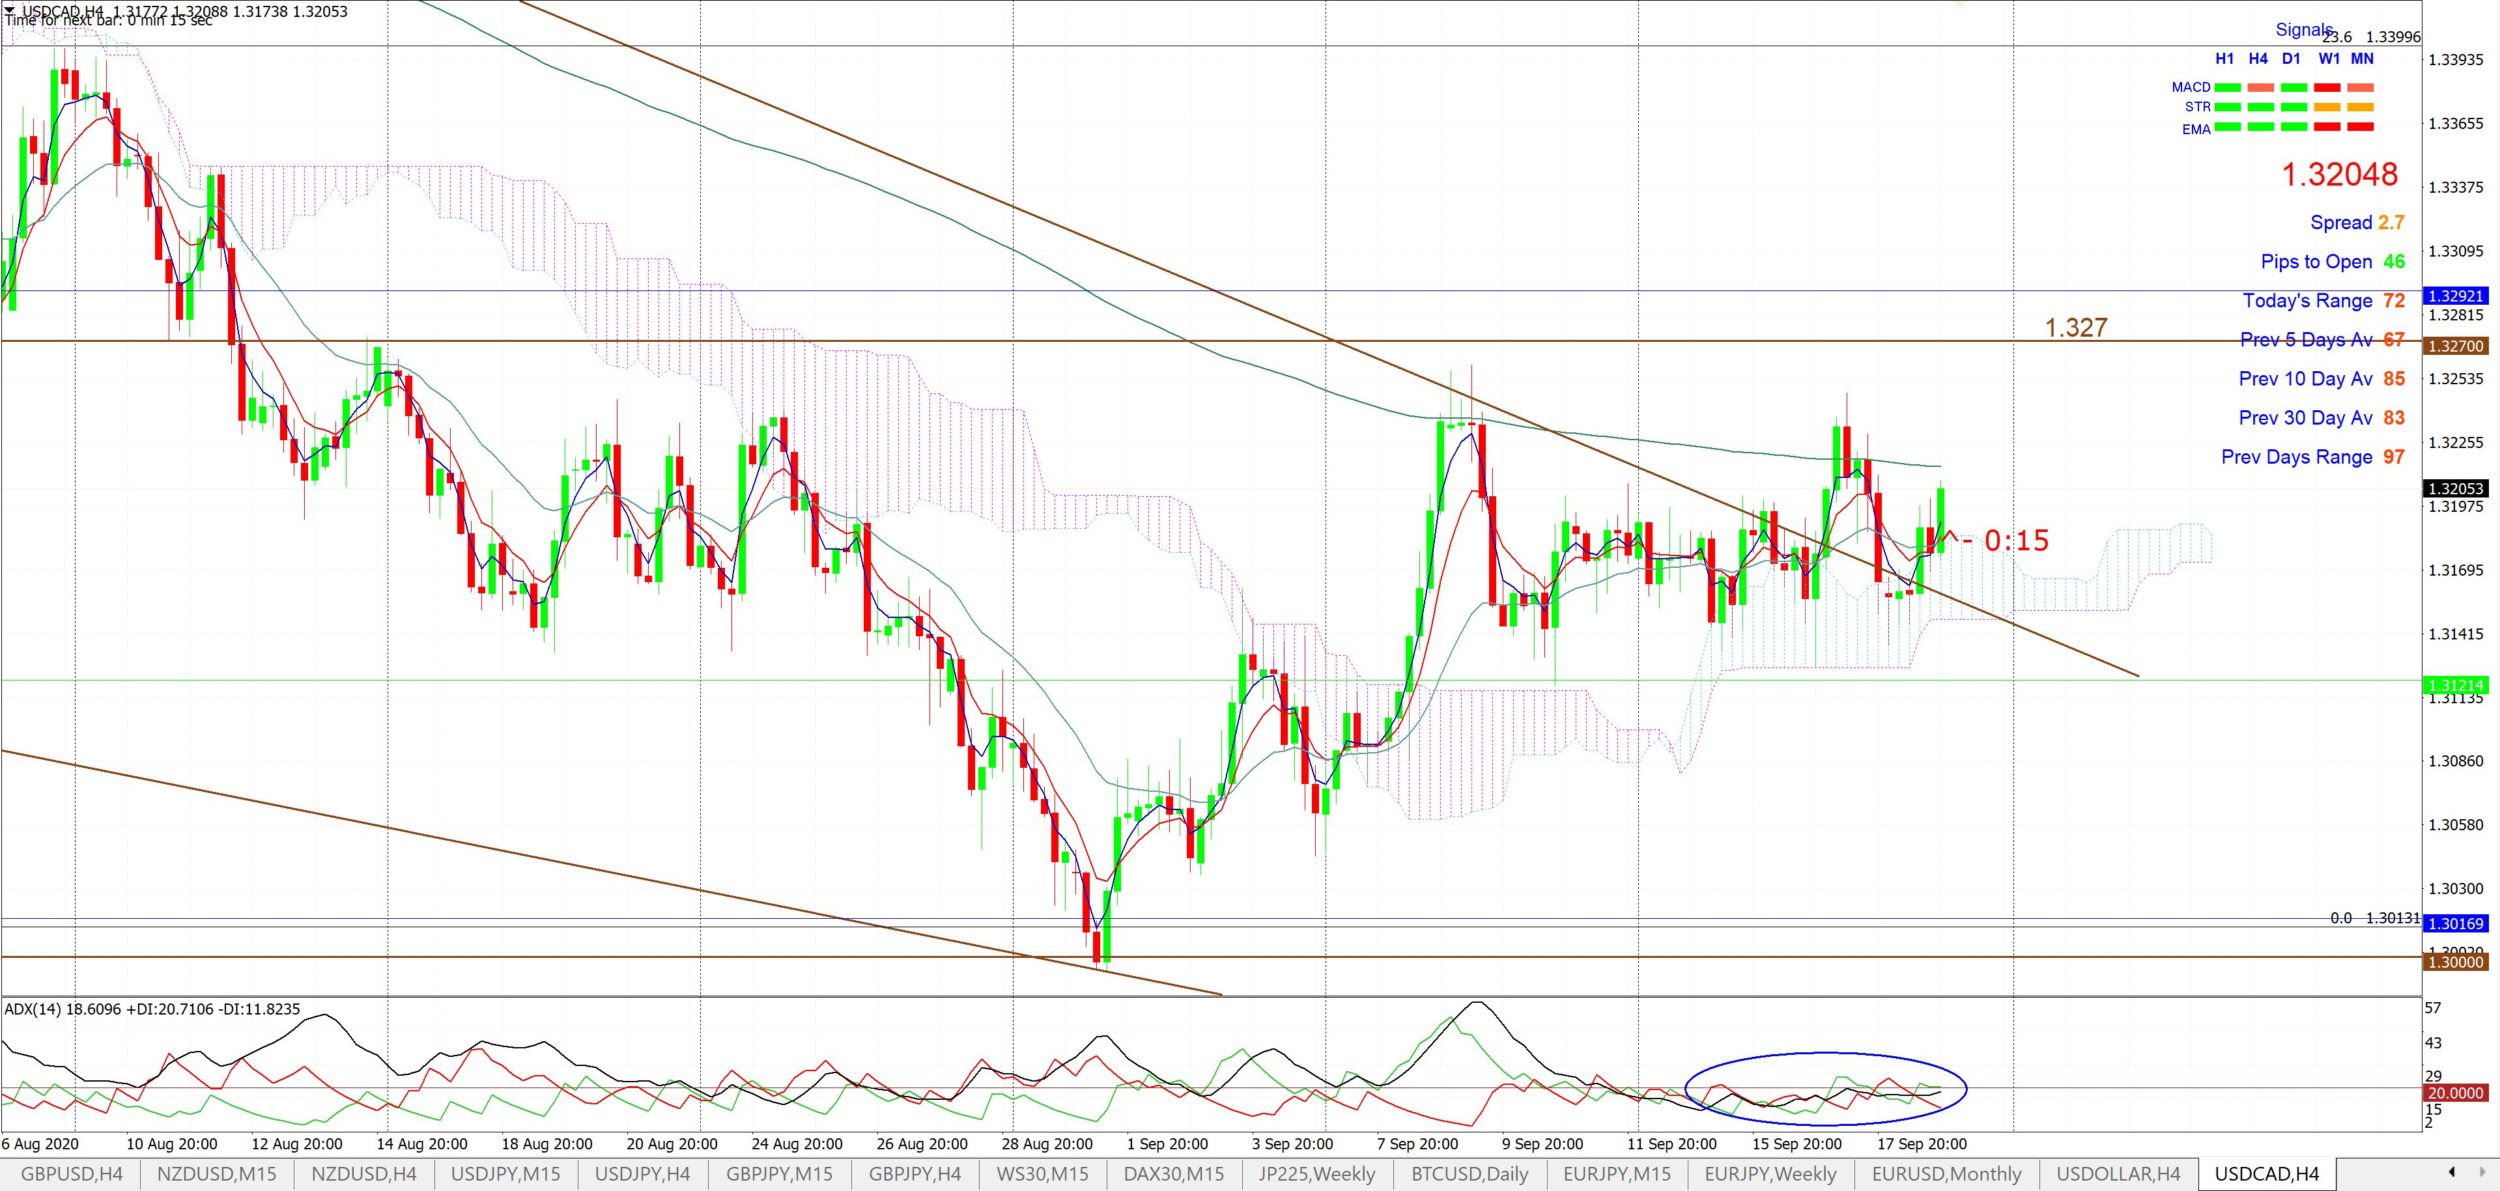
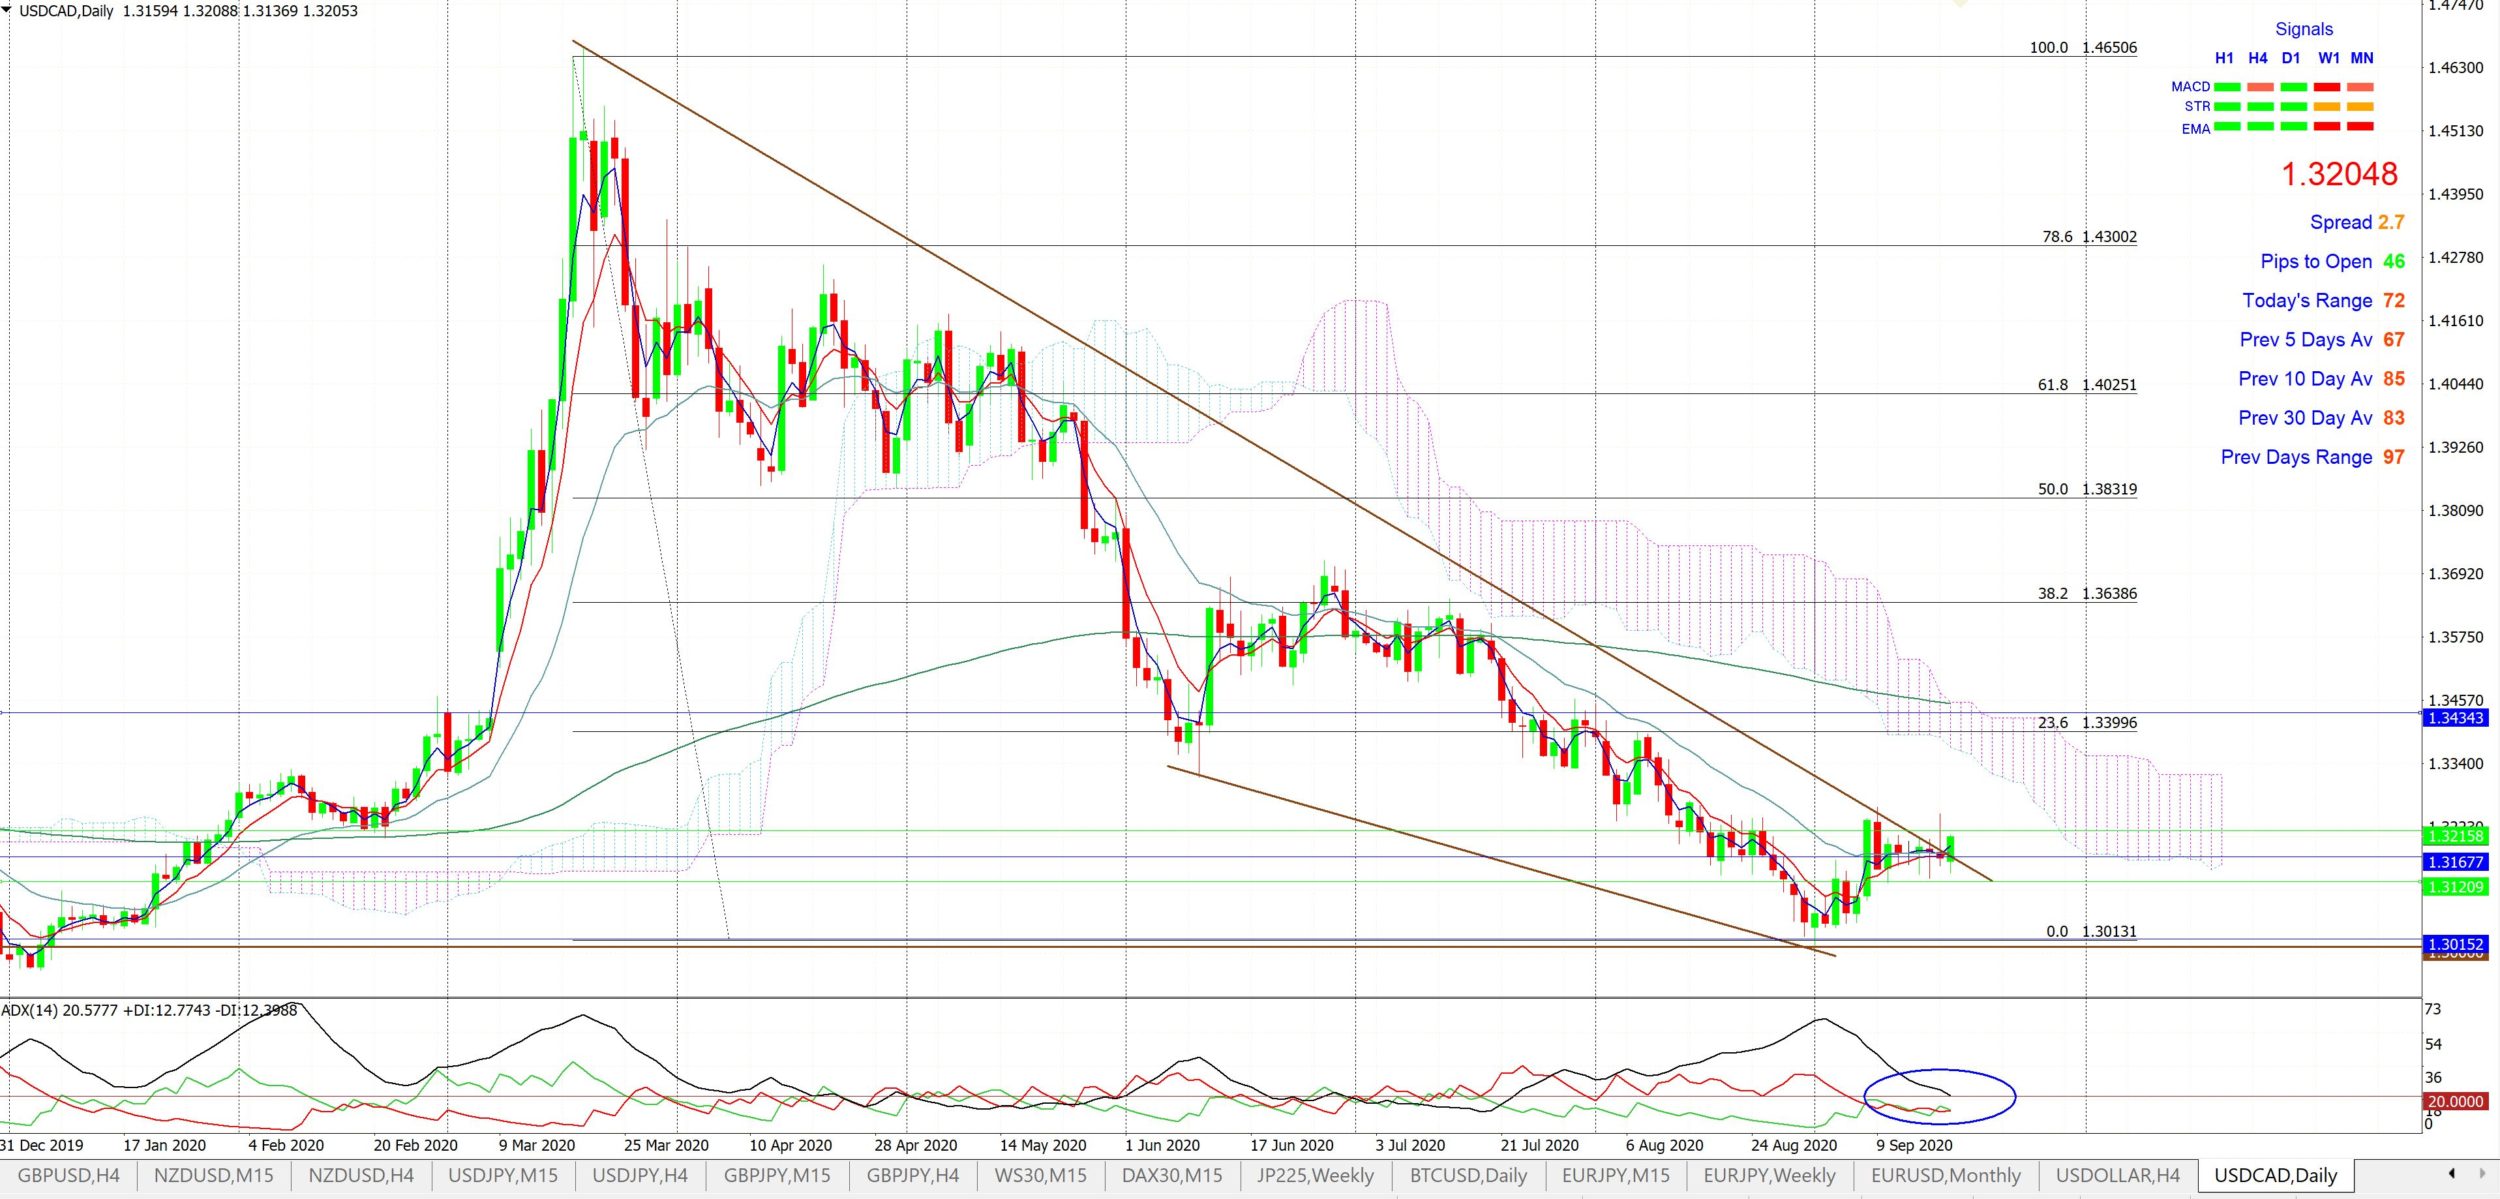
USD/CAD: The USD/CAD closed with a bullish-coloured Spinning Top weekly candle reflecting indecision as it continues to consolidate after a recent lengthy bearish move and as it holds above the key 1.30 level.
Price action looks to be attempting a bullish breakout from the bullish-reversal Descending Wedge BUT bullish momentum remains low on the 4hr, daily and weekly chart time frames for the time being so caution is needed interpreting this breakout move. The 1.327 level looks to be recent resistance that might be worth monitoring with any bullish continuation.
Bullish targets: Any developing bullish weekly chart wedge breakout above 1.327 would ultimately bring 1.40 into focus as this is near the weekly chart’s 61.8% Fibonacci.
Bearish targets: Any bearish weekly wedge breakout would bring whole-number levels on the way down 1.15 into focus as this is near the monthly chart’s 61.8% Fibonacci.
- Watch for momentum clues with any continued weekly chart wedge breakout above 1.327: