Last week: The heightened volatility and risk-off sentiment helped deliver a number of trend line breakout trades from charts profiled in my last weekend’s analysis. These include a 530 pip breakout move on the AUD/JPY, a 450 pip breakout move on the EUR/USD, a 300 pip breakout move on the GBP/JPY, a $9.50 breakout move on Crude and over 300 pips from the breakout move on the USD/JPY. I hope you all managed to catch, at least, some of this action! The Covid-19 situation is not improving for most countries outside of China yet and so there is no reason to think that this risk-off sentiment might abate BUT I do wonder if the broader markets might take a pause from the extreme volatility we have been seeing? The VIX index shows volatility near GFC highs and so there might be some digestion of this fact around that level, even if only temporarily. The path to recovery for the likes of Europe, Australia and the USA, to name just a few, looks to be a long way off yet so it seems there is a bit of a way until we reached the light at the end of the tunnel.
Technical Analysis: As noted over recent weeks, it is important to keep in mind that this analysis is Technical and chart-based but that any major Fundamental news items, as recently seen with Coronavirus, have the potential to quickly undermine identified chart patterns. This is why it is critical that traders appropriately manage their trade exposure and risk per trade.
Trend line breakouts and TC signals: There were quite a few trend line breakouts again last week. Articles published during the week can be found here, here, here and here:
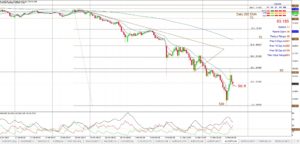
- AUD/JPY: a TL b/o from last weekend’s profiled triangle pattern that gave up to 530 pips before reversing:
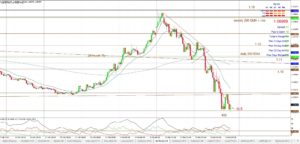
- EUR/USD: a TL b/o from last weekend’s profiled chart pattern that gave around 450 pips:
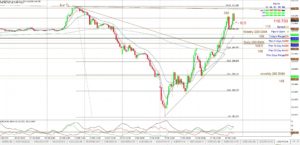
- USD/JPY: a TL b/o from last week’s 108 focus and a mid-week profiled triangle pattern that gave around 350 pips:
- ASX-200: a TL b/o for 45 points.
- S&P500: a TL b/o for 200 points.
- Oil a TL b/o from last weekends profiled chart pattern for $9.50.
- GBP/JPY: a TL b/o from a last week’s profiled triangle pattern that gave over 300 pips.
- Gold: a TL b/o move for $35.
This Week: (click on images to enlarge):
-
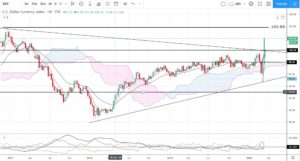
- DXY: US$ Index: The US$ index closed with a bullish weekly candle but under the 103.80 resistance level so watch this for any new make or break:
DXY weekly:
-
- Virus warning 2015: This Bill Gates TED talk, from back in 2015, warned about the potential for a serious viral breakout. It’s a pity more notice wasn’t taken at the time
- Virus warning 2015: This Bill Gates TED talk, from back in 2015, warned about the potential for a serious viral breakout. It’s a pity more notice wasn’t taken at the time
-
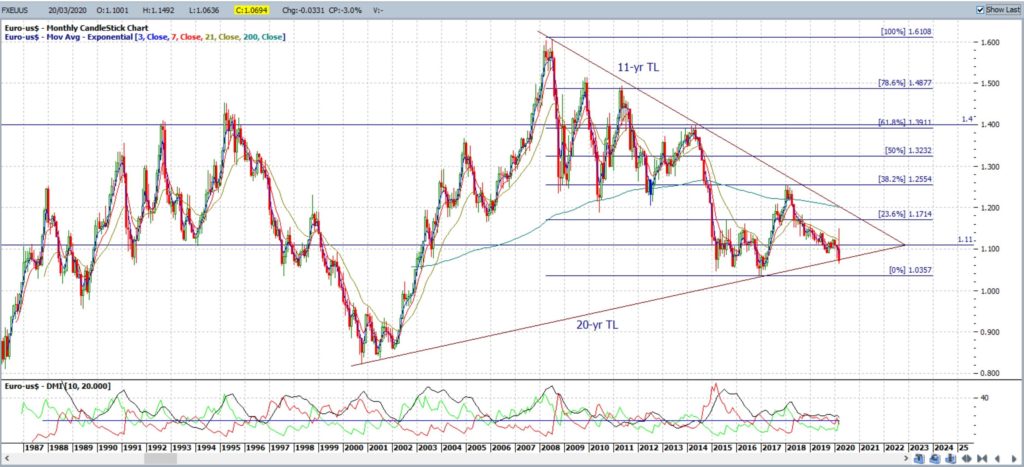
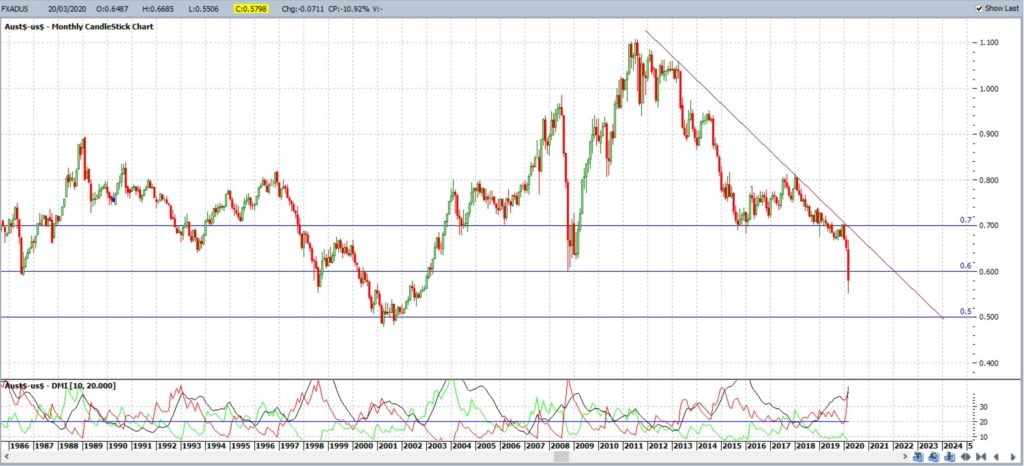
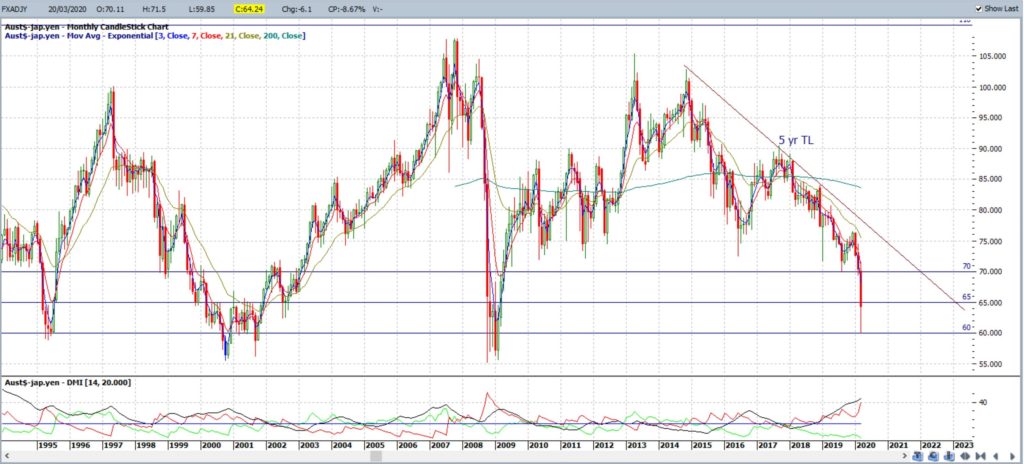
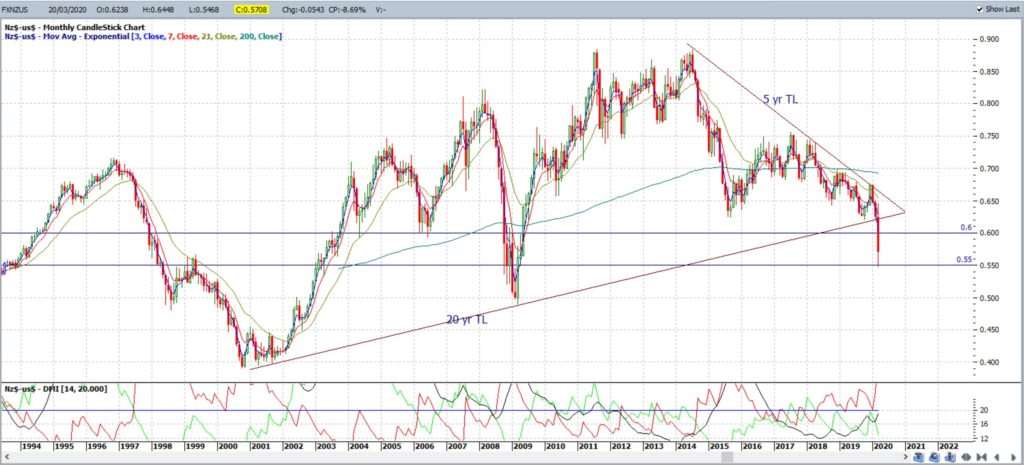
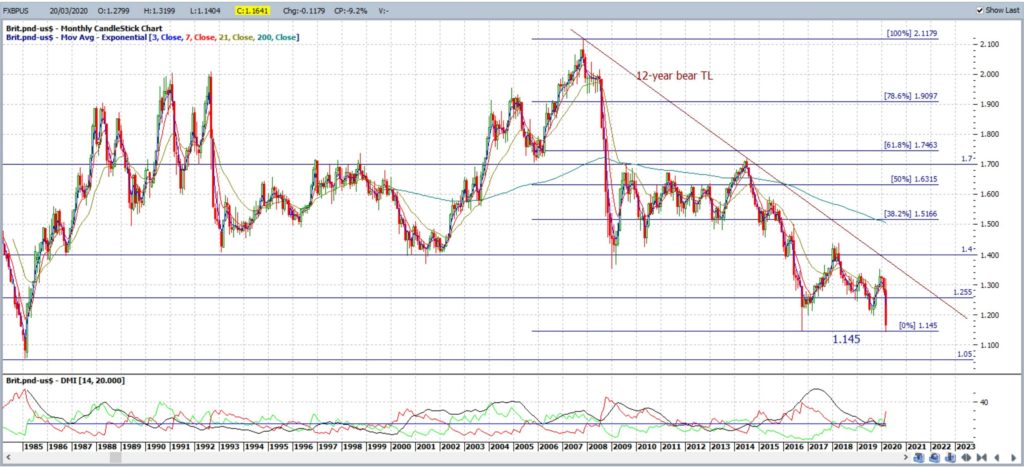
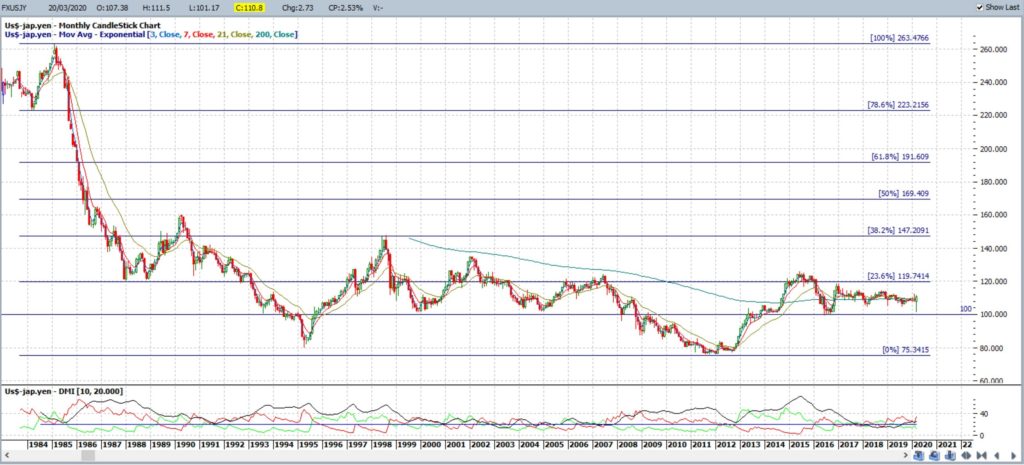
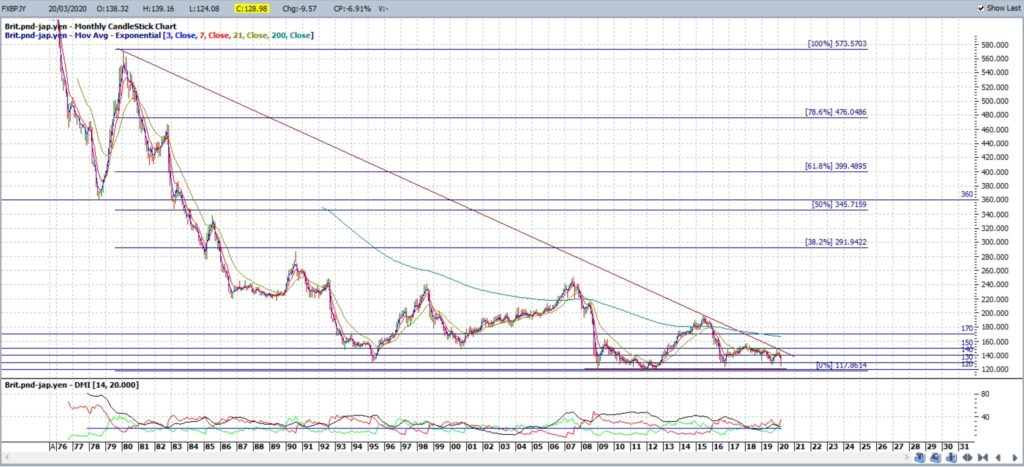
- Monthly charts: The FOREX moves on most pairs have been so extreme I have had to include monthly charts so as to best describe the nearby S/R levels.
-
- ASX-200: The ASX-200 index has pulled back to a major support level and I wrote a separate article on my perspective that can be found through this link.
-
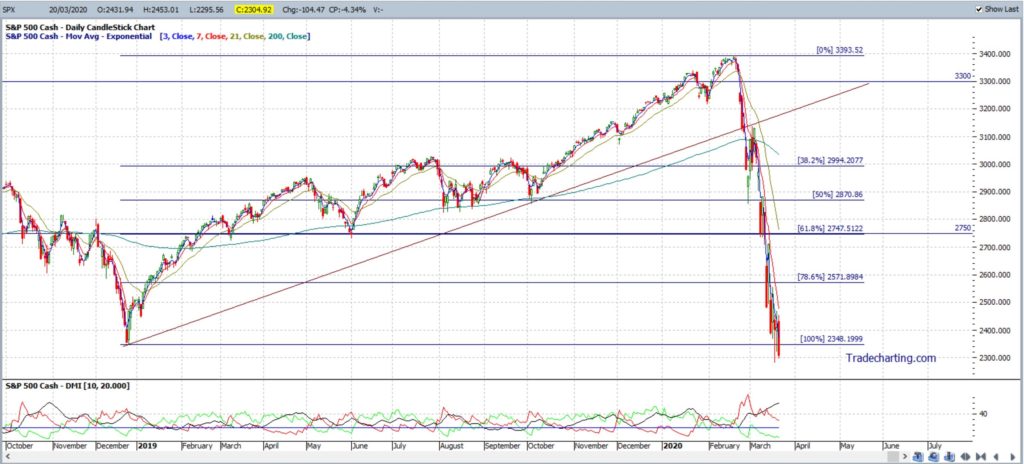
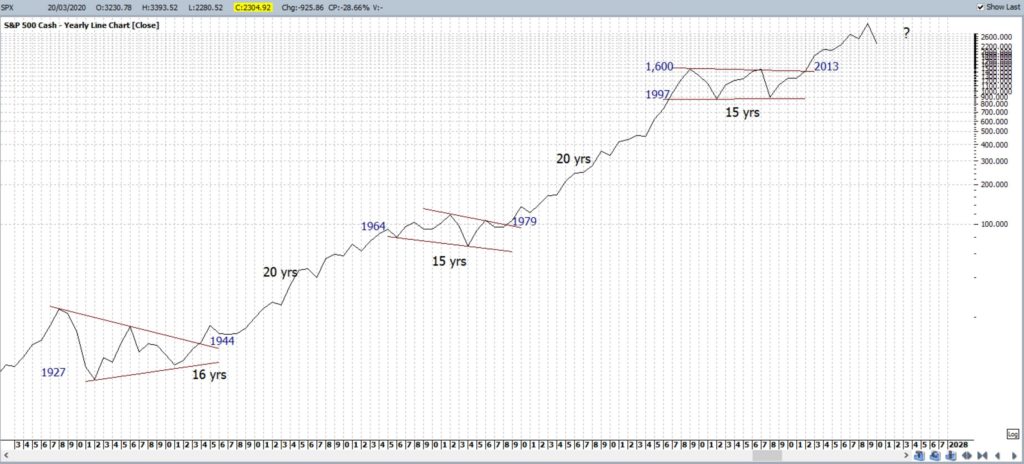
- S&P500: Keep the bigger picture in perspective with this pullback:
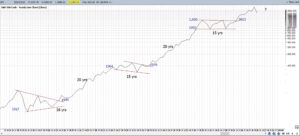
S&P500 yearly: keep this latest move lower in perspective:
-
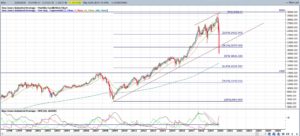
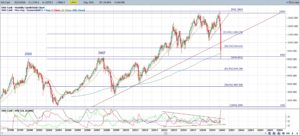
- DJIA monthly: The DJIA is currently trading below the 2019-2020 support trend line. The Index is below the 38.2% fib but, if weakness continues, watch for any push to the monthly 50% and 61.8% fib levels.
DJIA monthly:
-
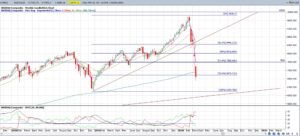
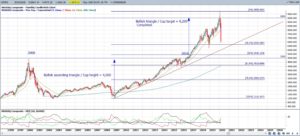
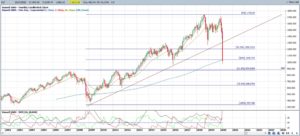
- NASDAQ composite: gapped at market open to close lower with a bearish weekly candle and below the weekly 61.8% fib. Watch the next, monthly-chart support trend line for any new make or break. Any break of the monthly support trend line would bring the 5,200 level into focus. This is the upper level of the previous channel breakout and near the 61.8% fib of 2009-2020 swing High move. There is much talk of the US stock market decline but note how the NASDAQ has only retreated by around 35% at this stage (see monthly chart):
NASDAQ weekly:
NASDAQ monthly:
-
- DAX monthly: The DAX is currently trading below the 2019-2020 support trend line and note the test of the key 8,300 S/R level near the monthly 50% fib. This is a major S/R level but, if weakness continues, watch for any push to the monthly 61.8% fib.
DAX monthly:
-
- Russell-2000: The Russell-2000 is often viewed as the ‘Canary in the Coal Mine’ for US stocks. The Index is currently trading below the 2019-2020 support trend line and has reached down to the whole-number 1,000 level and the 50% fib. Watch for any push to the key 880 level, near the monthly 61.8% fib, if weakness continues.
RUT monthly:
-
- Bonds / TLT: The Bonds ETF, TLT, closed with an indecision Long Legged Doji weekly candle. Note the hold above the support trend line:
TLT weekly:
-
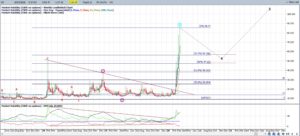
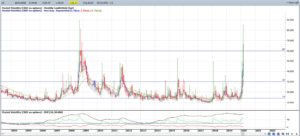
- VIX: the Fear index closed with a bullish weekly candle but, again, well of its High. Keep watch for any test of the 2008 GFC high, near 90 as price is getting very close to this key level:
VIX weekly: note how the Elliott Wave tool on my software is suggesting a pullback!
VIX monthly: the Index is currently trading just below the 2008 GFC High, circa 90:
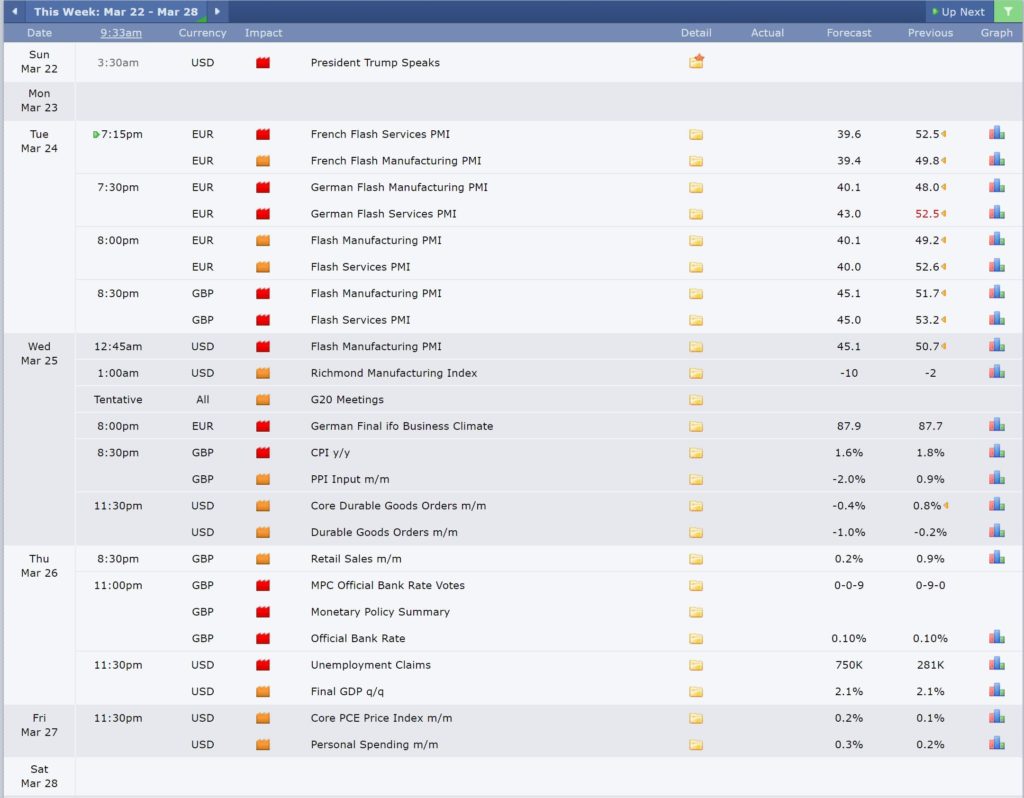
Calendar: Courtesy of Forex Factory:
Earnings: Courtesy of Earnings Whispers:
Markets:
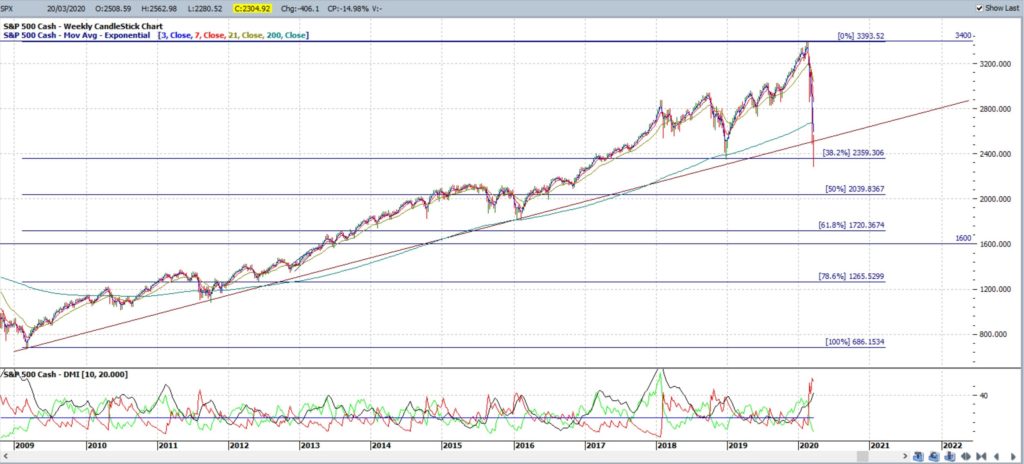
S&P500: SPX: The S&P500 gapped lower to start the week and closed with a large, bearish weekly candle and below the 2009-2020 support trend line.
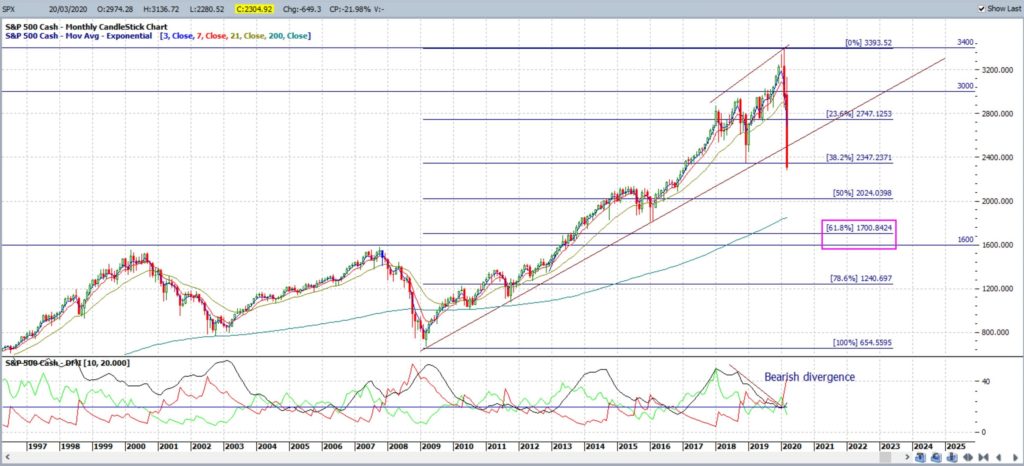
The break and close below this support trend line has brought the 61.8% Fibonacci of this 2009-2020 swing High move into greater focus and this level is down near 1,700 / 1.600. This is a region of some confluence as it is the previous upper level from the 2013 channel breakout; a region noted on the yearly and monthly charts. The 61.8% Fibonacci zone was also tested in the 1987 and GFC market pullbacks, as described in this post. For the moment though, the index has only pulled back around 40% so keep this move in perspective as technical theory would suggest the uptrend is intact until the 61.8% fib is broken!
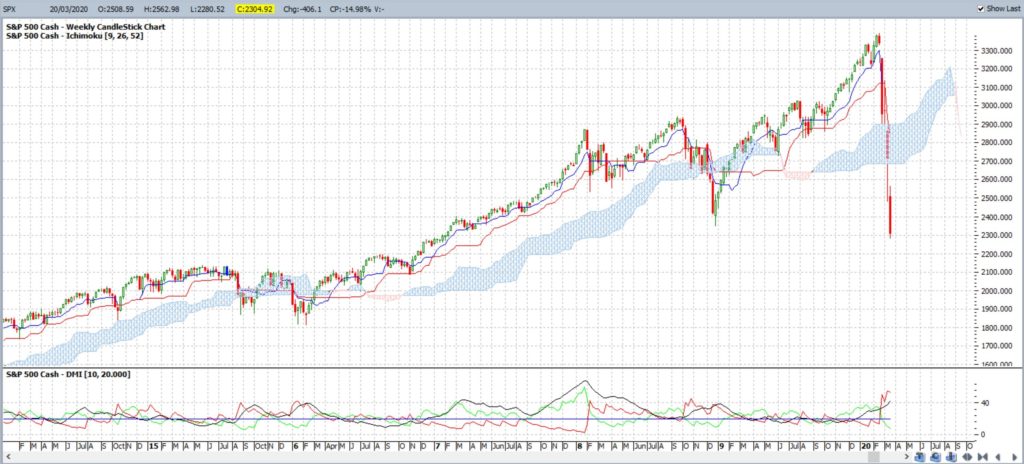
Price action has closed below the weekly Ichimoku Cloud; a level I had warned about in this recent article.
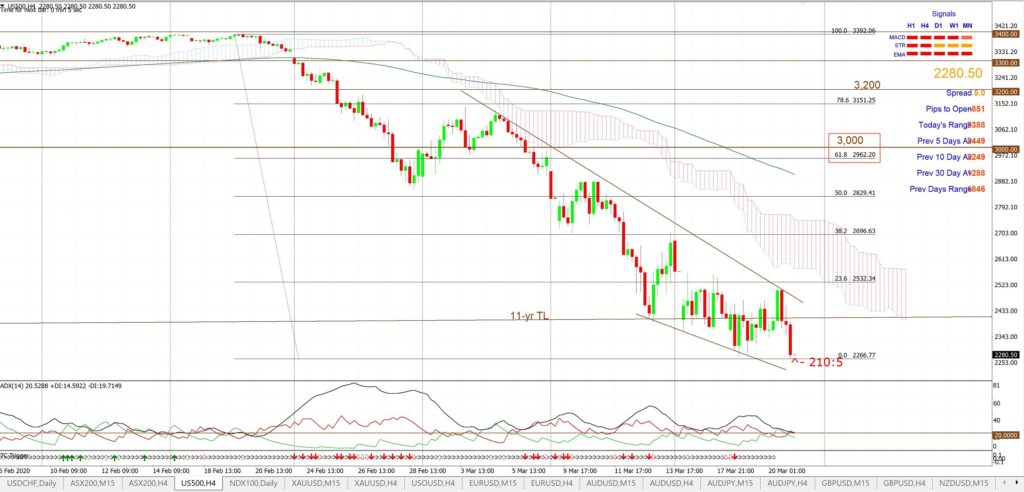
The 4hr chart pattern has a bit of a Descending Wedge appearance so watch these trend lines for any new breakout.
Bullish targets: any bullish 4hr chart wedge breakout would bring 3,000 into focus as this is near the 4hr chart’s 61.8% fib.
Bearish targets: any bearish 4hr chart wedge breakout would bring whole-numbers on the way down to 1,700 S/R into focus.
- Watch for any 4hr chart wedge breakout:
ASX-200: XJO: My review of the ASX-200 can be found through this link.
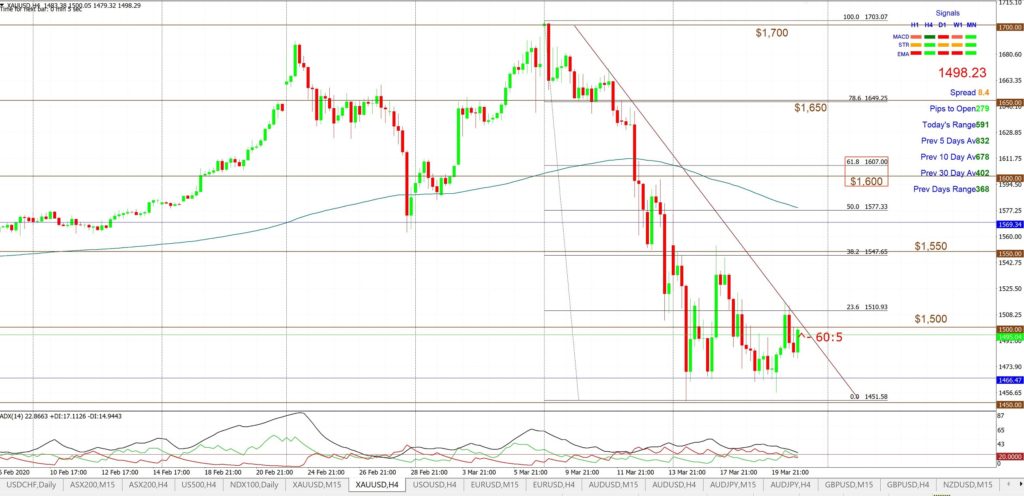
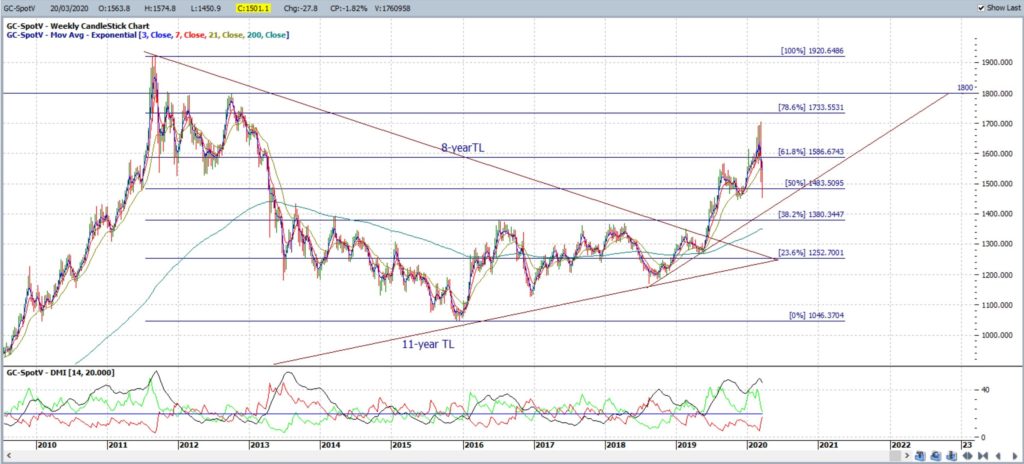
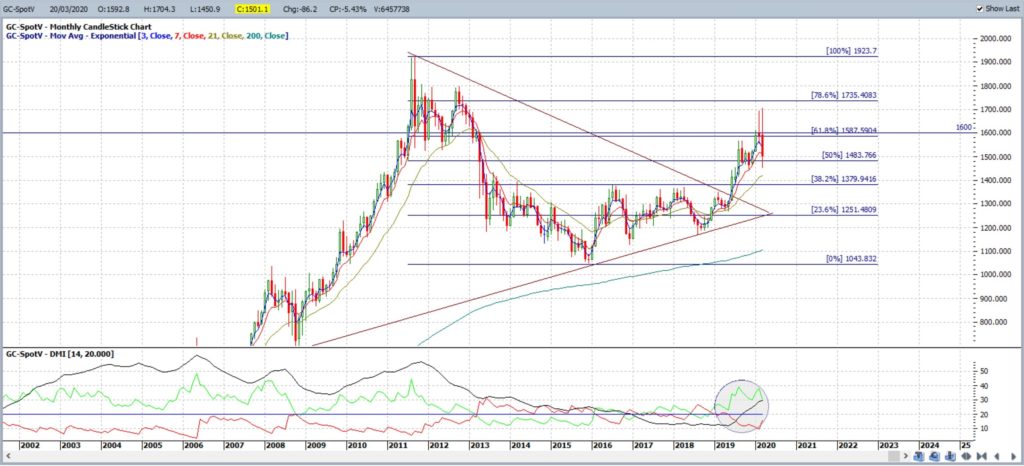
Gold: Gold closed with a bearish weekly candle and managed to hold near $1,500 making this the level to watch for any new make or break.
The weekly chart shows the metal has struggled to break clear from the weekly 61.8% fib near $1,600 but, for the time being, is holding above a weekly support trend line.
Price action was rather choppy and this has set up some 4hr chart trend lines to monitor for any new breakout.
Bullish targets: any bullish triangle breakout would bring $1,550 S/R followed by the 4hr chart’s 61.8% fib, near $1.600 S/R, into focus.
Bearish targets: any bearish triangle breakout would bring the weekly support trend line, near $1,400, into focus.
- Watch for any new 4hr chart trend line breakout:
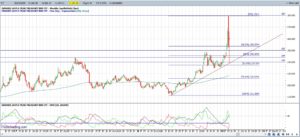
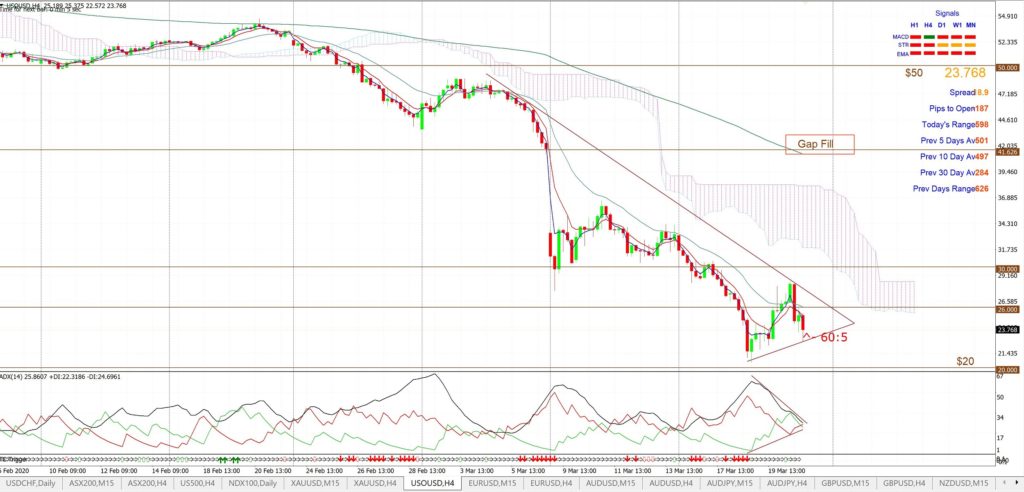
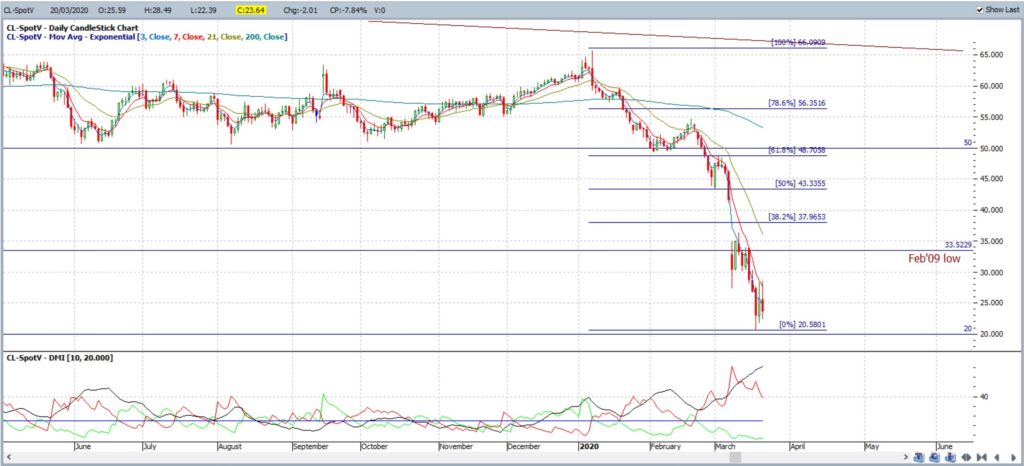
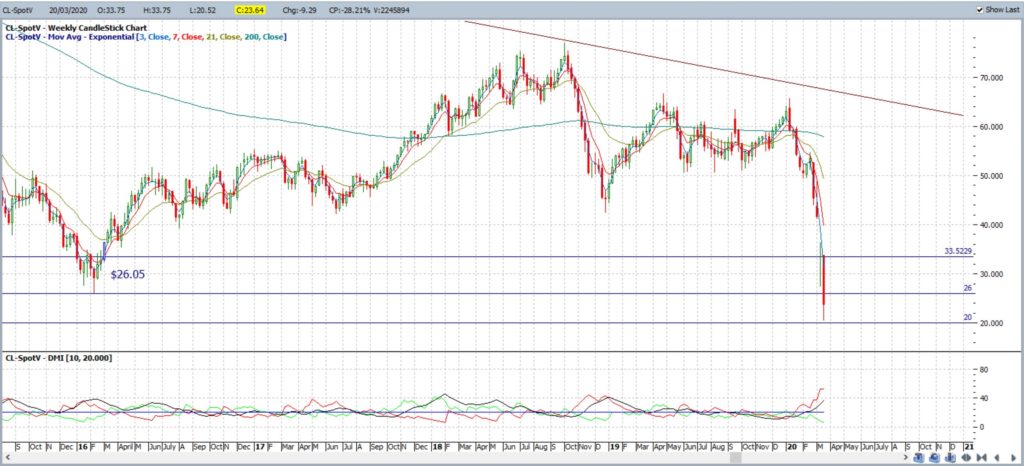
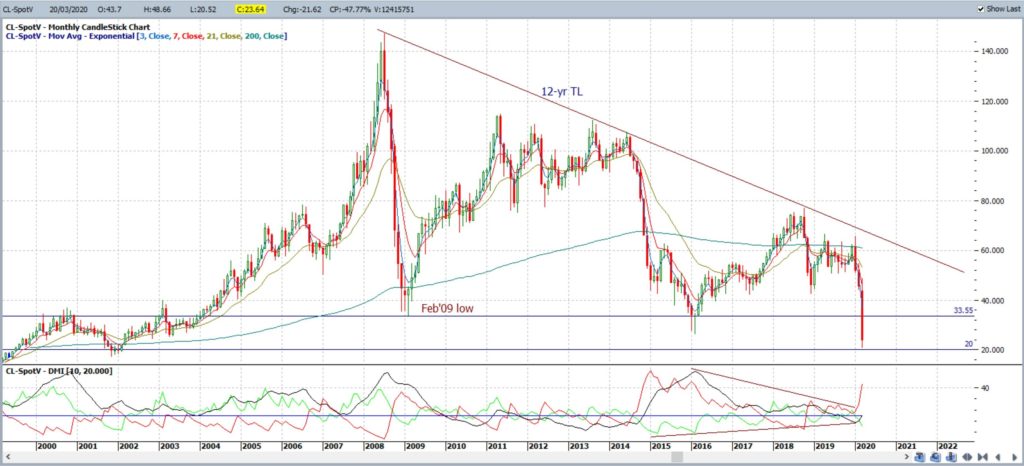
Oil: Oil closed with a large, bearish weekly candle and price dropped down to $20 Lows not seen since early 2002 making this the level to watch for any new make or break.
There was a great 4hr chart triangle breakout last week that gave over $9 so watch the revised trend lines for any new momentum breakout.
Bullish targets: any bullish 4hr chart triangle breakout would bring $30 S/R into focus followed by the $42 region as the latter represents the gap fill from the previous weekly close.
Bearish targets: any bearish 4hr chart triangle breakout would bring $20 S/R back into focus.
- Watch the 4hr chart triangle trend lines for any new breakout:
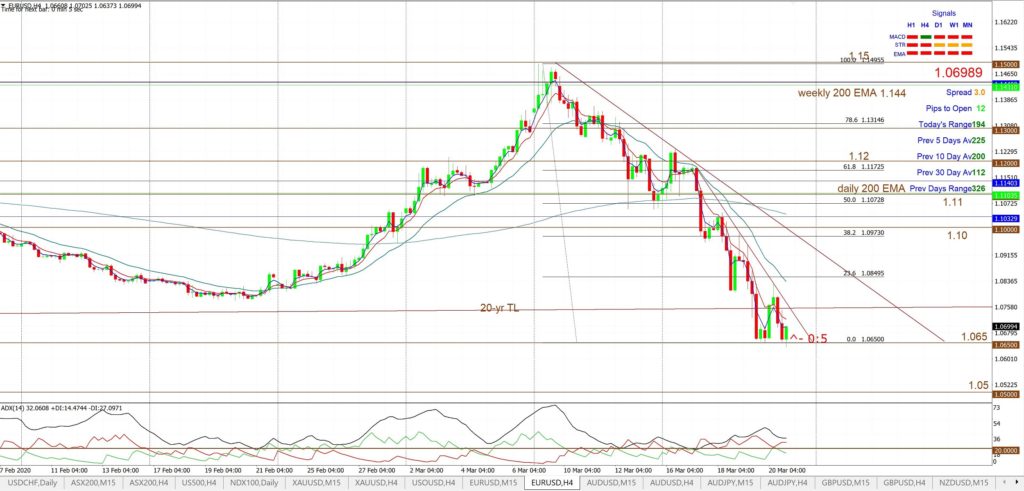
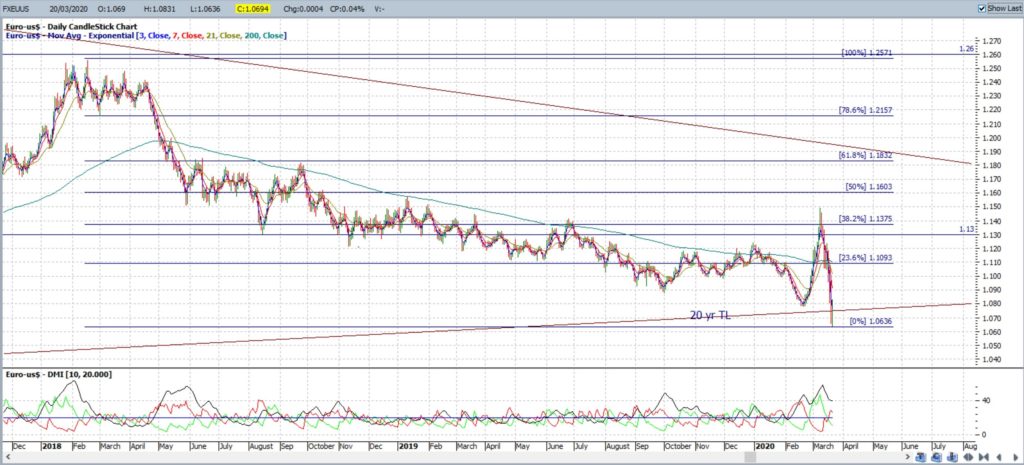
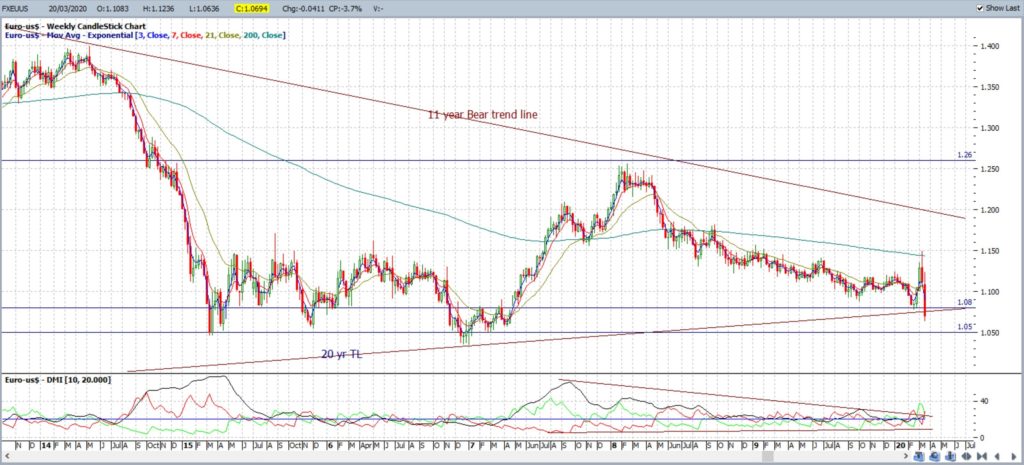
EUR/USD: The EUR/USD closed with a large, bearish weekly candle, below a 20-year support trend line and down near levels not seen since early 2017. This move lower gave a great trend line breakout trade worth over 450 pips but I am wondering if there might be a pause here, even if only temporarily, given these recent sharp moves lower.
NB: It seems that the extreme market shift due to Covi-19 has helped to undermine the longer-term descending wedge pattern so this has been removed from the charts.
Price closed the week just above the long-term support level 1.05 (see weekly chart for significance of this level) making this the level to watch for any new make or break.
There are new 4hr chart triangle trend lines to monitor for any momentum breakout.
Bullish targets: any bullish triangle breakout, back above the 20-yr TL, would bring 1.10, 1.11 and, then, 1.12 into focus as the latter is near the 4hr chart’s 61.8% fib.
Bearish targets: any bearish triangle breakdown below 1.065 would bring the major S/R level of 1.05 into focus.
- Watch the for any 4hr chart triangle breakout:
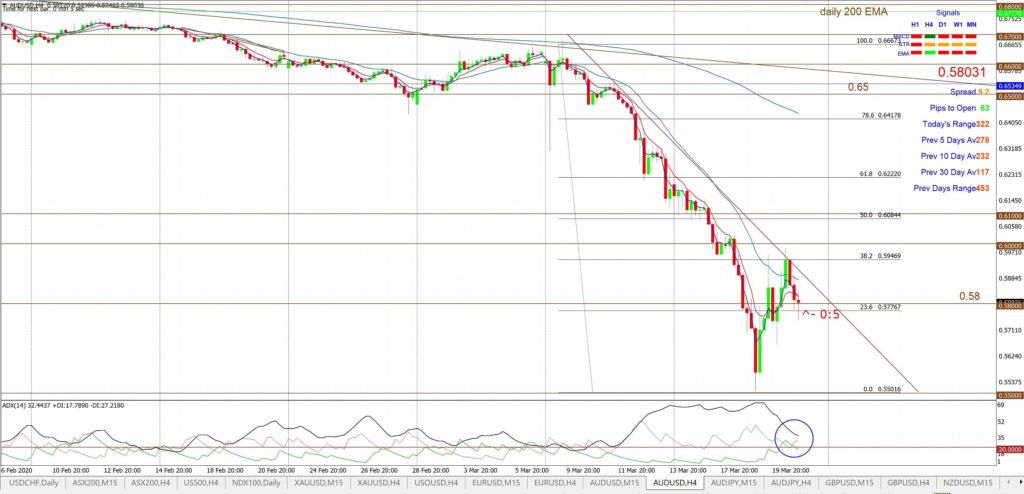
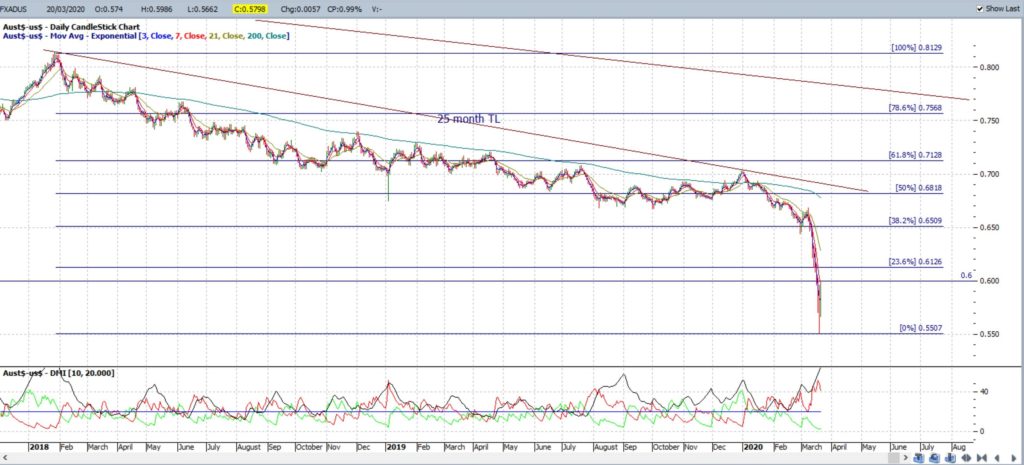
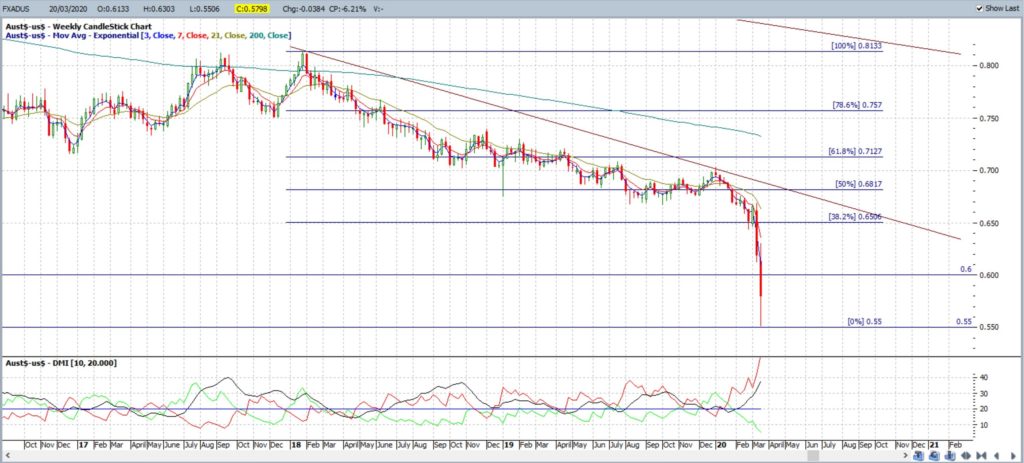
AUD/USD: The Aussie closed with a bearish weekly candle having long upper and lower shadows reflecting some indecision. Price action bounced off 0.55 during the week and this is a Low not seen since 2002! The monthly chart shows that the 0.50 level is the next major support below this 0.55 region.
The Aussie closed the week near 0.58 making this the level to watch for any new make or break.
There are revised 4hr chart trend lines to monitor as well.
Bullish targets: Any bullish triangle breakout would bring 0.60 and whole-numbers on the way back to 0.65 into focus.
Bearish targets: Any hold below 0.58 would bring the bottom triangle trend line, at 0.55 S/R, into focus followed by 0.50 S/R.
- Watch 0.58 and for any 4hr chart triangle breakout:
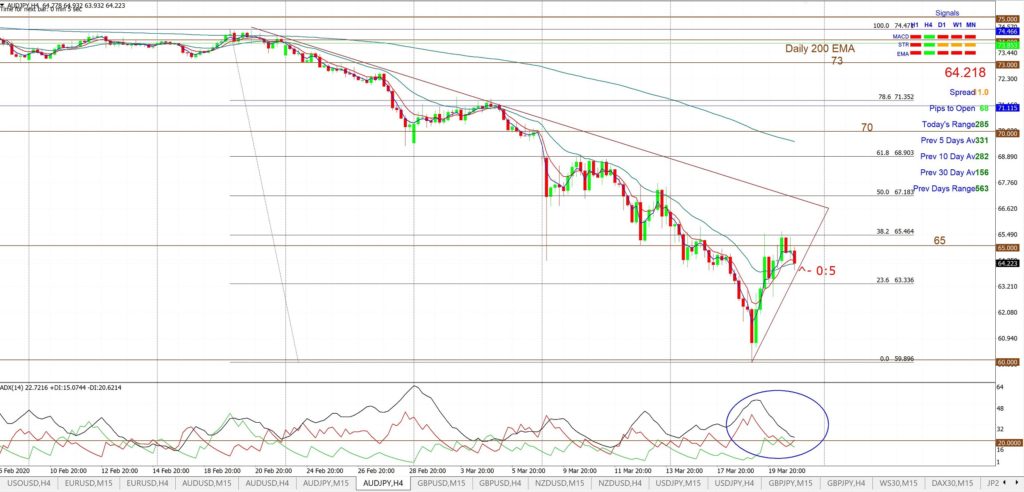
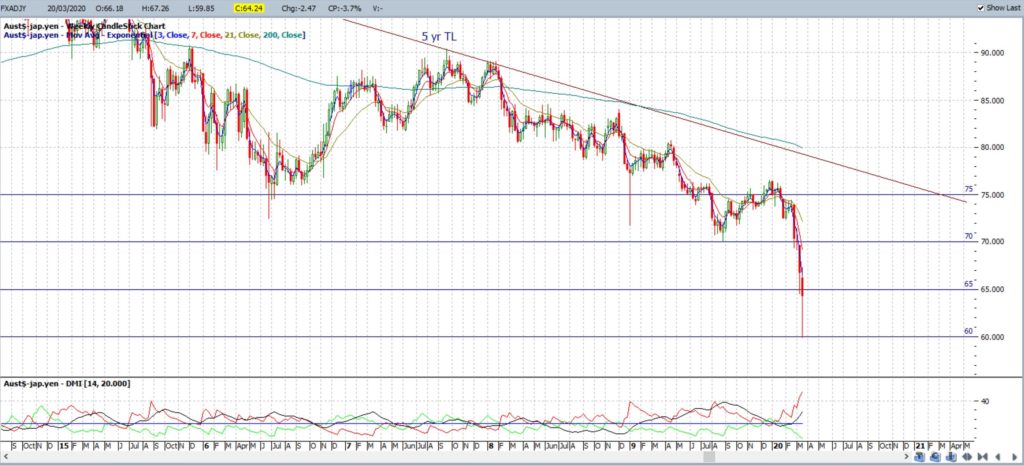
AUD/JPY: The AUD/JPY closed with a bearish weekly candle, albeit well off it’s Low for the week, and just under the 65 whole-number S/R level keeping this as the main horizontal level to watch for any new make or break.
Price actually reached down to 60 S/R last week, a level not seen since the depths of the 2009 GFC era, and the monthly chart (below) shows the significance of this level.
Last week’s triangle pattern gave a great trend line breakout and there is a new 4hr chart triangle to monitor in the coming week. The AUD/JPY seems to be a great Forex pair for trading the current heightened volatility.
Bullish targets: Any bullish 4hr chart triangle breakout would bring 70 S/R into focus followed by 71 and 72 S/R.
Bearish targets: Any bearish 4hr chart triangle breakout would bring 60 S/R back into focus and, after that, 55 S/R.
- Watch 65 S/R and for any 4hr chart triangle breakout:
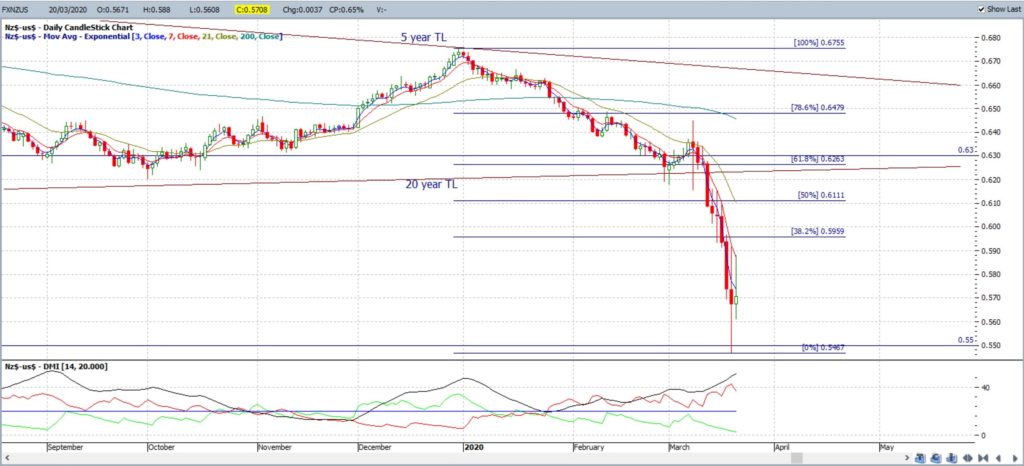
NZD/USD: The Kiwi closed with a large, bearish weekly candle after last week’s large bearish, almost engulfing, weekly candle.
Price action actually made it down to the 0.55 S/R level, another support level not seen since the 2009 GFC! The monthly chart reveals that the next major support, below 0.55, is the 0.50 region.
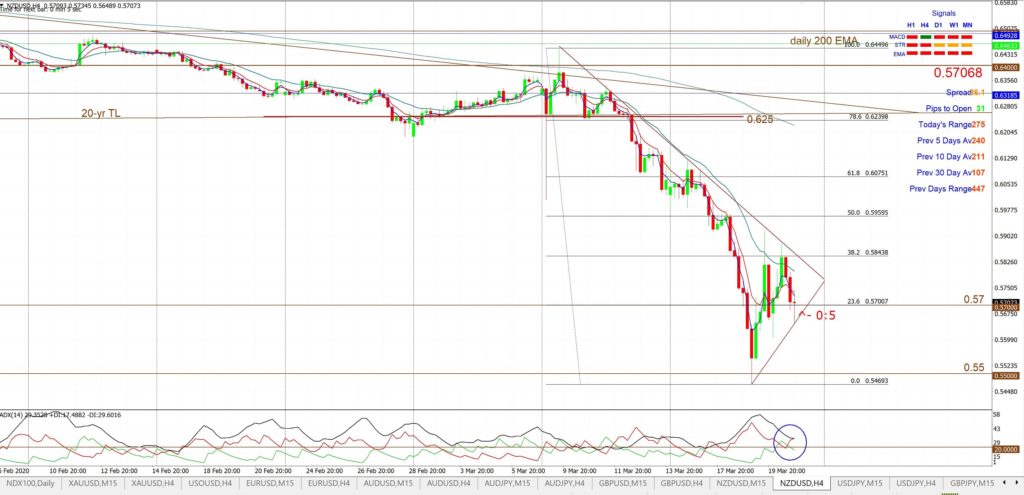
There are new 4hr chart trend lines to monitor but price closed the week near 0.57 so keep watch of this level for any new make or break.
Bullish targets: Any bullish 4hr chart triangle breakout would bring 0.60 S/R into focus as this is not too far from the 4hr chart’s 61.8% fib
Bearish targets: Any bearish 4hr chart triangle breakout would bring the 2009 Low, near 0.55, into focus and, after that, 0.50 (see monthly chart).
- Watch 0.57 and for any 4hr chart triangle breakout:
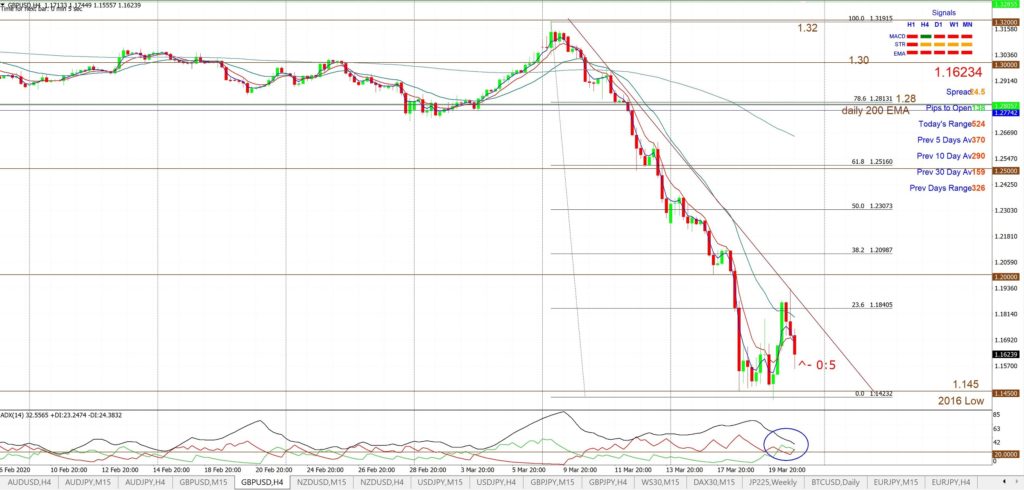
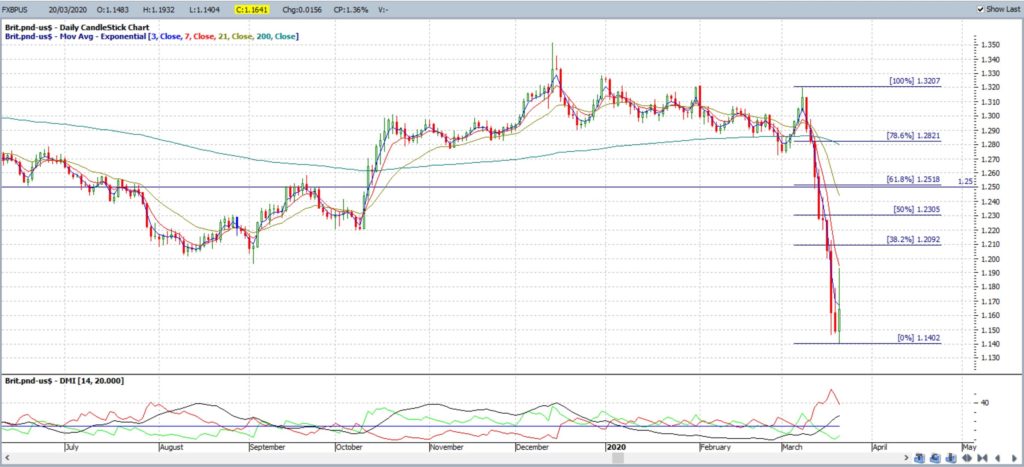
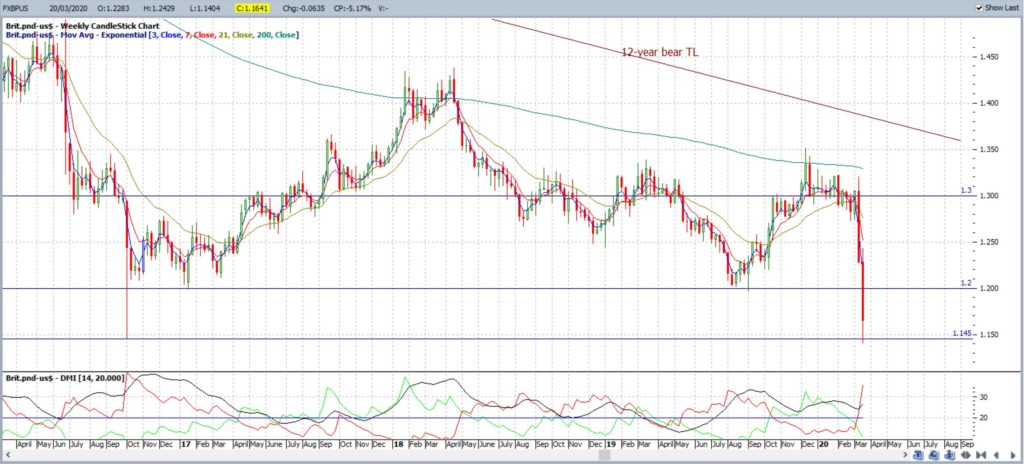
GBP/USD: The GBP/USD closed with a large, bearish weekly candle and just above the 2016 Low, circa 1.145, making this the horizontal level to watch in coming sessions for any new make or break.
There are new 4hr chart triangle trend lines to watch for any momentum breakout as well with 1.145 forming the bottom trend line here.
Bullish targets: Any bullish 4hr chart triangle breakout would bring 1.20 and whole-numbers on the way to 1.25 S/R into focus as the latter is near the 4hr chart’s 61.8% fib
Bearish targets: Any bearish 4hr chart triangle breakout below 1.145 would bring the 1985 Low, near 1.05, into focus (see monthly chart).
- Watch for any 4hr chart triangle breakout:
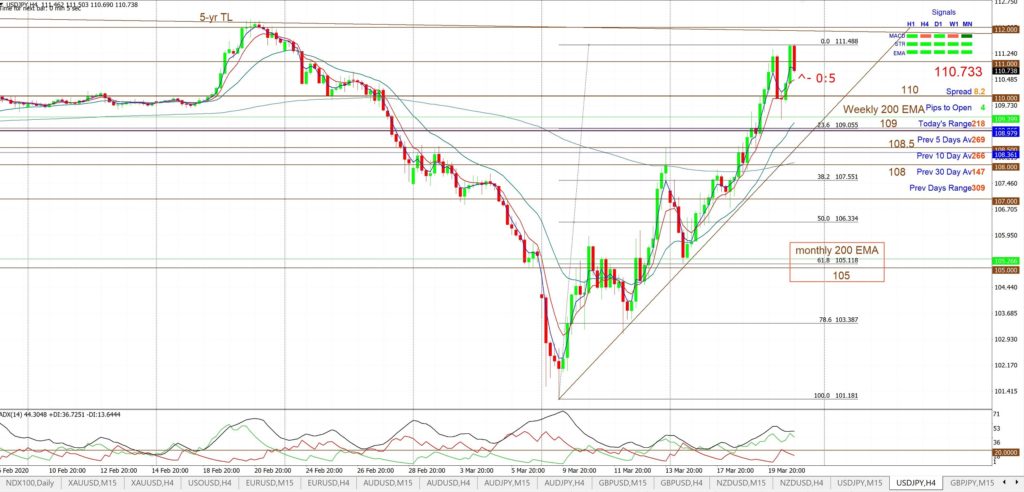
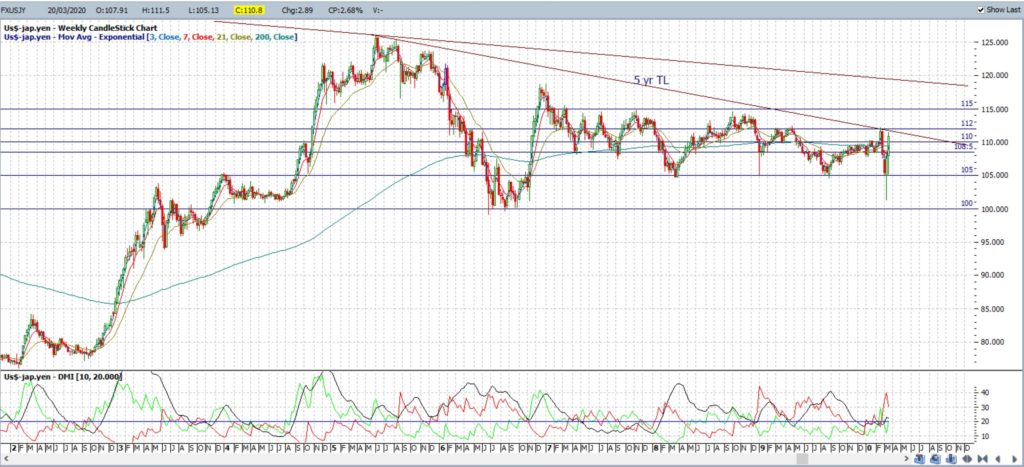
USD/JPY: The USD/JPY closed with a large, bullish weekly candle following last week’s bullish, almost engulfing, candle. This move generated a great trend line breakout trade that gave up to 350 pips!
Price has now reached back to near the 5-yr bear trend line making this the region to watch for any new make or break. This trend line is currently aligned near 112 S/R.
Bullish targets: Any bullish 4hr chart triangle breakout above 112 would bring 115 S/R into focus as this is a prominent S/R level on the weekly chart.
Bearish targets: Any bearish 4hr chart triangle breakout would bring 109, 108.5 and 108 back into focus followed by 105 as the latter is near the 4hr chart’s 61.8% fib
- Watch for any 4hr chart triangle breakout:
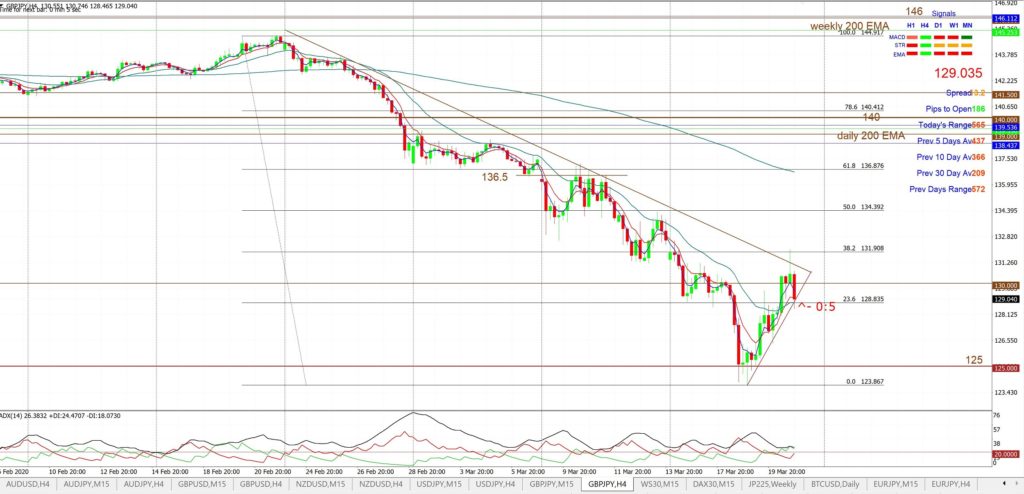
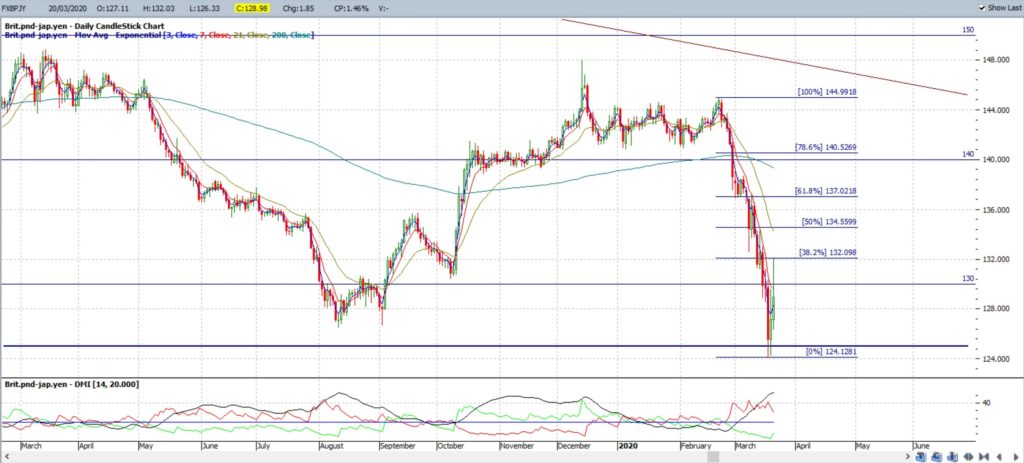
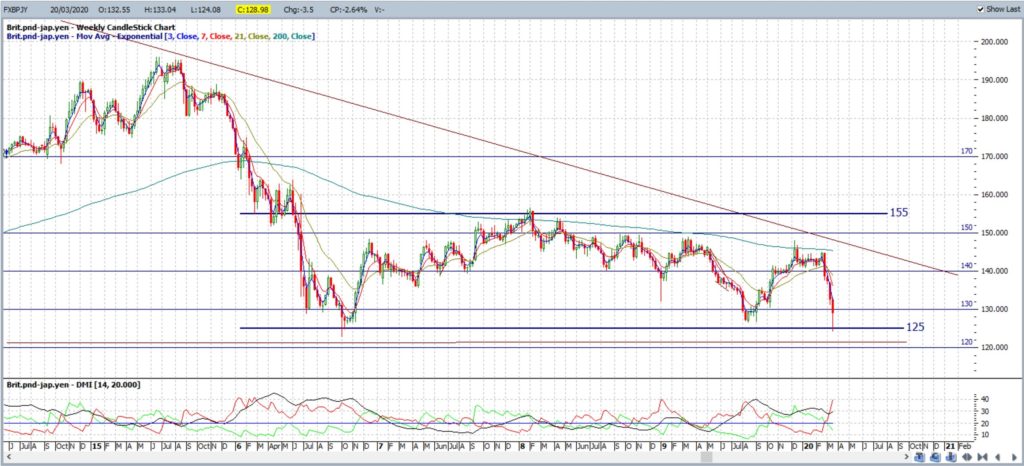
GBP/JPY: The GBP/JPY closed with a bearish weekly candle but well off its Low for the week. I had warned in this post, from last week, to watch for any push to the 125 level and look where price reacted and paused last week! Right at 125 making this the main horizontal level to watch for any new make or break.
Note there are also new 4hr chart triangle giving traders trend lines to watch for any momentum breakout.
Bullish targets: Any bullish 4hr chart triangle breakout would bring 136.5 S/R into focus as this is near the 4hr chart’s 61.8% fib
Bearish targets: Any bearish 4hr chart triangle breakout would bring 125 S/R back into focus and, after that, the 120 level (see monthly chart).
- Watch for any 4hr chart triangle breakout:


