Most chart patterns are little changed with the exception of the S&P500. US stocks slipped due to Covid-19-related economy concern. Like I mentioned yesterday, traders might need to wait for NFP before we see any significant market movement.
NB: the ‘Comments’ section on Posts is not working so, please, if you have any questions or comments, email to me directly: mary@tradecharting.com
Data: Coronavirus remains the main theme but watch also for any impact from EUR PPI, US Unemployment Claims, Trade Balance and Factory Orders data.
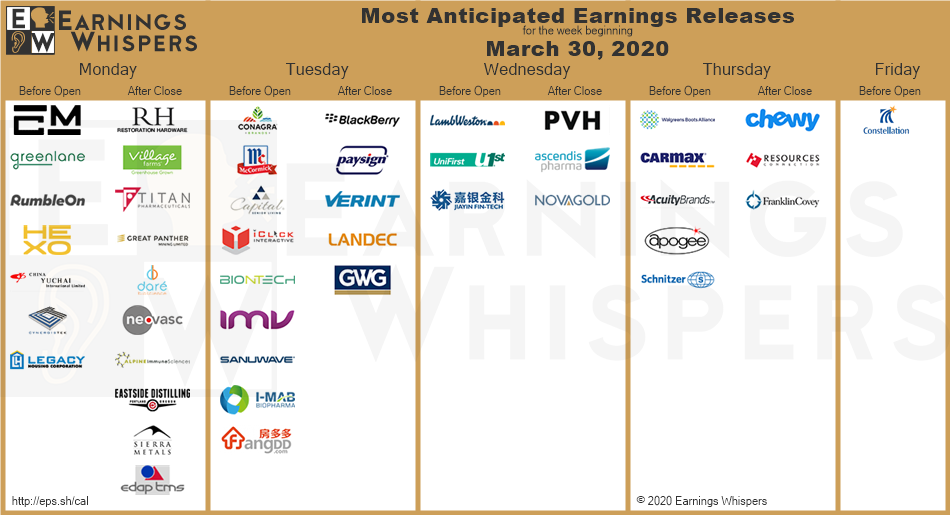
Earnings: CHEWY will interest some:
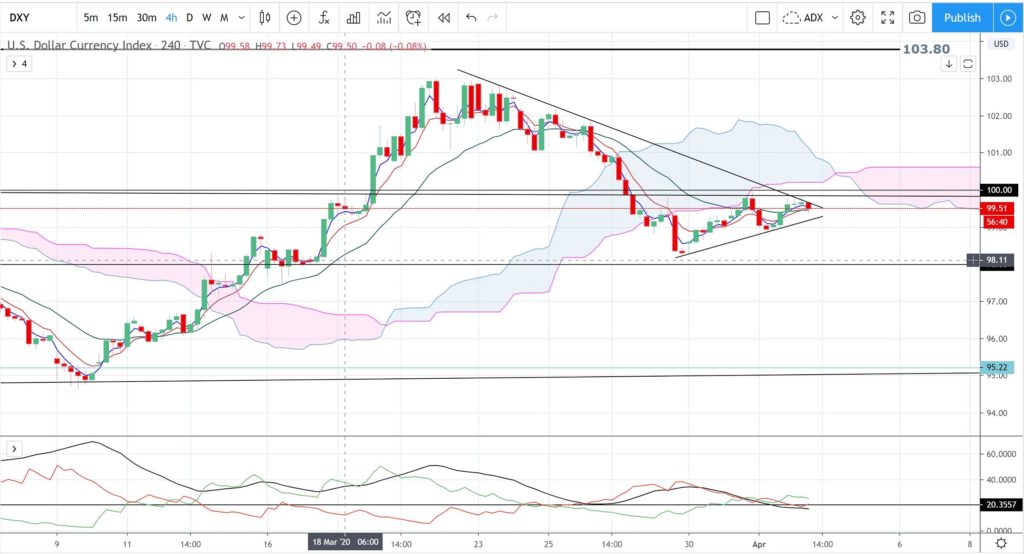
DXY 4hr: still chopping sideways near 100 S/R on low momentum:
Trade line breakouts:
S&P500:
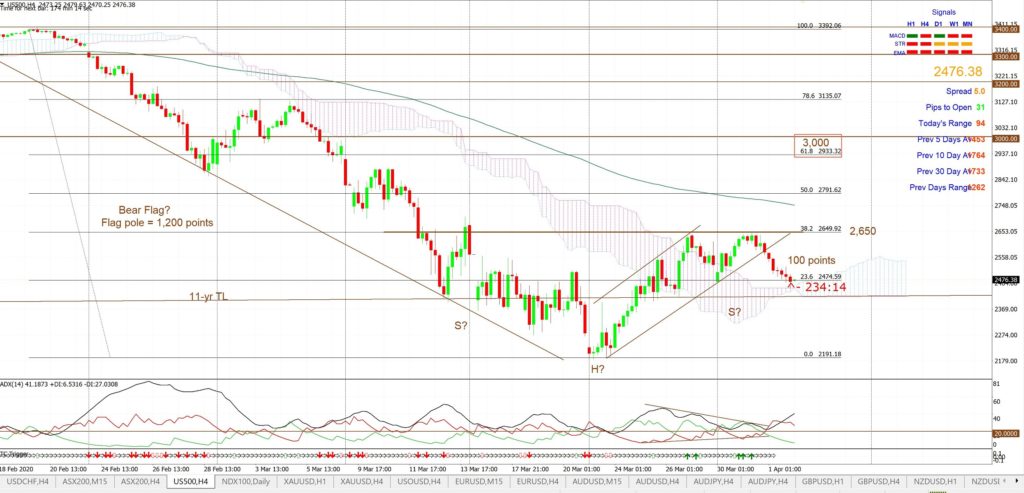
S&P500 4hr: a small b/o from this TL BUT watch the 11-year support TL for any new make or break:
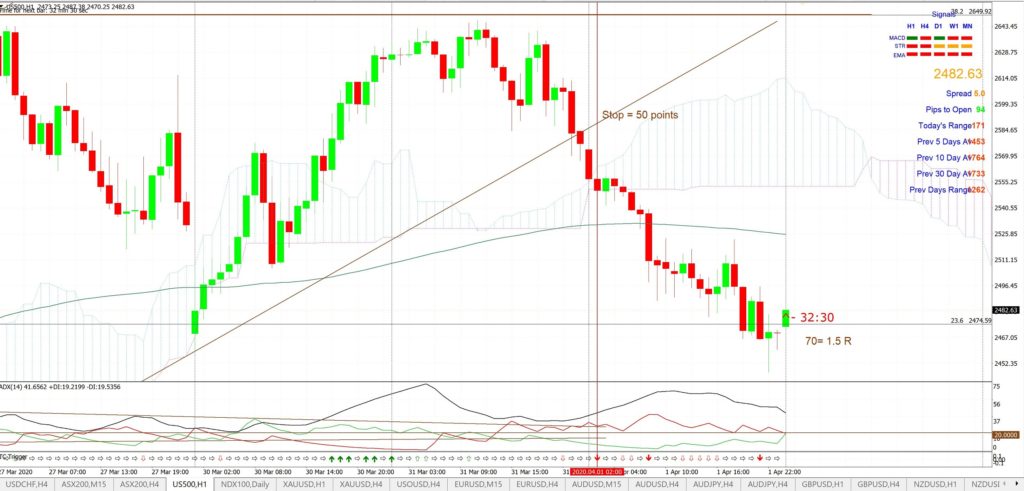
S&P500 60 min: not a great trade but at least it would have worked. STOP placement would be the issue and I would have chosen the other side of the TL:
Other Markets:
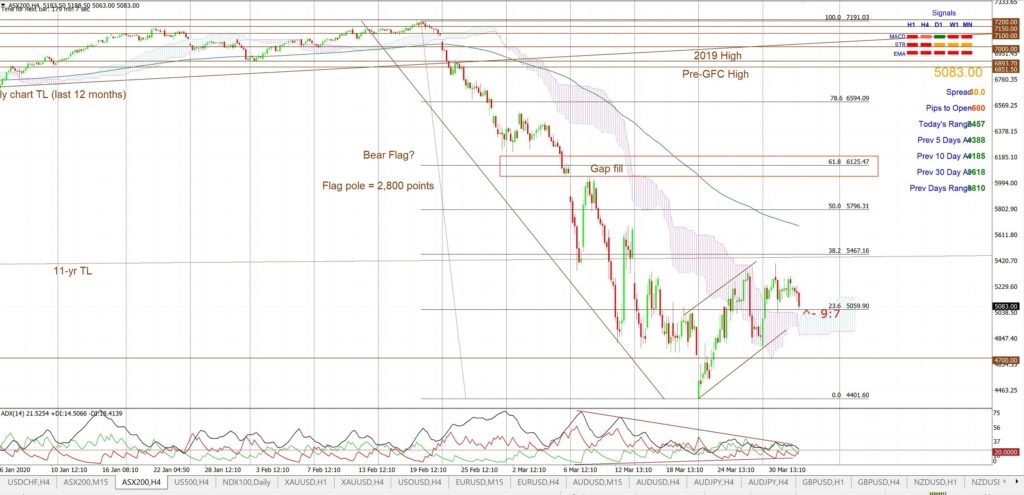
ASX-200 4hr: watch for any momentum-based Flag trend line breakout:
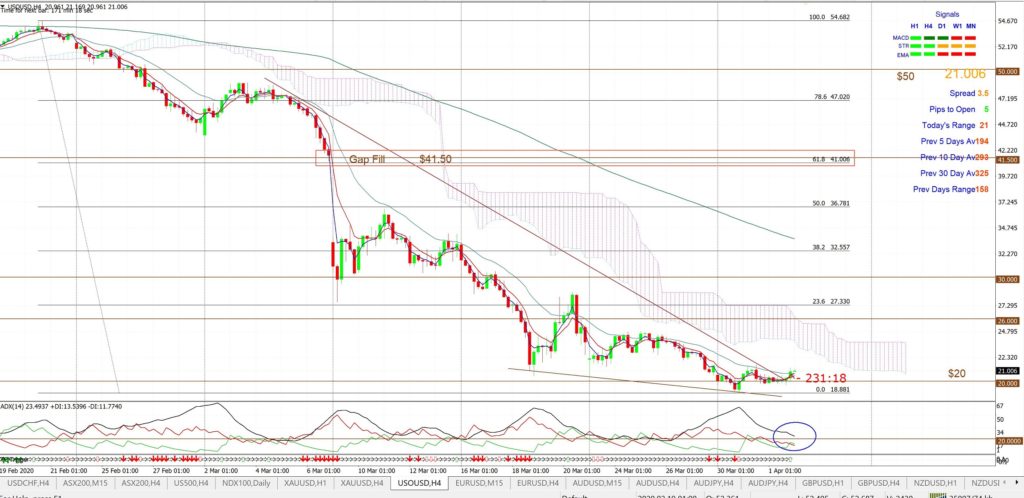
Oil 4hr: watch for any momentum-based trend line breakout. It also might be safest to wait for any new close back above the 4hr Cloud:
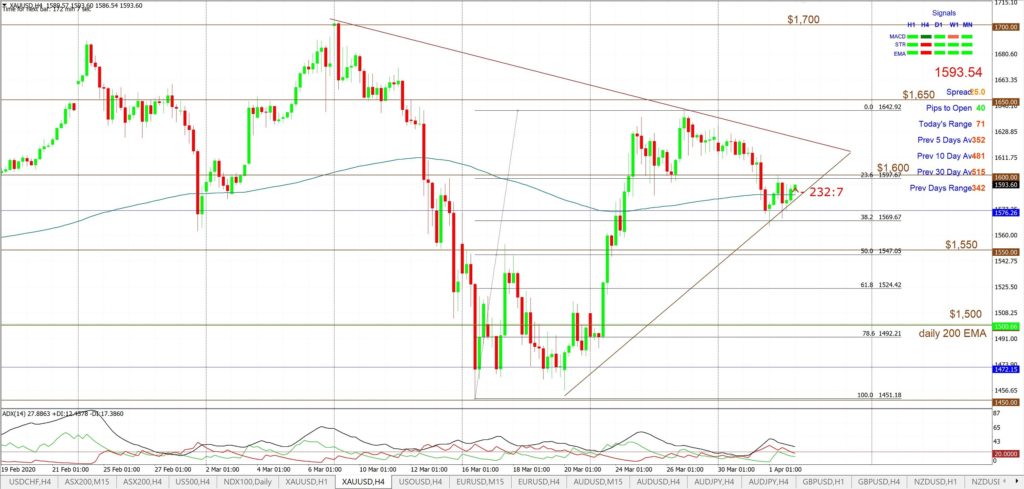
Gold 4hr: revised trend lines here as price chops near the key $1,600 so watch for any momentum-based trend line breakout:
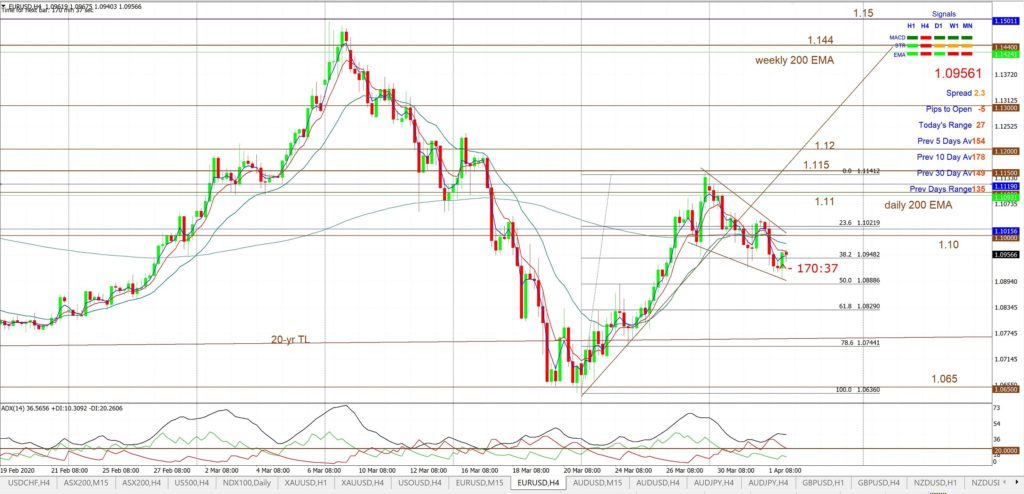
EUR/USD 4hr: watch for any momentum-based trend line breakout:
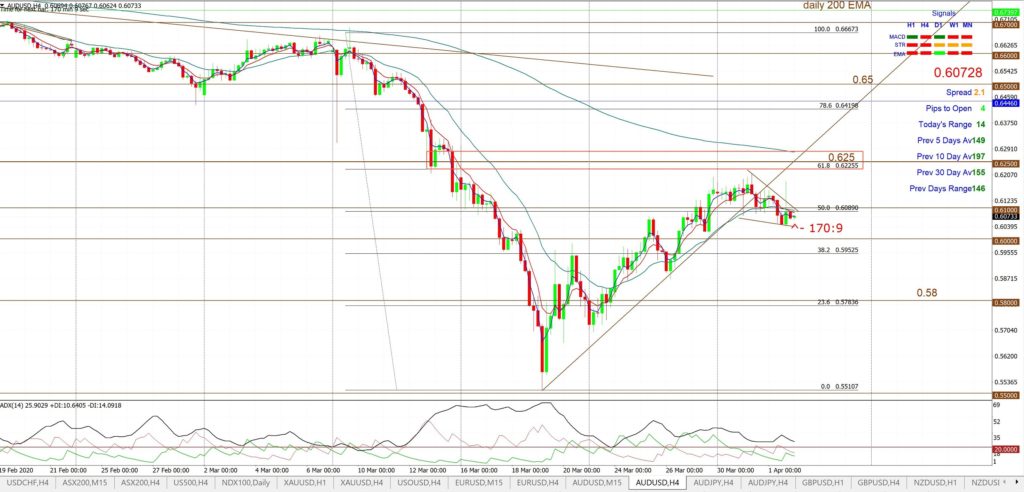
AUD/USD 4hr: watch for any momentum-based trend line breakout:
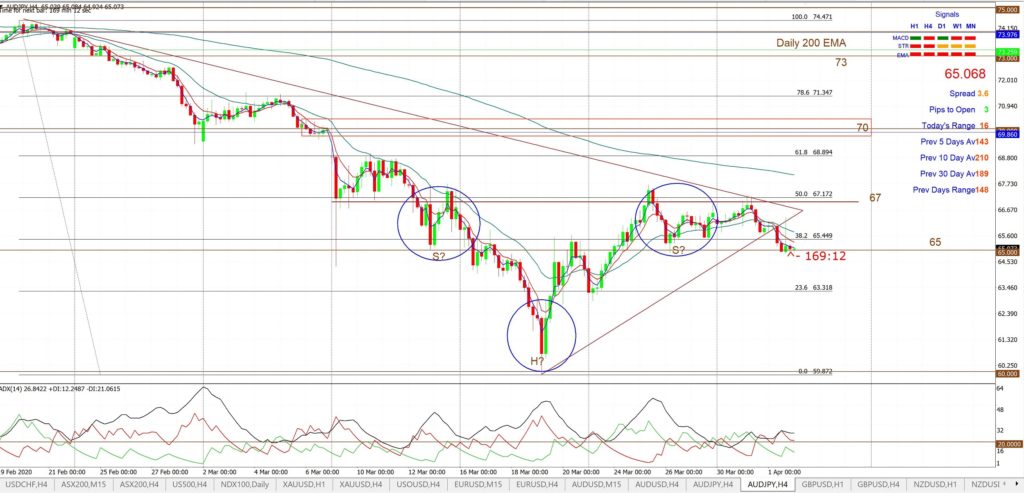
AUD/JPY 4hr: watch 65 for any momentum-based trend line breakout:
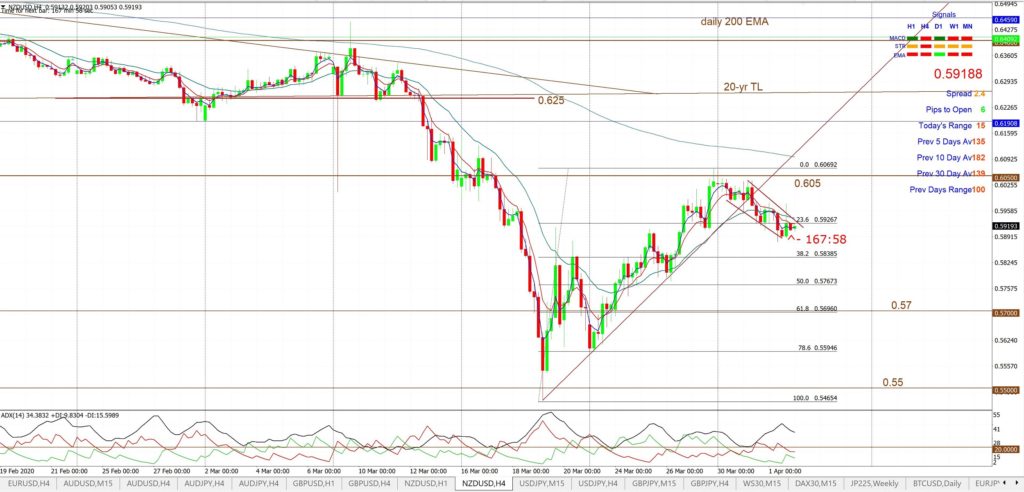
NZD/USD 4hr: watch for any momentum-based trend line breakout:
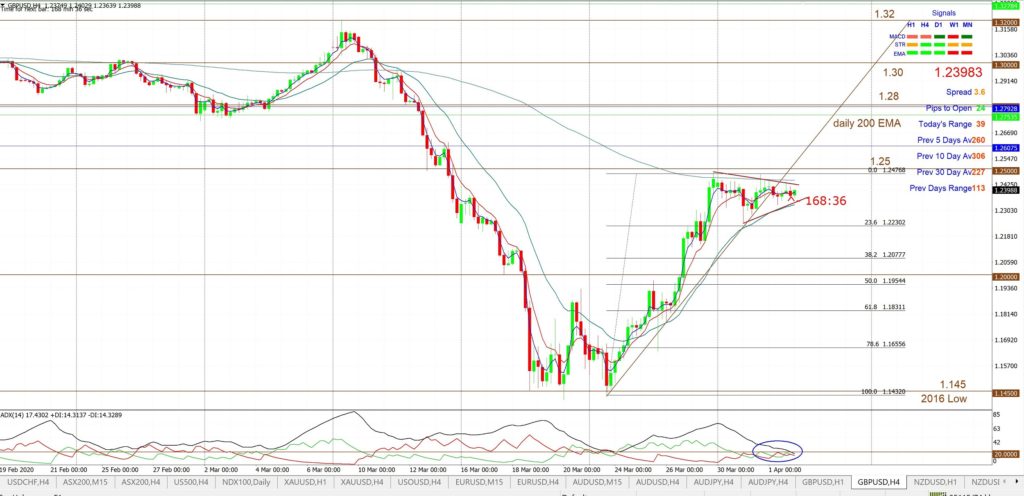
GBP/USD 4hr: watch for any momentum-based trend line breakout:
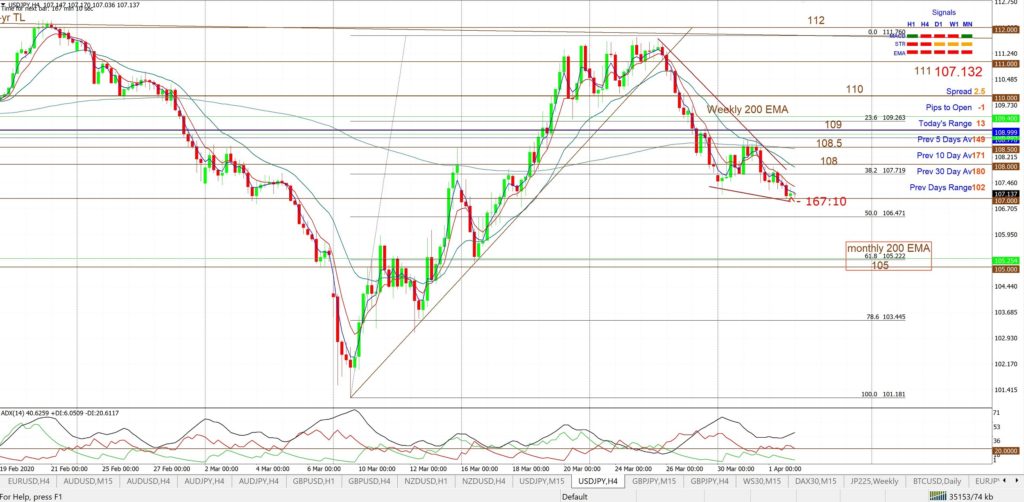
USD/JPY 4hr: watch for any momentum-based trend line breakout:
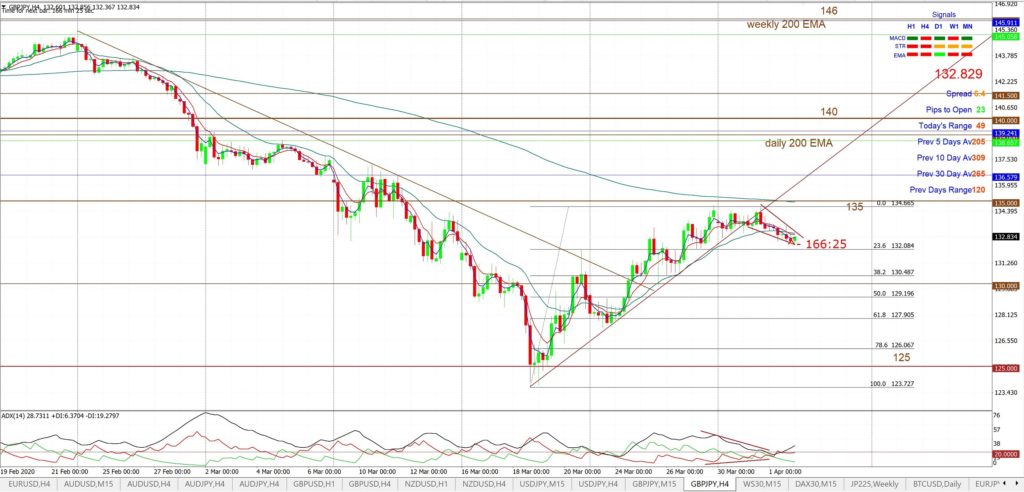
GBP/JPY 4hr: watch for any momentum-based trend line breakout:


