Is this it? Are we witnessing the beginning of a shift between the ASX-200 and S&P500? Where the ASX-200 no longer under-performs the S&P500? I’ve long wondered what could initiate such a significant shift but now ponder whether the Covid-19 pandemic might be just the trigger!
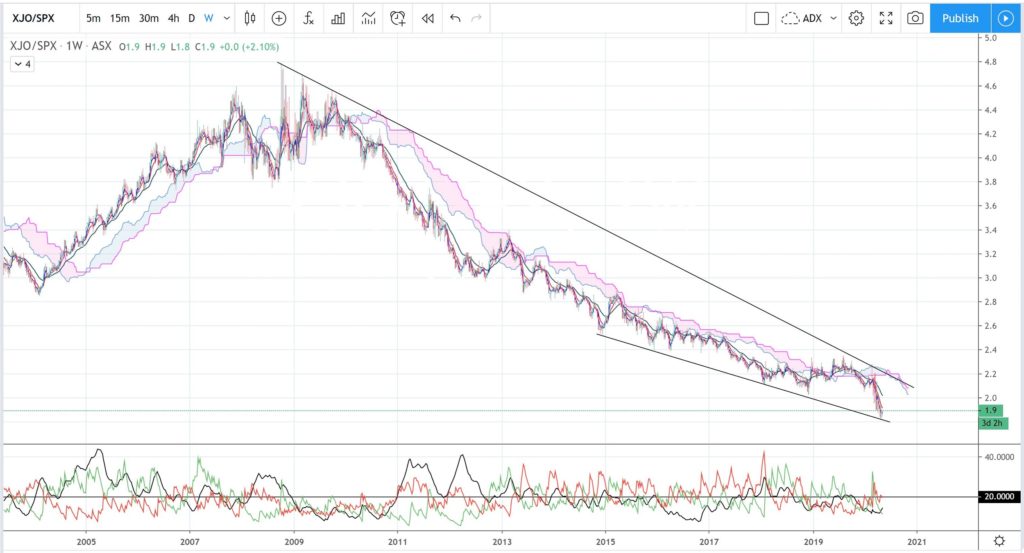
ASX-200 v S&P500 weekly (condensed):
This chart shows a plot of the ASX-200 (XJO) versus the S&P500 (SPX). This is a comparison chart and it shows a fairly steady decline over the last 10 years which translates to mean that the XJO has under-performed relative to the S&P500 throughout this time. However, this type of price action has led to the formation of a potential bullish-reversal Descending Wedge chart pattern. I was looking at this chart earlier in the year and pondering what could possibly occur to reverse this trend and trigger the XJO to start to out perform the S&P500? I now question whether a global shift caused by Covid-19 might just be the trigger?
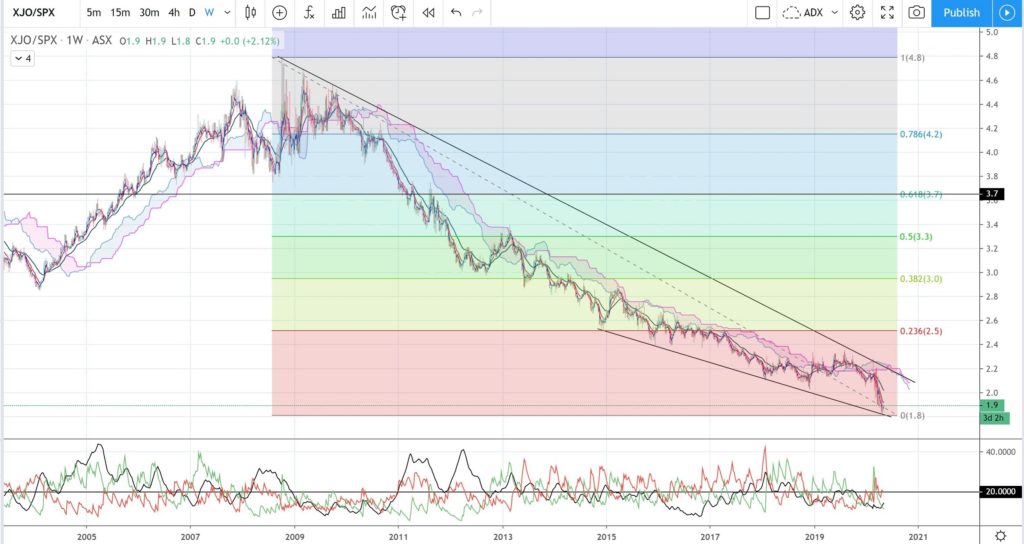
ASX-200 v S&P500 weekly (+ Fibonacci): This is the same chart as above but with a Fibonacci retracement in place. The 61.8% Fibonacci level is a popular retracement and would be in focus on any bullish wedge breakout:
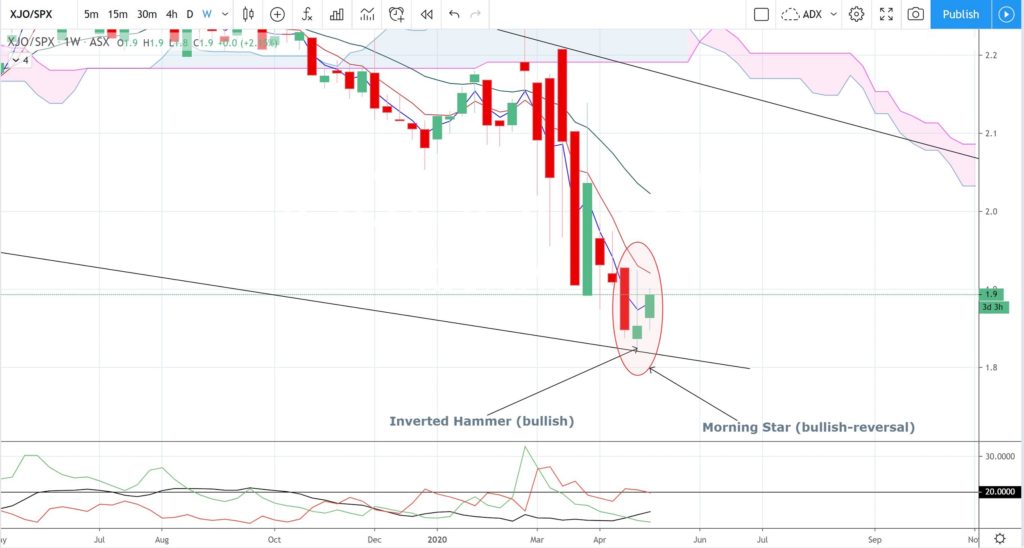
ASX-200 v S&P500 weekly: this is the same chart as the first one but in expanded form. There are two further bullish features to note on this view that have formed, or are forming, at the support of the bottom trend line:
- Firstly, last week’s candle closed as a bullish-reversal Inverted Hammer.
- Secondly, the current weekly candle is bullish, and, if this closes as bullish then the last three candles will shape up in a bullish-reversal Morning Star pattern.
Final Comment:
The XJO/SPX weekly chart is shaping up with a bullish-reversal Descending Wedge that has been developing over the last 10 years. There is no bullish breakout just yet but there are two, smaller-time frame bullish chart patterns that have formed / are forming at the bottom wedge trend line support: an Inverted Hammer weekly candle and a developing Morning Star pattern. Traders should keep an eye on this chart over the coming weeks to see whether there might be any bullish-reversal activity following these chart patterns and whether the ASX-200 might start to outperform the S&P500.


