I often make reference to the concept of an ‘Ideal TC Signal‘ and this post provides charts to help illustrate examples of these.
An Ideal TC Signal is one where a TC signal triggers with a:
- breakout from a 4hr chart technical pattern or from an Asian trading range.
- breakout from quiet and sideways price action.
- small required Stop.
Asian Trading Range TC Signal:
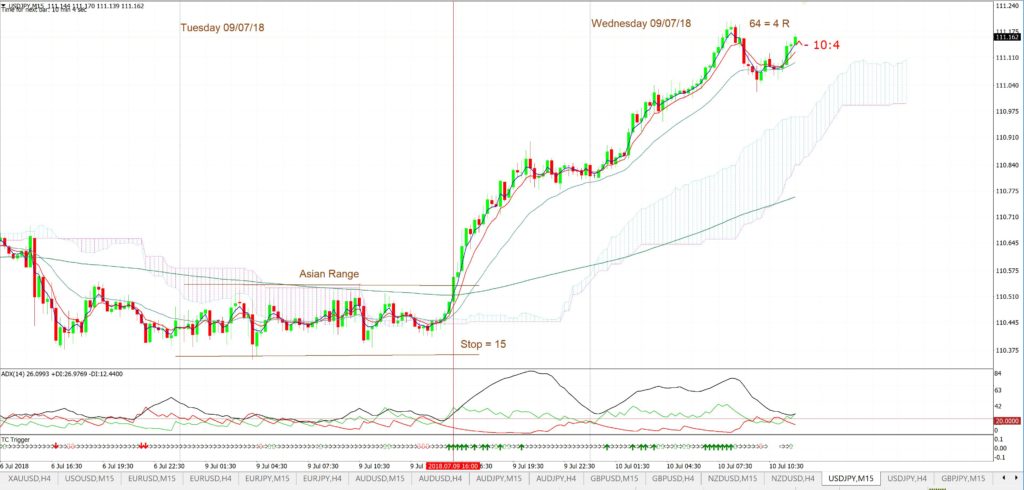
USD/JPY: This example shows a TC signal that has triggered after a breakout from the Asian trading range. Note how the prior price action was quiet and sideways in a relatively narrow range. This type of price action makes for a small Stop to be required when price eventually breaks out of the range. This particular TC signal then has a better chance of delivering a great Risk to Reward result due to the small initial Stop. This trade delivered over 60 pips but gave a 4 R result:
USD/JPY 15 min:
4hr Chart Pattern Breakout TC signal:
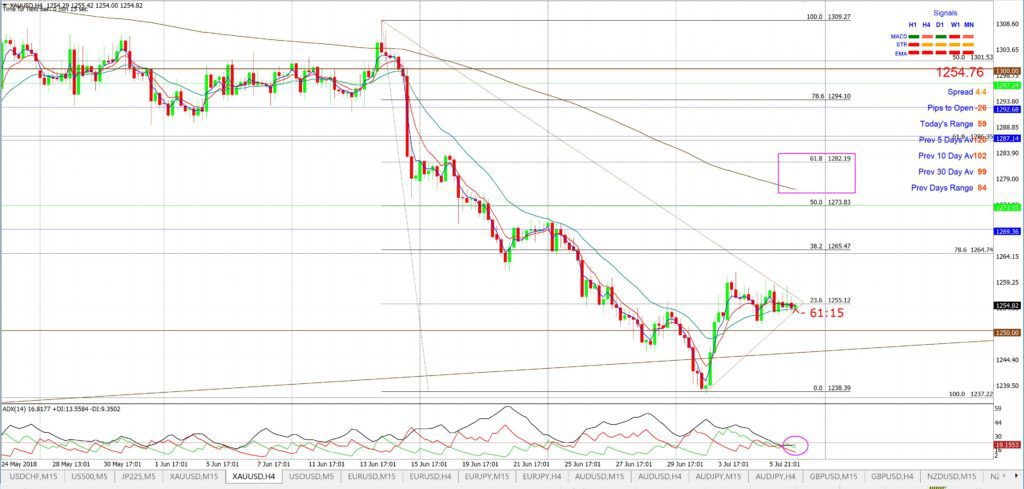
Gold: On Sunday 8th July 2018 I posted my 4hr chart patterns and the following chart shows the set up on Gold:
Gold 4hr: there was a triangle pattern on the 4hr chart time frame.
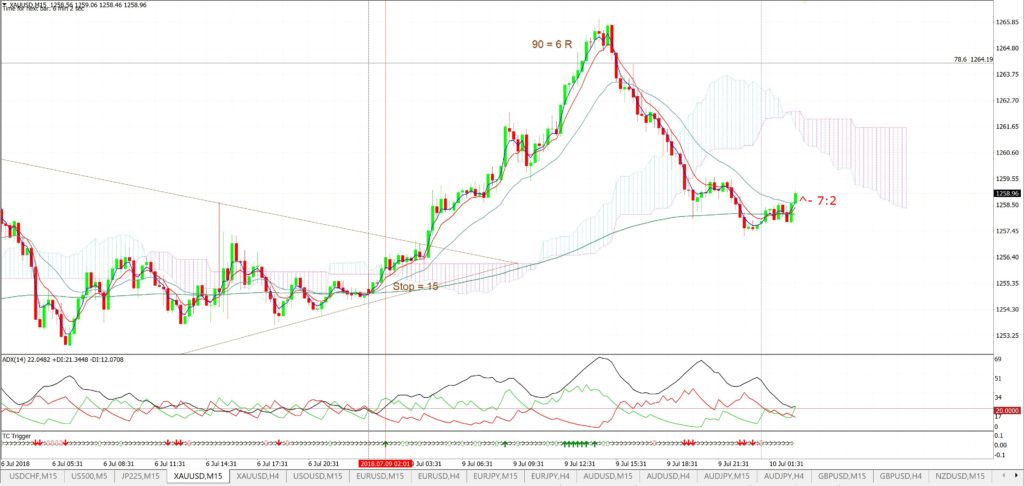
Gold 15 min: A TC signal triggered on the Monday, however, waiting for confirmation following the breakout from the triangle would still have enabled a decent low-Risk and high Reward trade result here. The price action prior to the trend line breakout was quiet and sideways and this helped to shape a TC signal that offered a very low-Risk entry. The maximum Return here was 90 pips for a 6 R trade result:
Summary: the best TC signals evolve out of quiet, sideways markets that trigger with a new trend line breakout. This trend line break can be from a 4hr chart pattern or from the Asian trading range. Such price action allows for low risk entries that then help to enable better Risk to Reward trade result outcomes.


