Gold has dipped and this triggered a reasonable trend line breakout but most other charts are displaying holding patterns. Markets might chop sideways until after this week’s NFP so caution is needed until that data release.
Data: China reported upbeat PMI data (see below) yesterday which drew the odd raised eyebrow! There is Caixin Manufacturing PMI data today so watch for that as well as lots of second tier EUR data and US ADP NFP data:
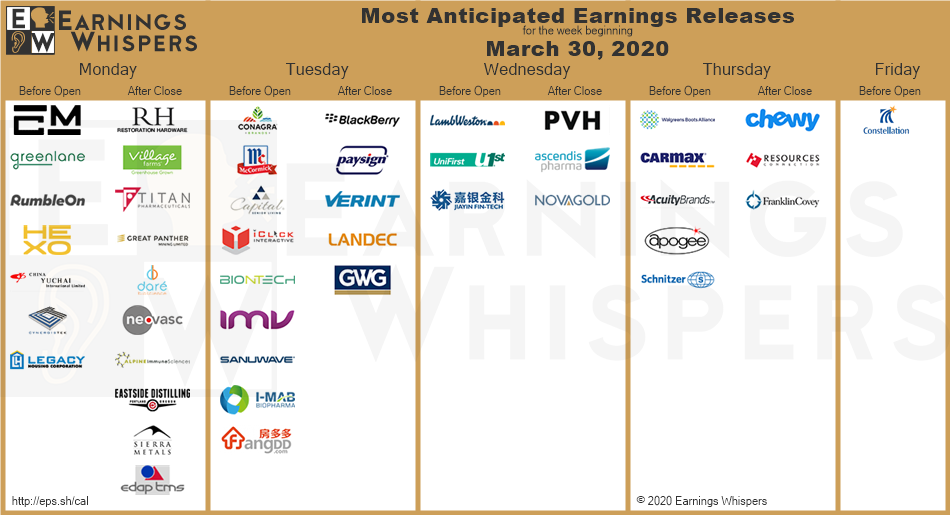
Earnings:
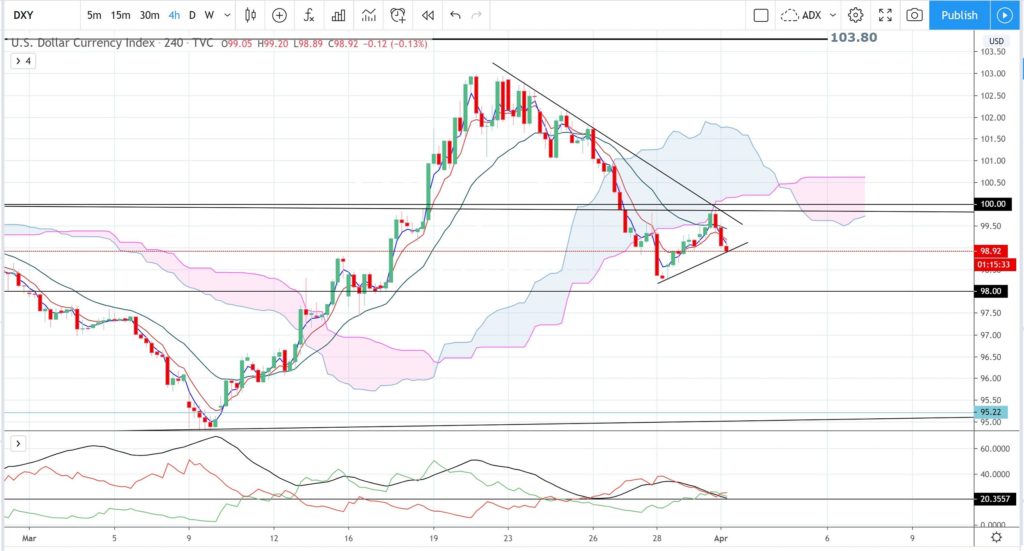
DXY 4hr: chopping sideways and this has formed up a triangle pattern so watch for any trend line breakout:
Trend line breakouts:
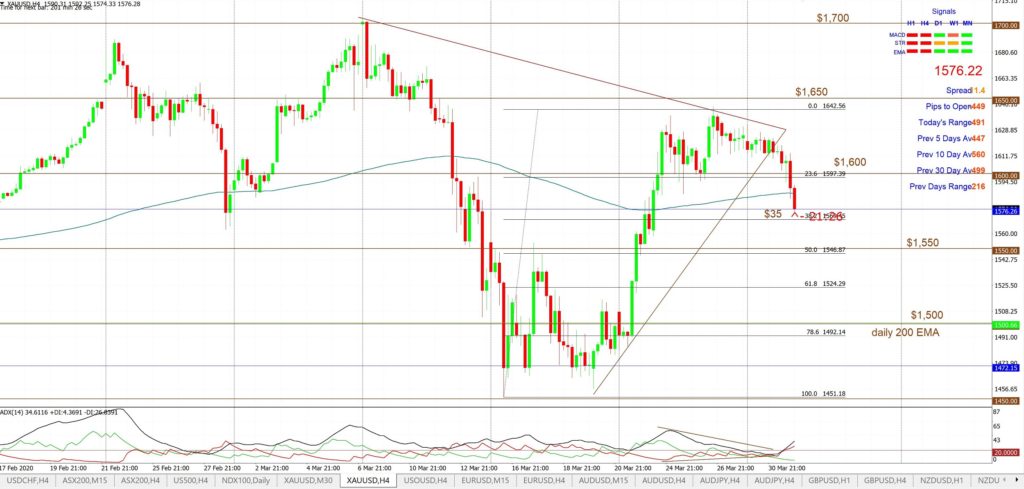
Gold: is back below the key $1,600.
Gold 4hr: a TL b/o for up to $35:
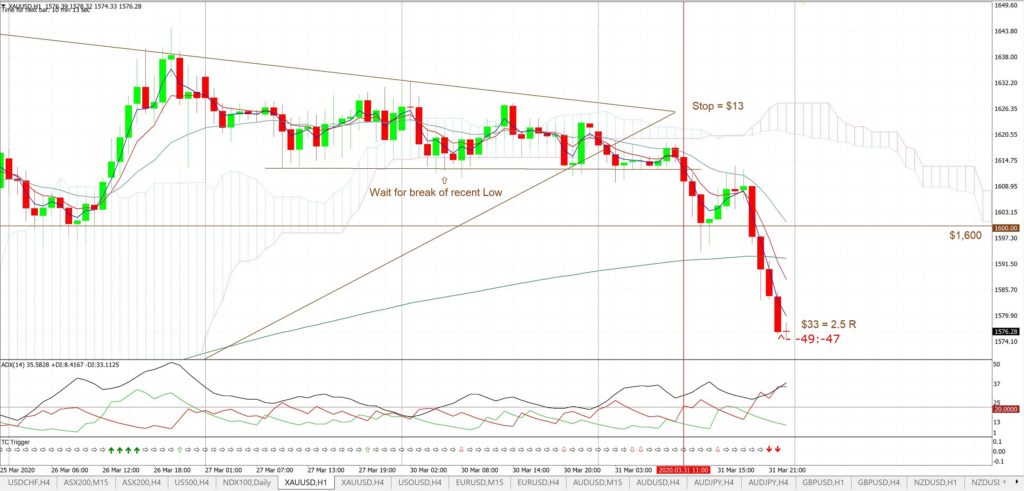
Gold 60 min: this trend line b/o could have been caught off the 60 min chart for a $33 and 2.5 R trade. There was no TC signal here but waiting for the triangle b/o AND for a break of the recent Low would have worked well:
Other markets:
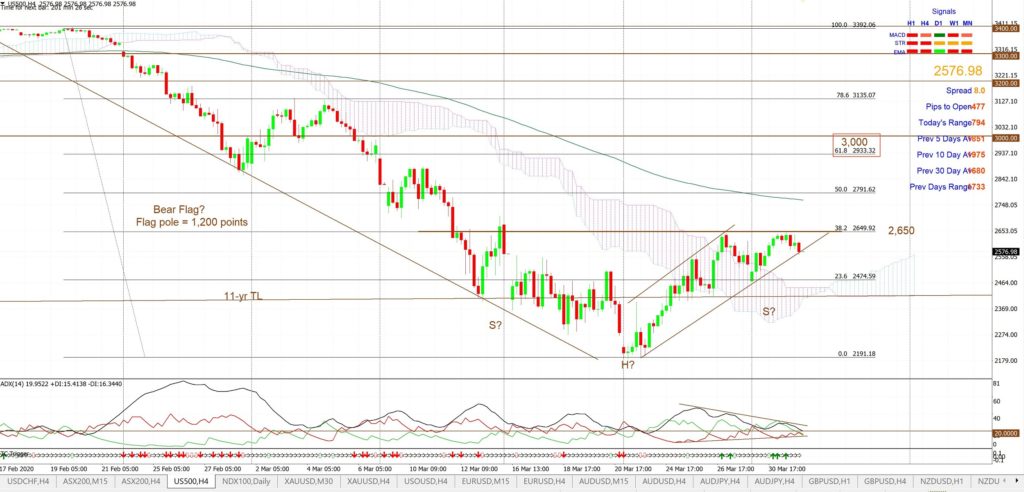
S&P500 4hr: no break back above the 2,650 level and there is still a potential Bear Flag. However, note the look of a bullish Inverse H&S: just to confuse us!
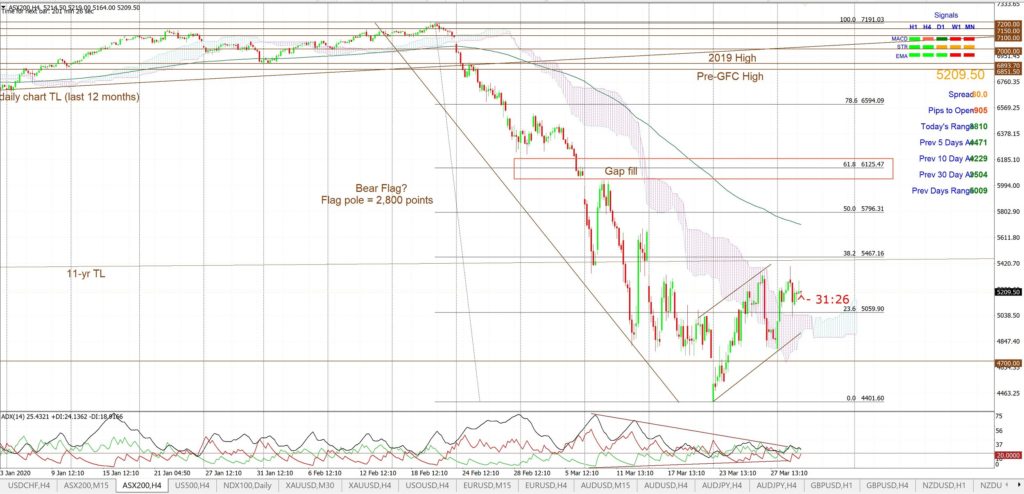
ASX-200 4hr: still in a potential Bear Flag here too for now:
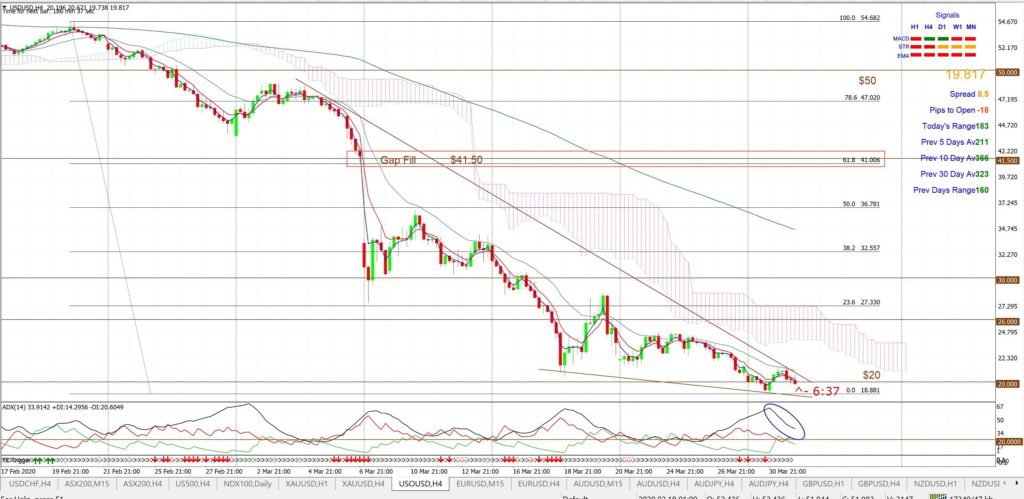
Oil 4hr: still in a Descending Wedge and watch for any uptick with the 4hr ADX to confirm a trend line b/o:
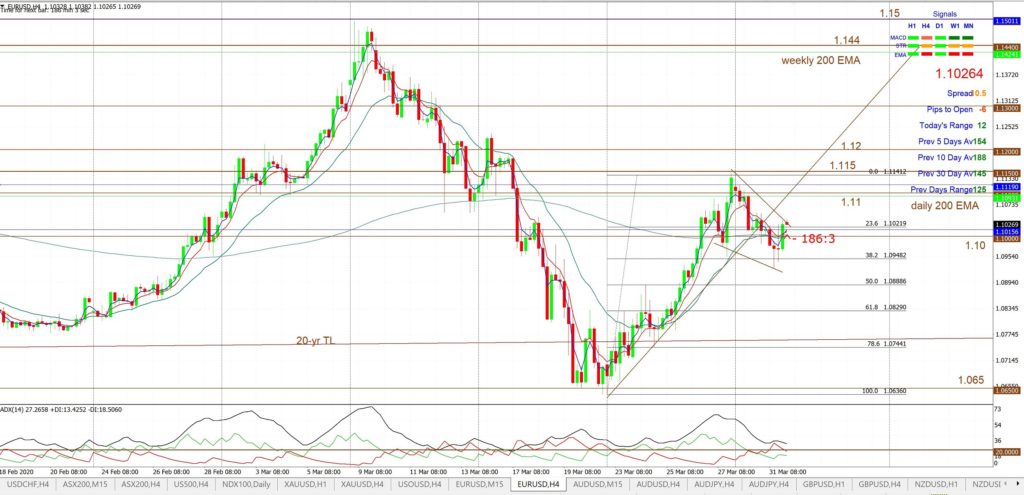
EUR/USD 4hr: choppy here and, as always when a support TL breaks, you need to watch out for any potential Bull Flag:
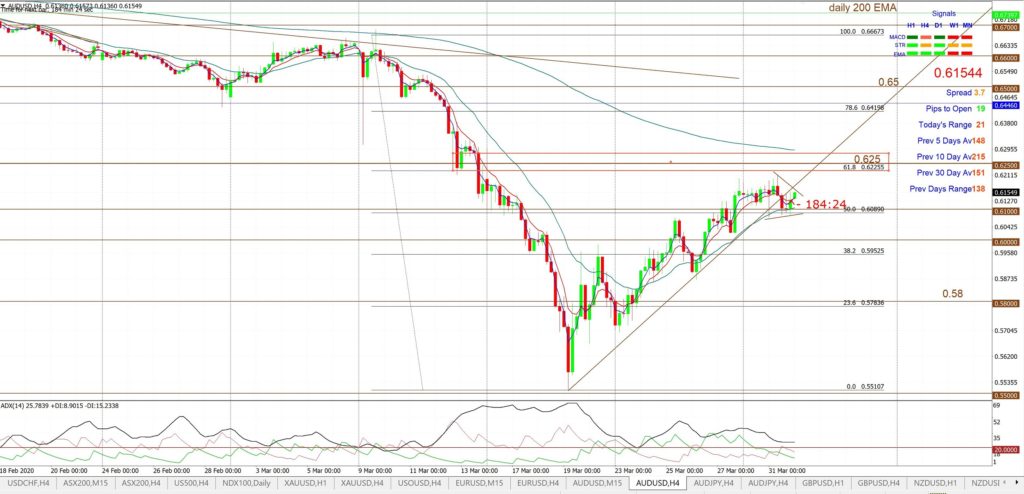
AUD/USD 4hr: choppy here too and, as above, watch out for any potential Bull Flag:
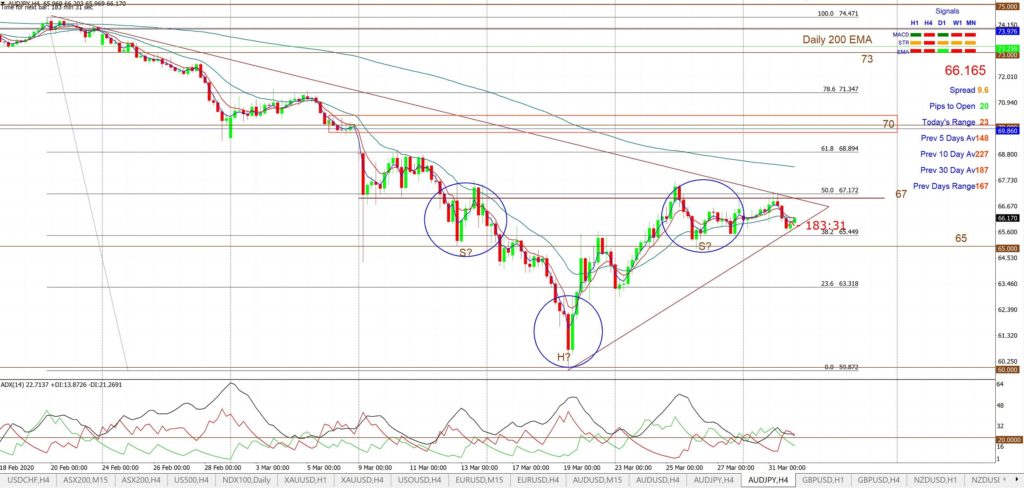
AUD/JPY 4hr: sideways here on low momentum:
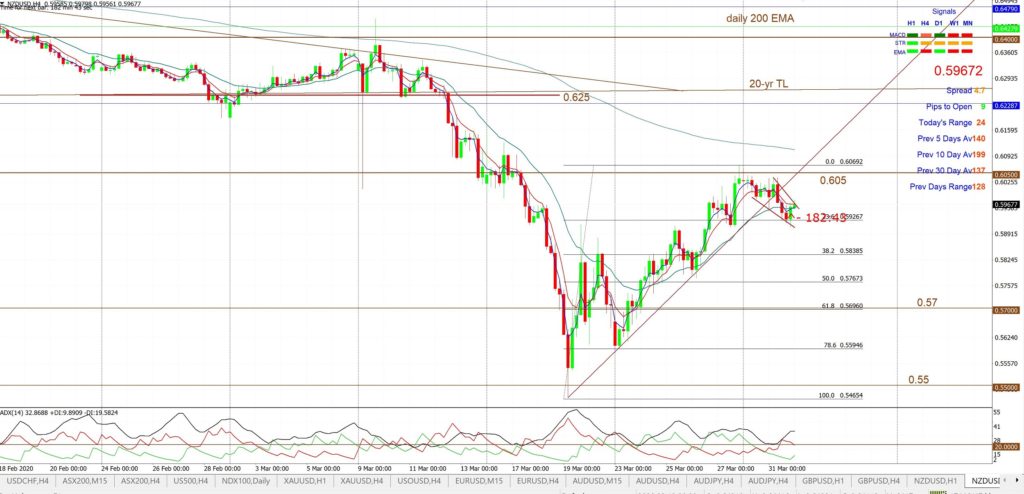
NZD/USD 4hr: choppy here too and, as with the Aussie, watch out for any potential Bull Flag:
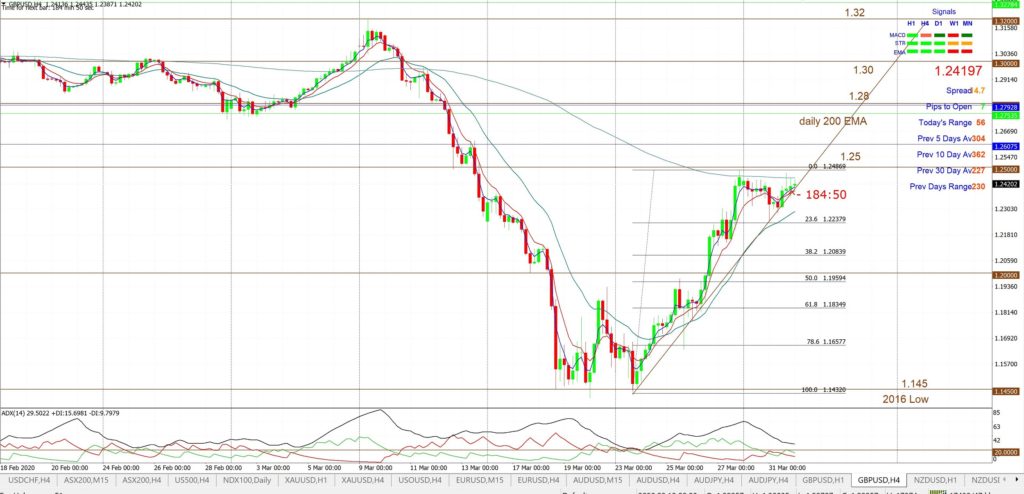
GBP/USD 4hr: watch for any trend line breakout:
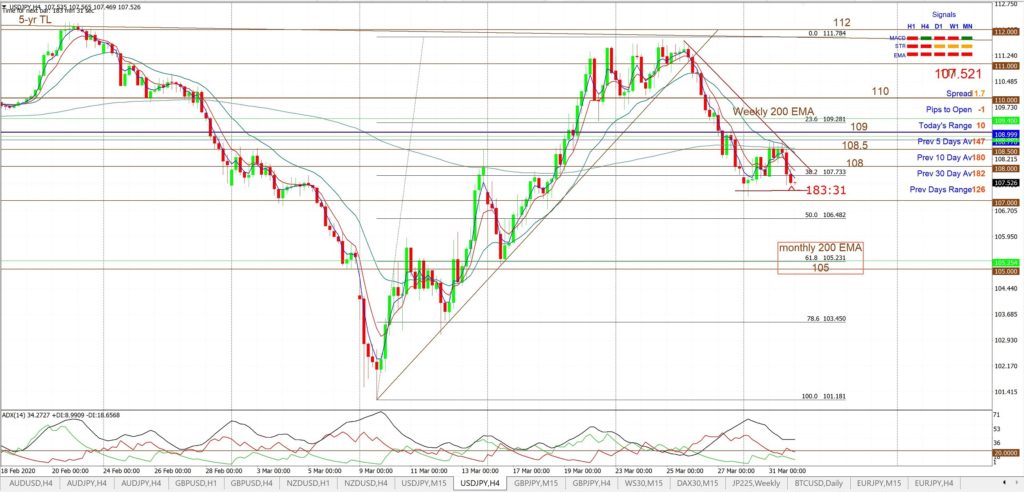
USD/JPY 4hr: watch for any trend line breakout:
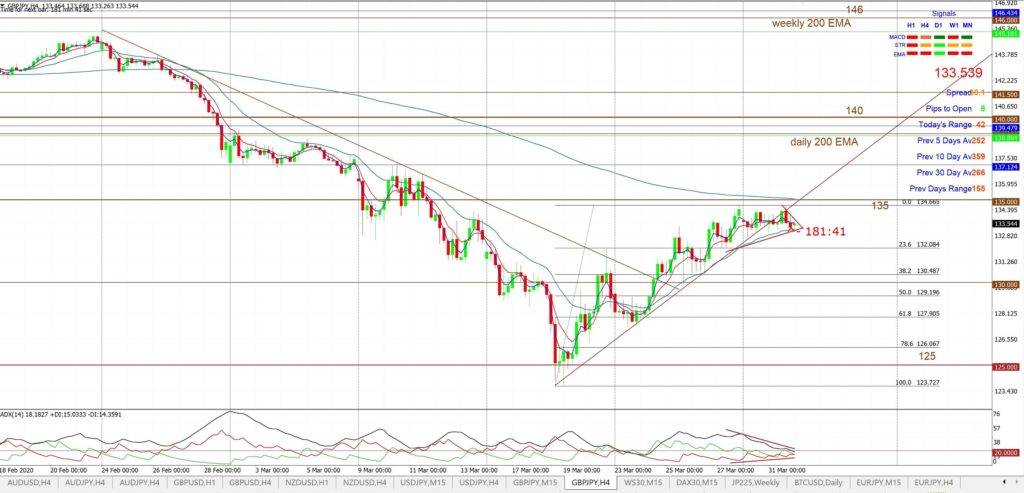
GBP/JPY 4hr: watch for any trend line breakout:


