Gold: Gold has been the major beneficiary of the recent trade war situation and the precious metal has traded higher printing a large, essentially, bullish engulfing candle for the week. Any continued trade war tension would help to underpin this move in Gold which could then flow through to Gold stocks, especially if Gold breaks up through the key $1,400 level. This post contains a review of the charts of Gold and some US and Australian Gold stocks and ETFs with potential bullish targets identified.
Spot Gold Charts:
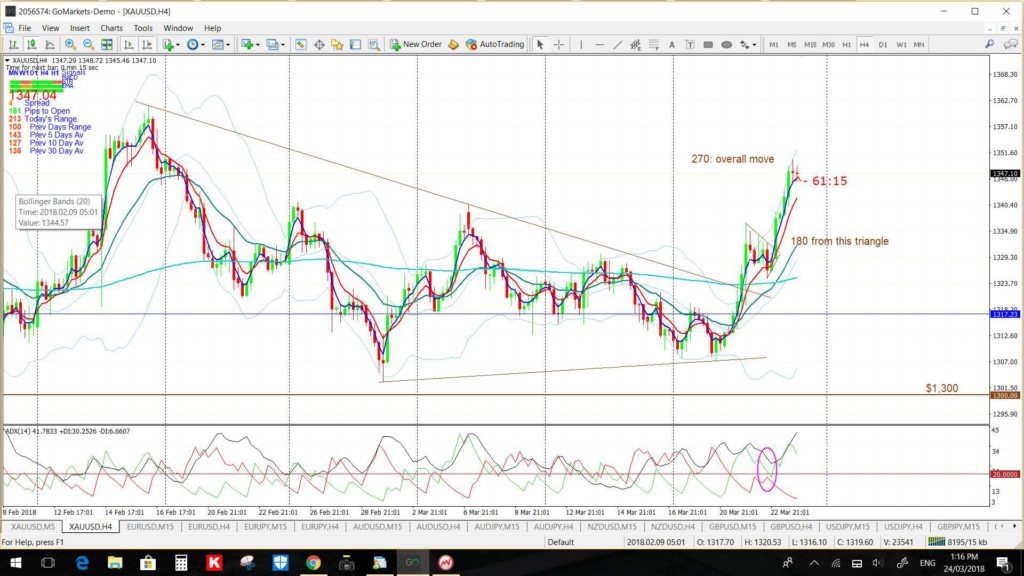
Gold was the major beneficiary of the trade war situation and made a bullish 4hr chart triangle breakout last week for 270 pips with a few TC signals off the 15 min chart along the way!
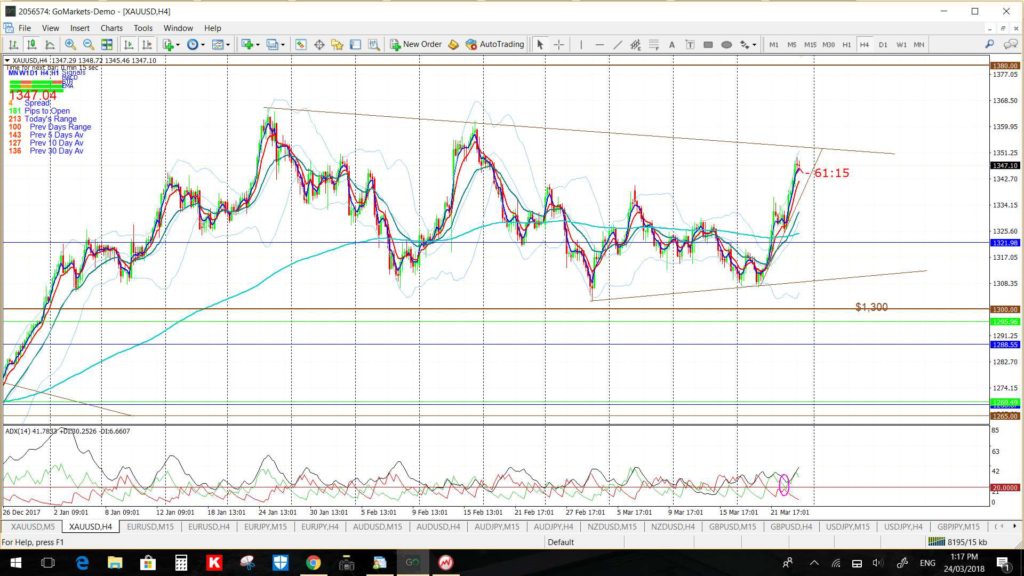
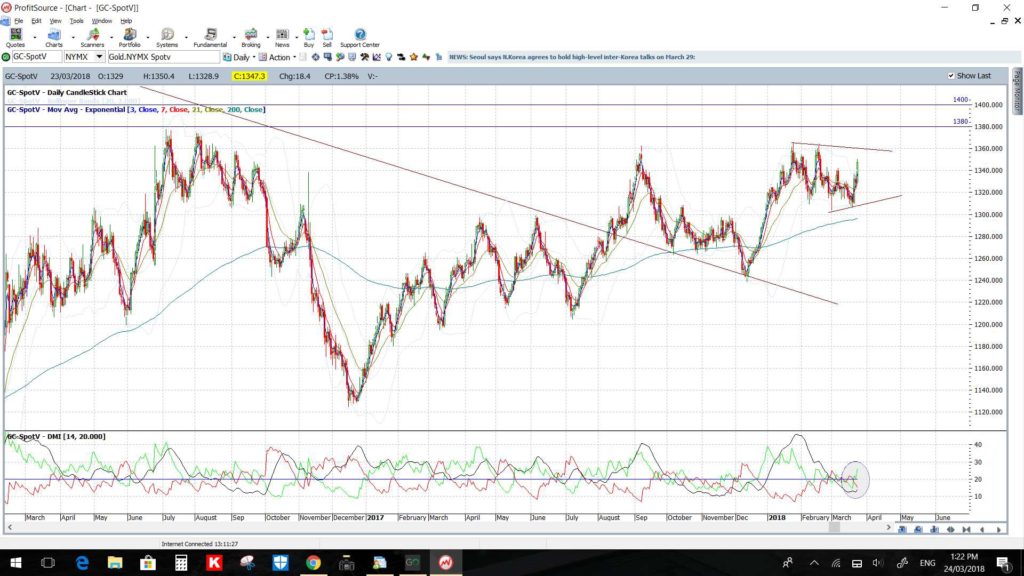
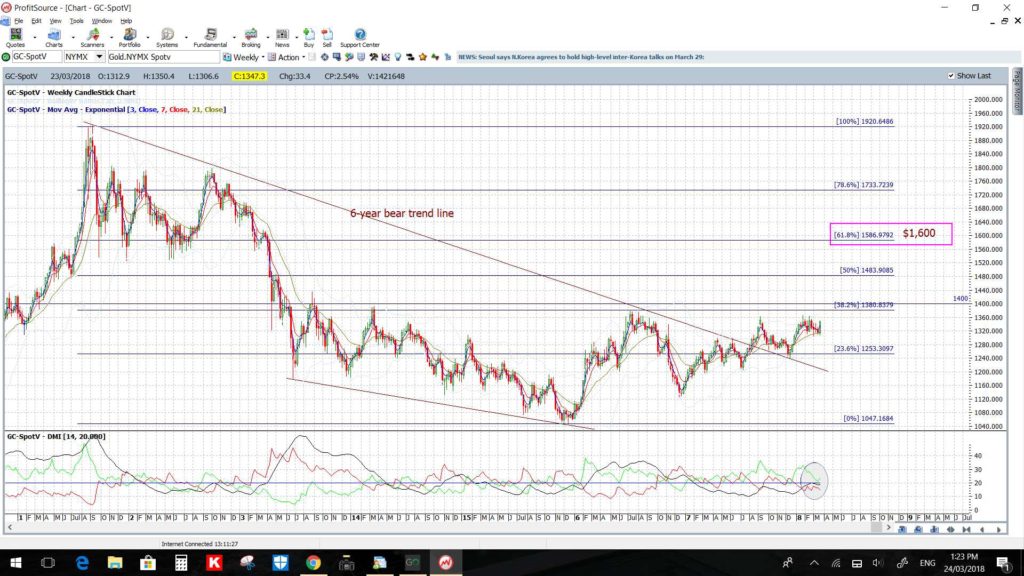
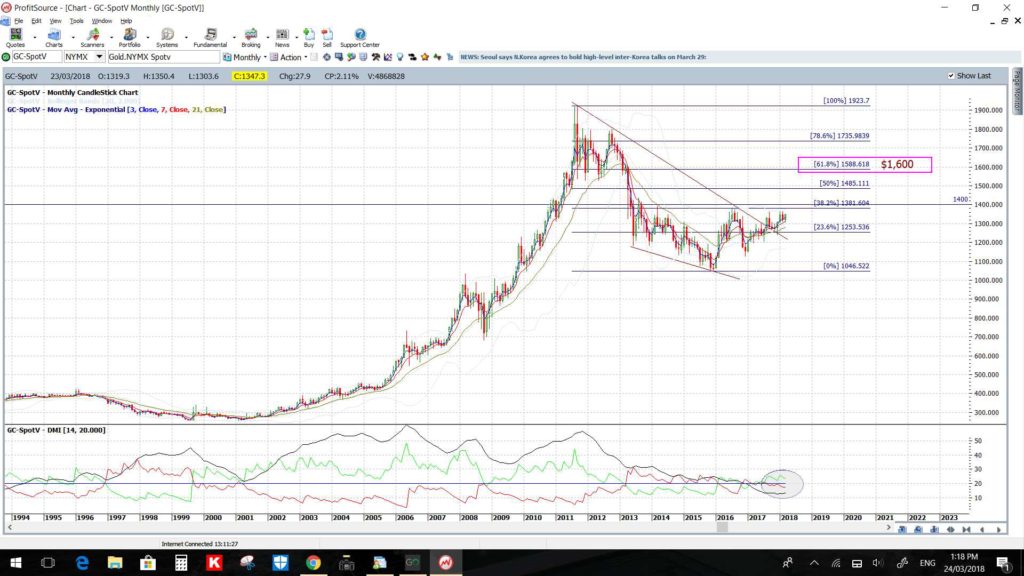
I have revised the 4hr chart trend lines following this breakout so watch for any new trend line breakout in coming sessions. The key $1,380 level lies ahead and the daily chart reveals how this has been a decent S/R region over recent times. The main target though is the key $1,400 level and the monthly chart reveals the significance of this S/R zone. Any break and hold above this resistance zone would be a very bullish move and would bring the $1,600 level into focus as this is the 61.8% Fibonacci level of the 2011-2016 swing low move.
Bullish targets: Any bullish 4hr chart (revised) triangle breakout would have me looking for a test of the $1,380 level followed by the key $1,400 S/R level. The latter target would represent a move worth around 500 pips so is well worth stalking.
Bearish targets: Any bearish triangle breakout would have me looking for a test of the $1,300 S/R level.
- Watch the 4hr chart’s triangle trend lines for any new breakout (click on the charts to enlarge the view):
US Gold Stocks & ETFs:
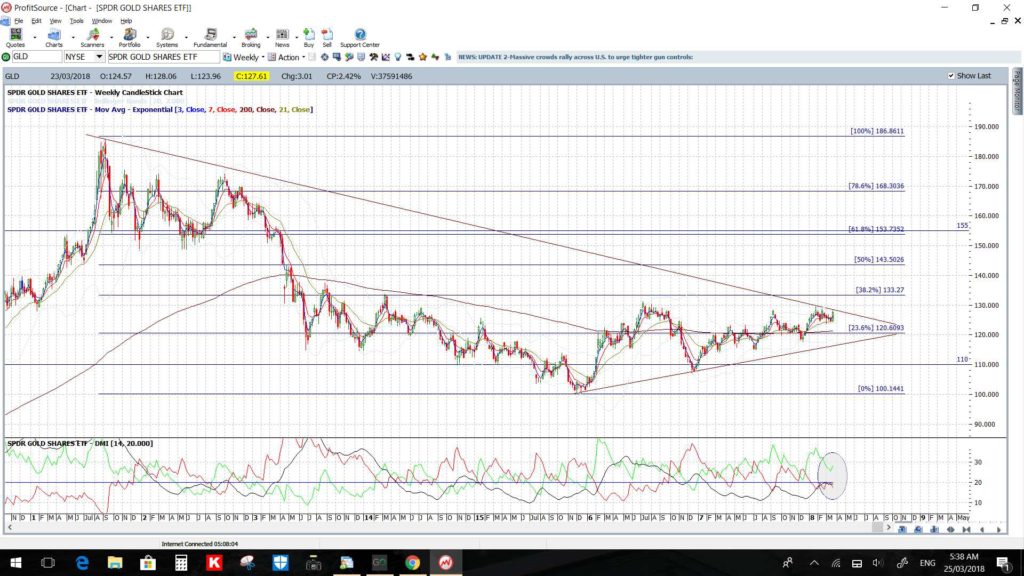
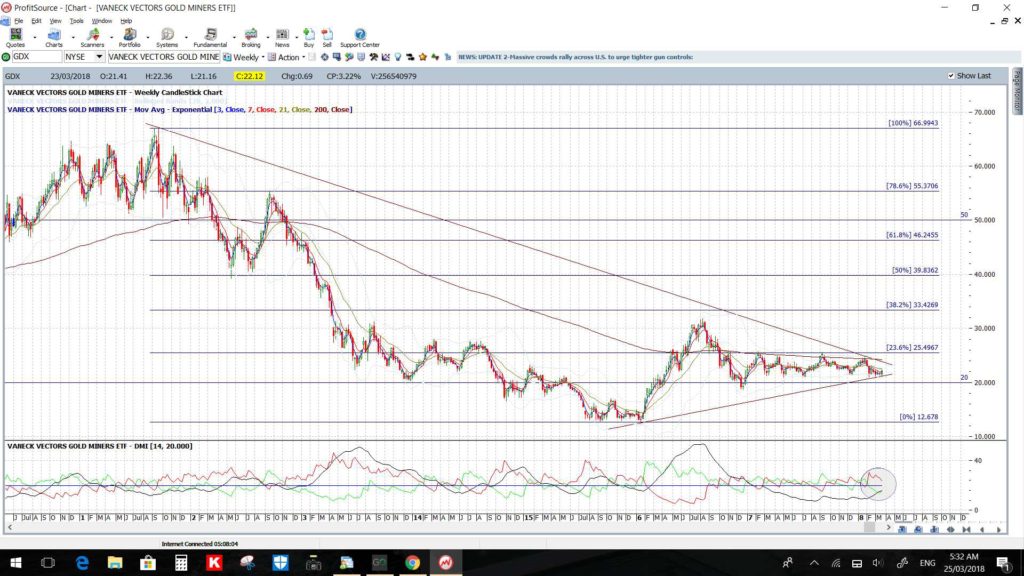
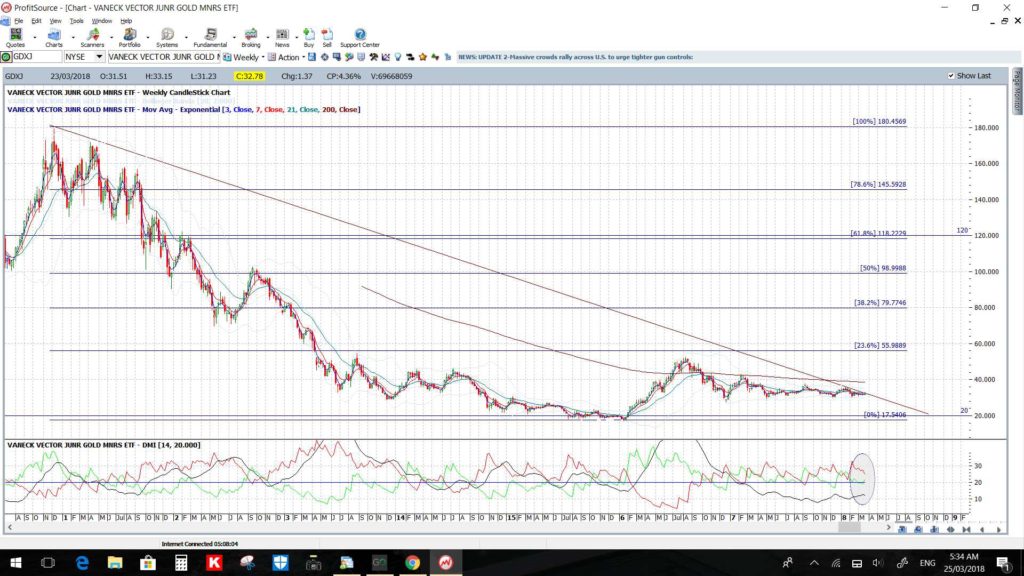
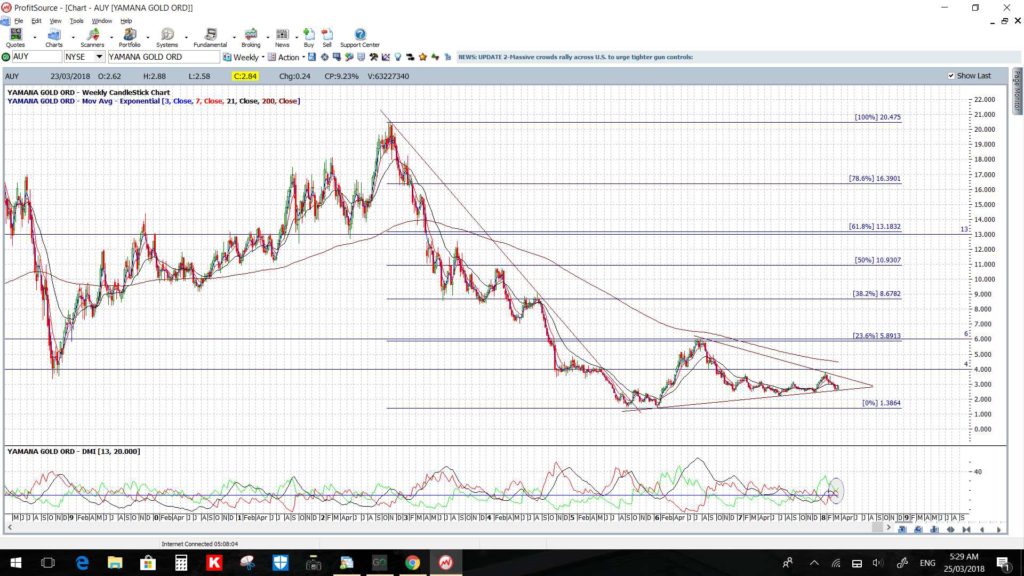
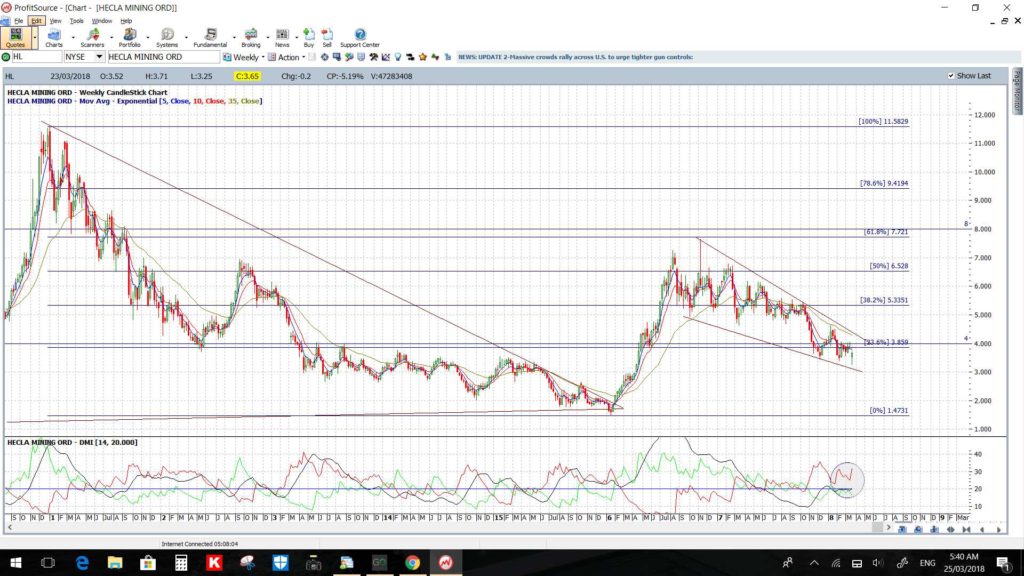
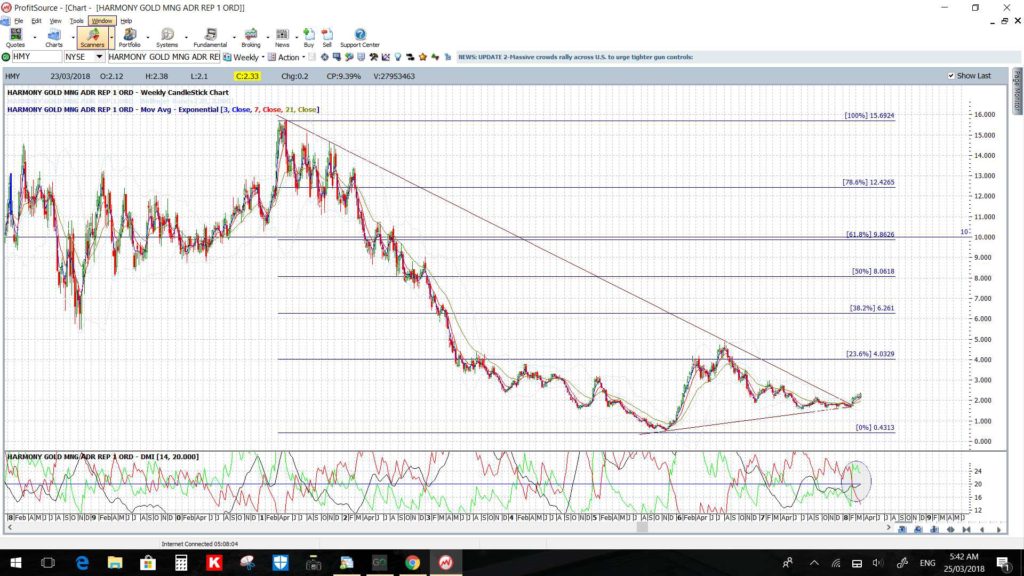
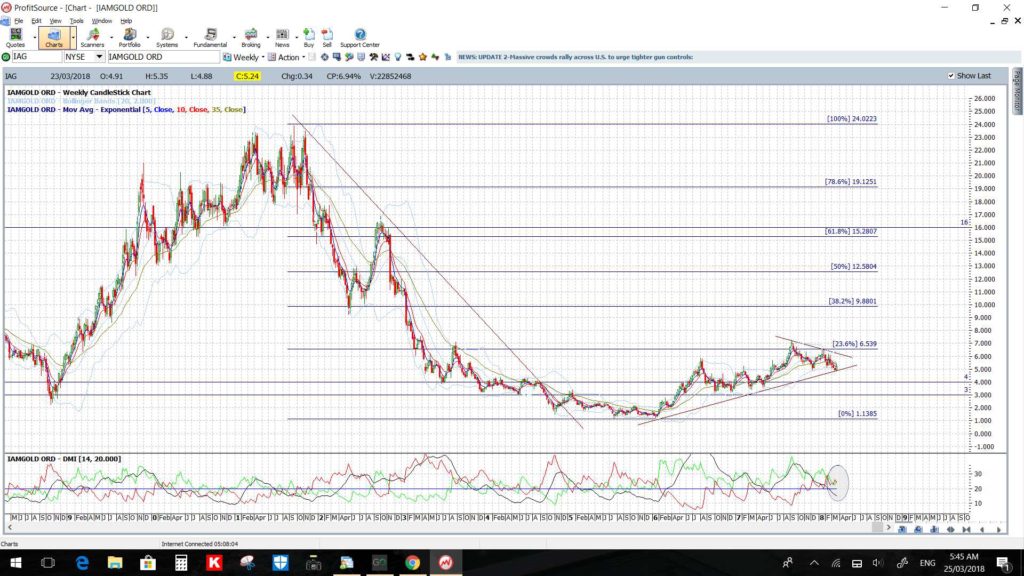
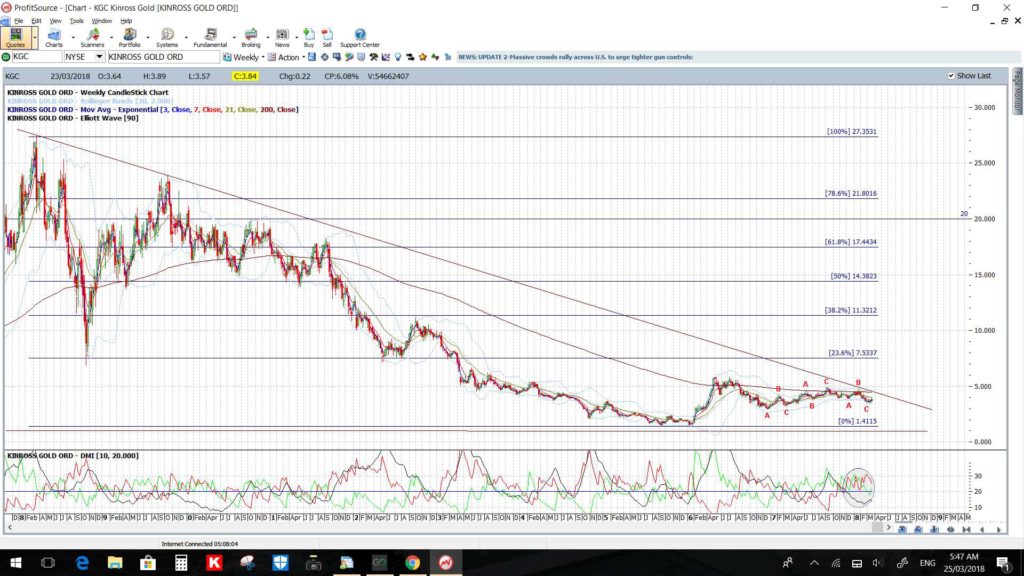
Weekly charts are shown for a range of US Gold stocks and ETFs with relevant trend lines and Fibonacci levels identified as levels to monitor for any new breakout. For each, watch for any:
- new trend line breakout
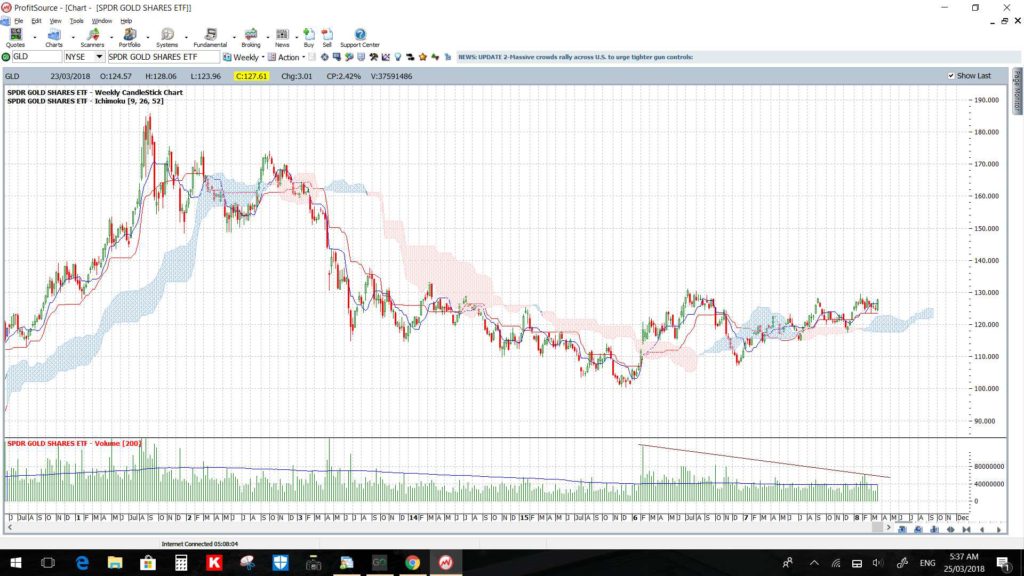
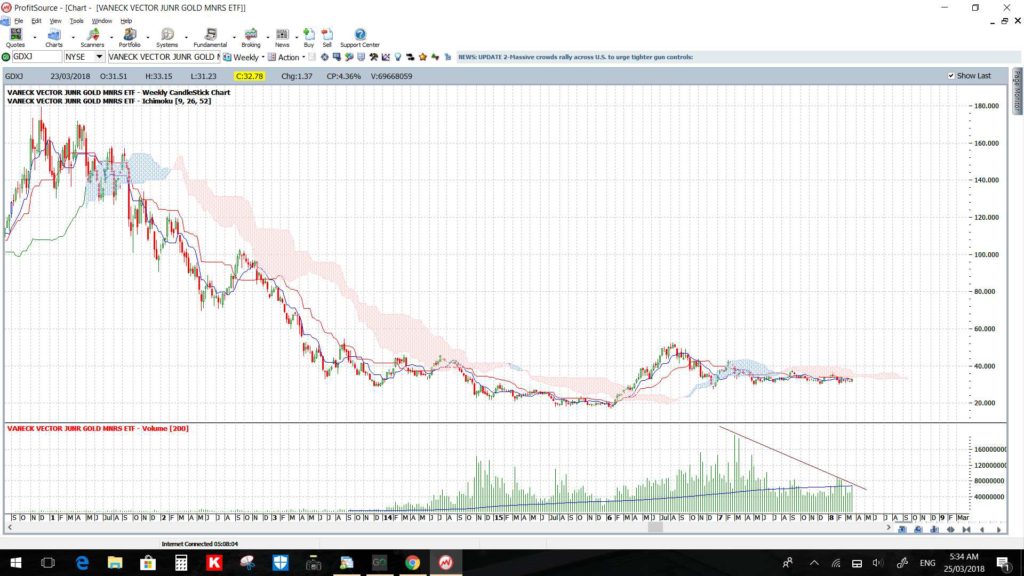
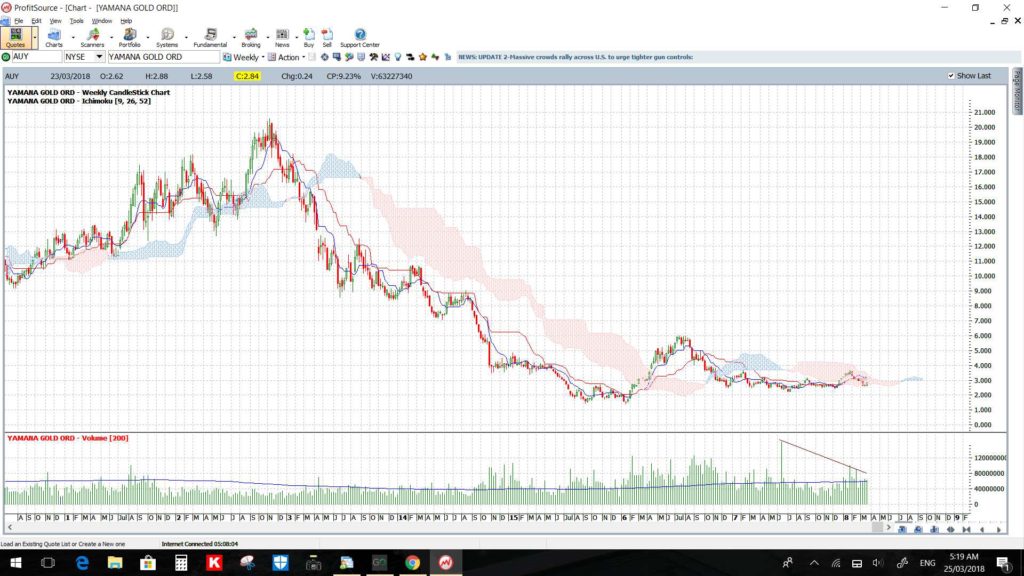
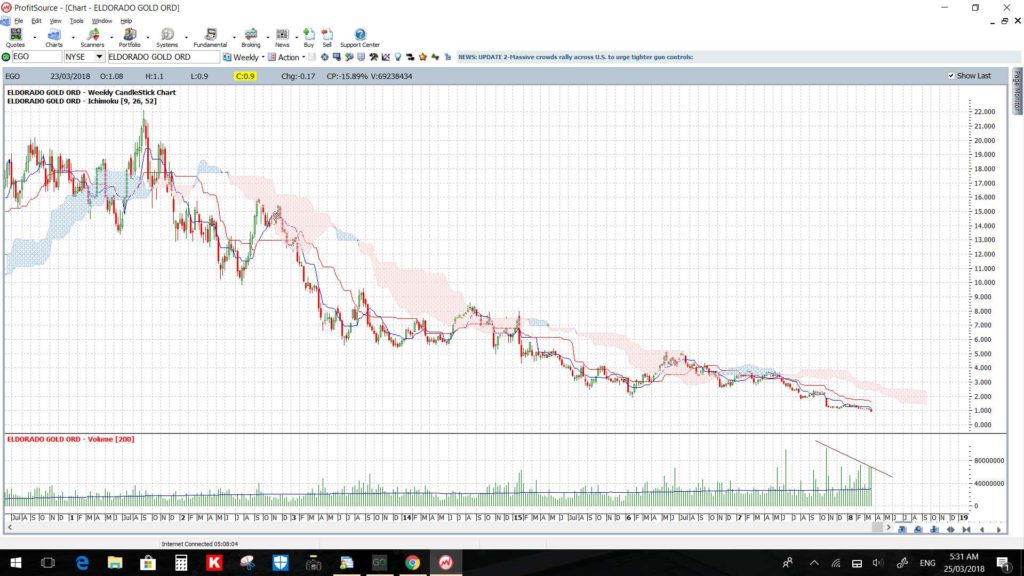
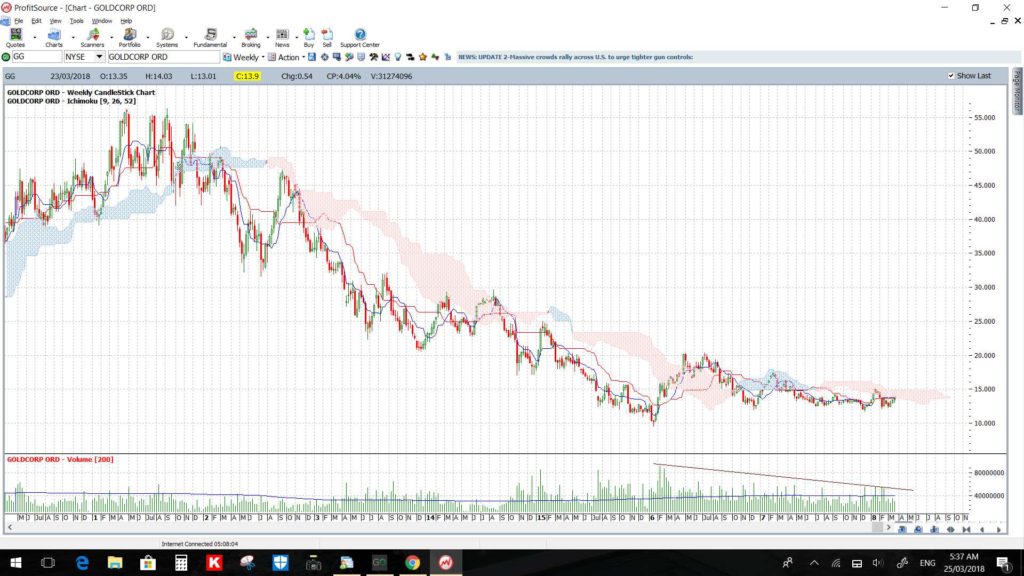
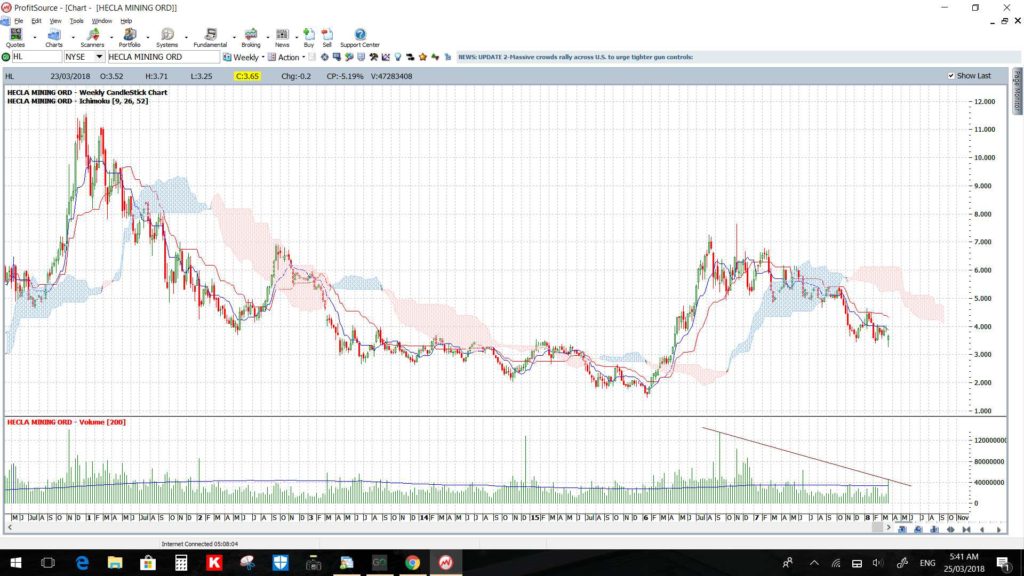
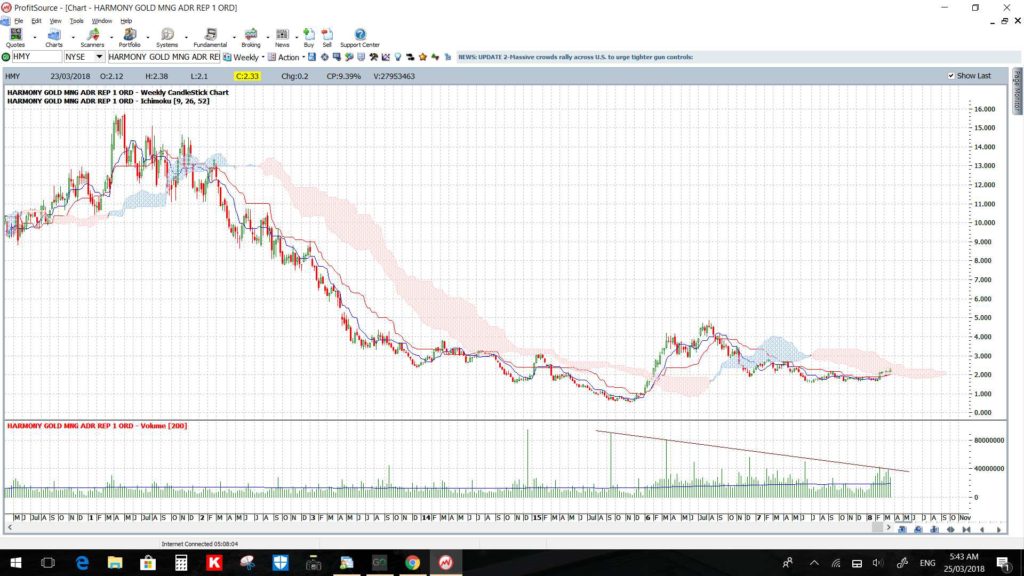
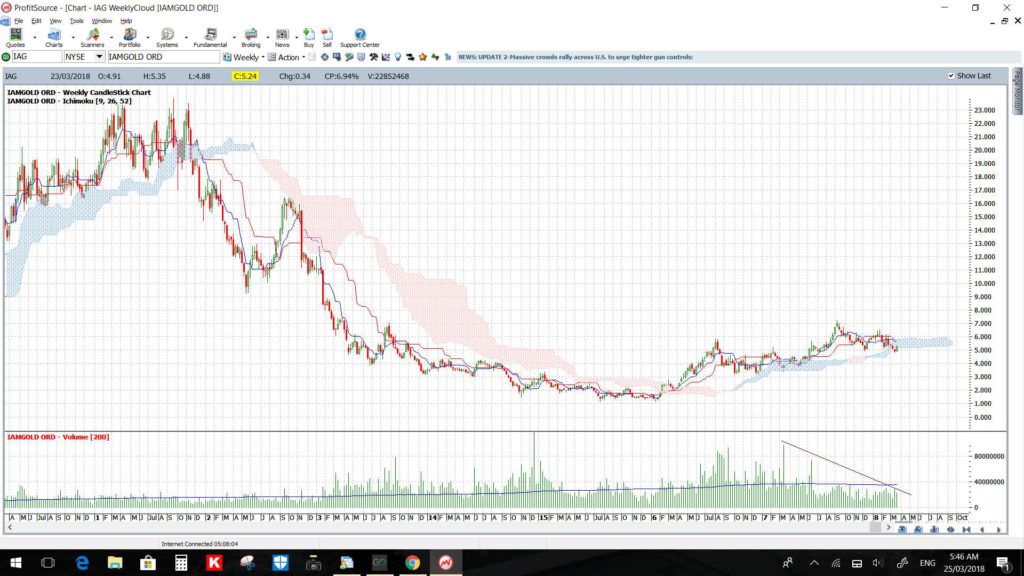
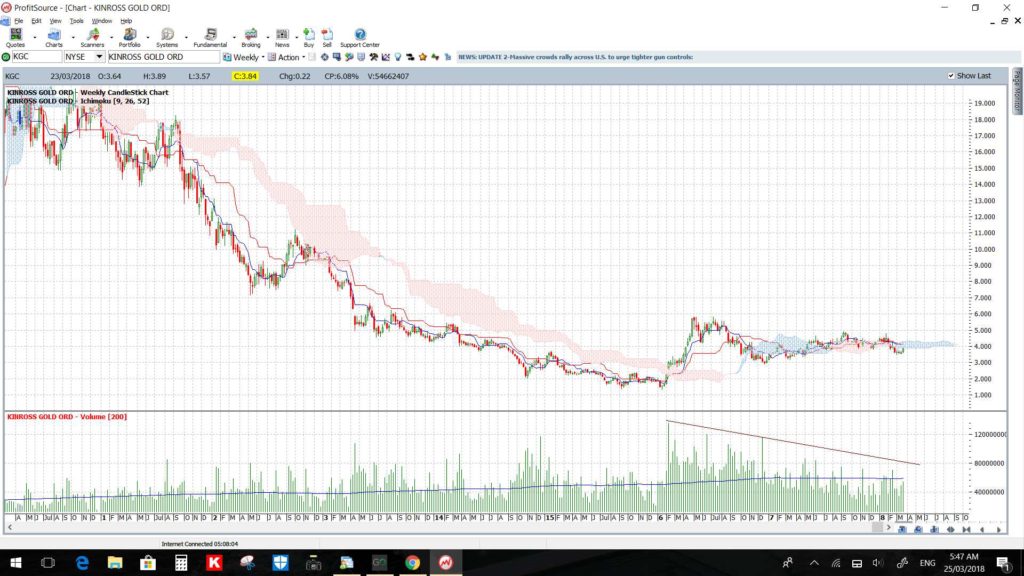
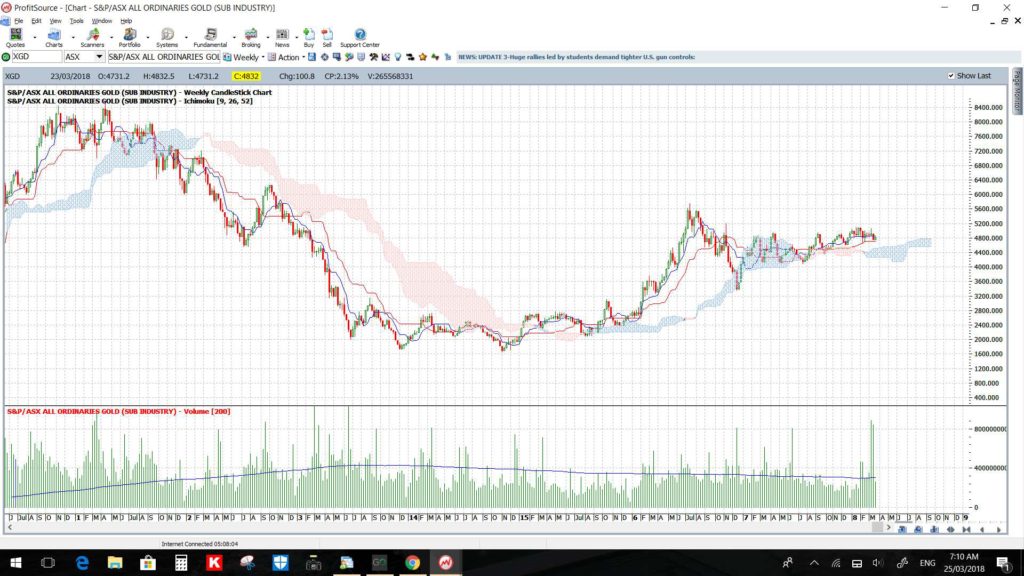
- push above the weekly Cloud
- new Volume spike.
GLD weekly: Gold ETF: Note that the key 61.8% Fibonacci level is up near previous S/R at $155:
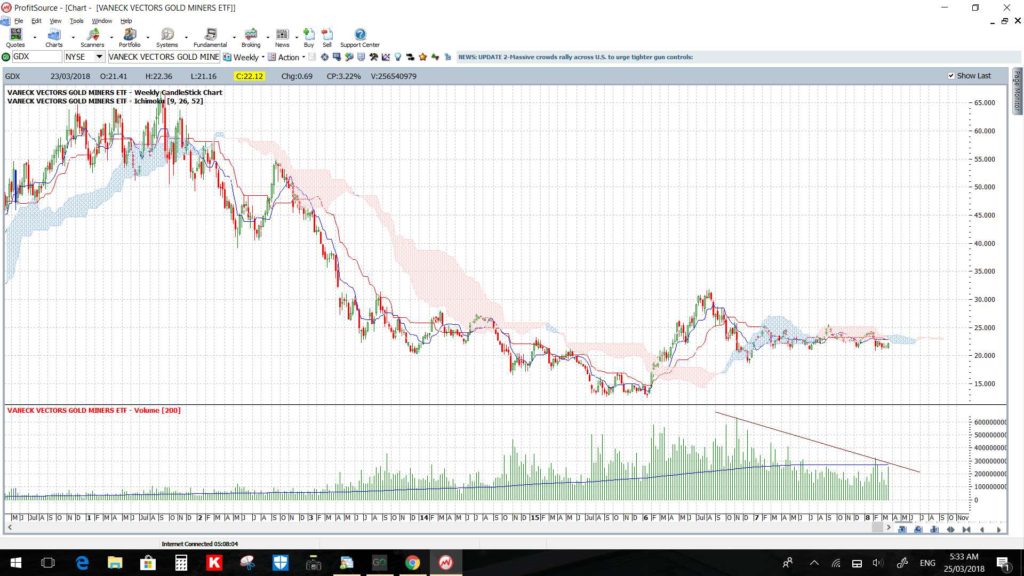
GDX weekly: Gold Miners ETF: Note that the key 61.8% Fibonacci level is up near previous S/R at $50:
GDXJ weekly: Junior Gold Miners ETF: Note that the key 61.8% Fibonacci level is up near previous S/R at $120:
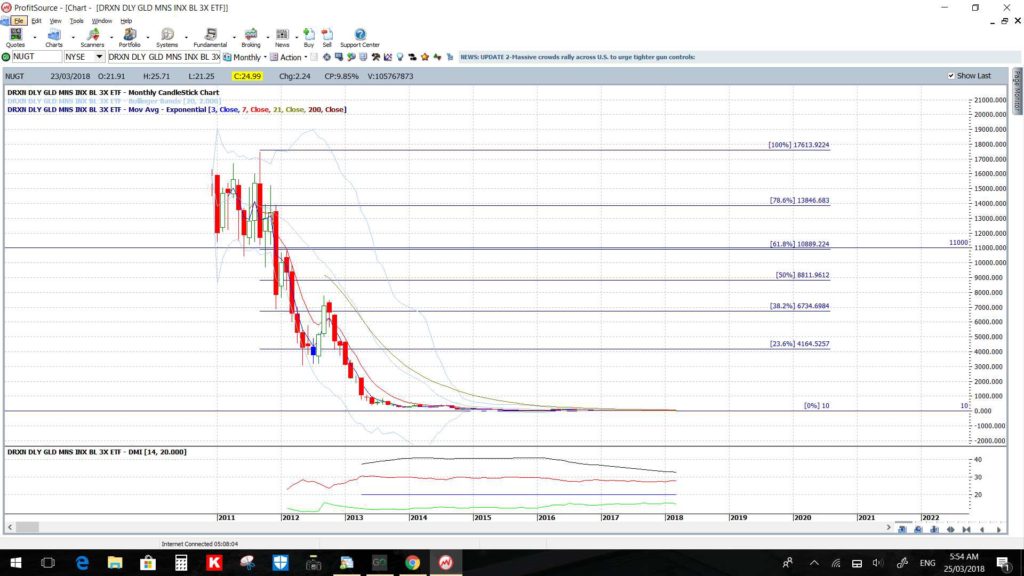
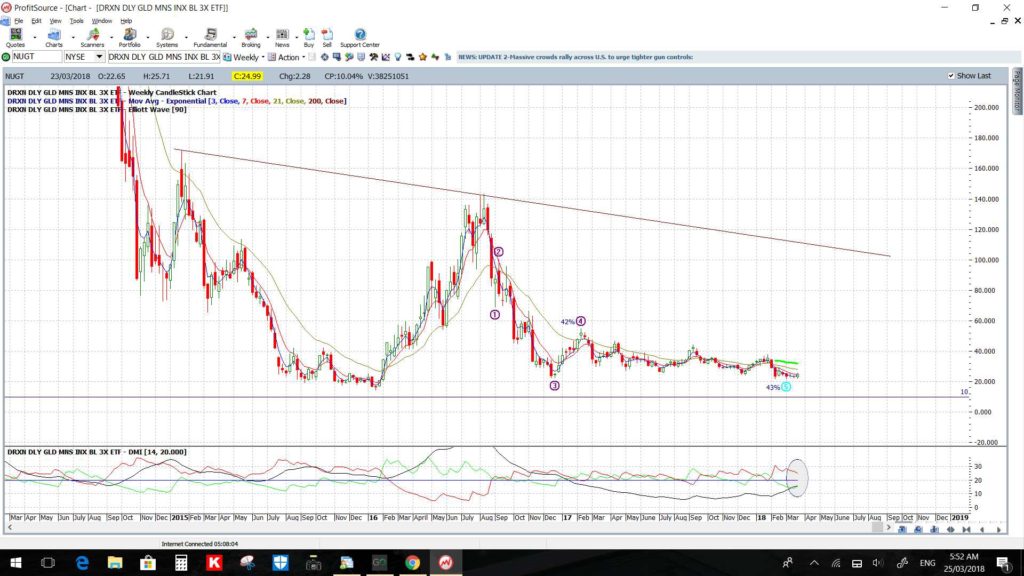
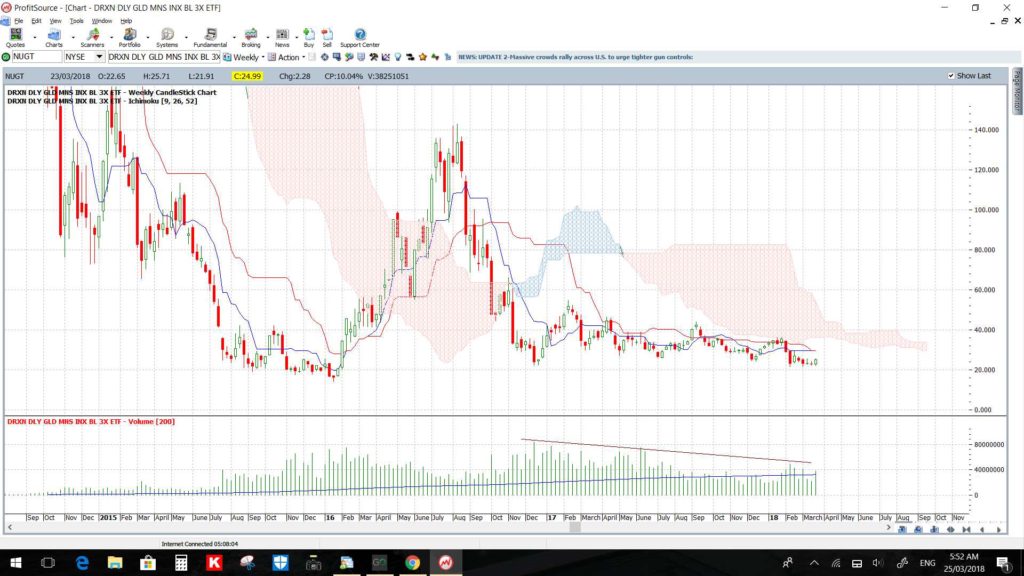
NUGT monthly and weekly: 3 x Bull Gold ETF: Note that the key 61.8% Fibonacci level on the MONTHLY chart is up near previous S/R at $11,000!
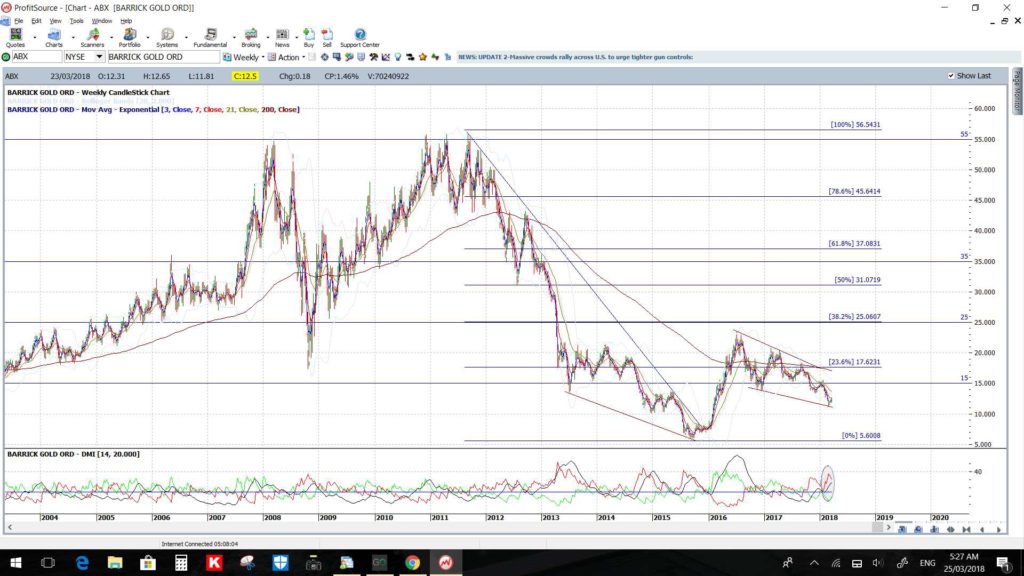
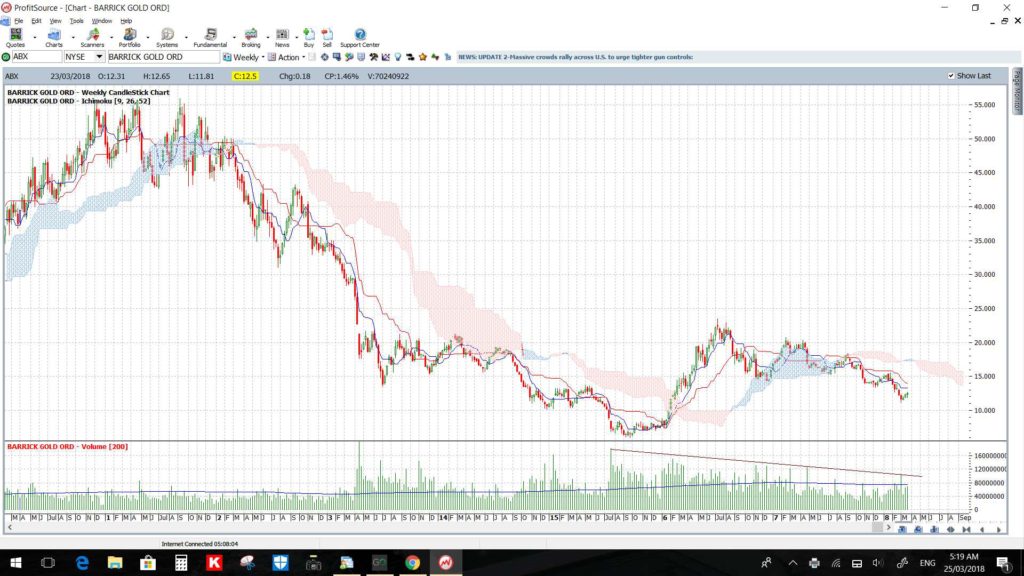
ABX weekly: Barrick Gold: Note that the key 61.8% Fibonacci level is up near previous S/R at $35:
AUY weekly Yamana Gold: Note that the key 61.8% Fibonacci level is up near previous S/R at $13:
EGO weekly: Eldorado Gold: Note that the key 61.8% Fibonacci level is up near previous S/R at $14:
GG weekly GoldCorp: Note that the key 61.8% Fibonacci level is up near previous S/R at $40:
HL weekly Hecla Mining: Note that the key 61.8% Fibonacci level is up near previous S/R at $8:
HMY weekly Harmony Gold: This Gold stock is looking a bit bullish already having made a triangle breakout on increasing momentum. Note that the key 61.8% Fibonacci level is up near previous S/R at $10:
IAG weekly Iamgold: Note that the key 61.8% Fibonacci level is up near previous S/R at $16:
KGC weekly Kinross Gold: Note that the key 61.8% Fibonacci level is up near previous S/R at $20:
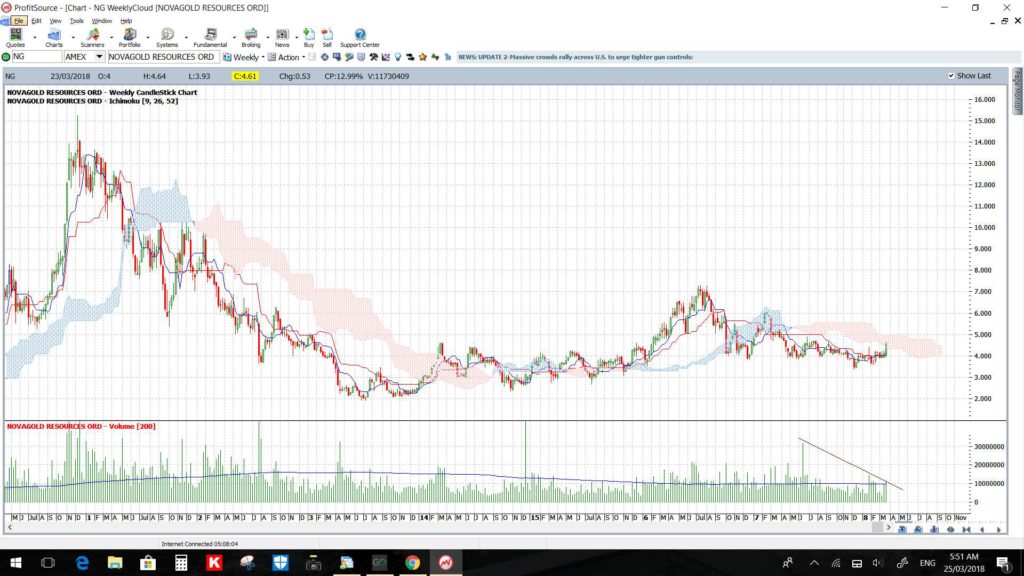
NG weekly NovaGold Resources: Note that the key 61.8% Fibonacci level is up near previous S/R at $12:
Australian Stocks:
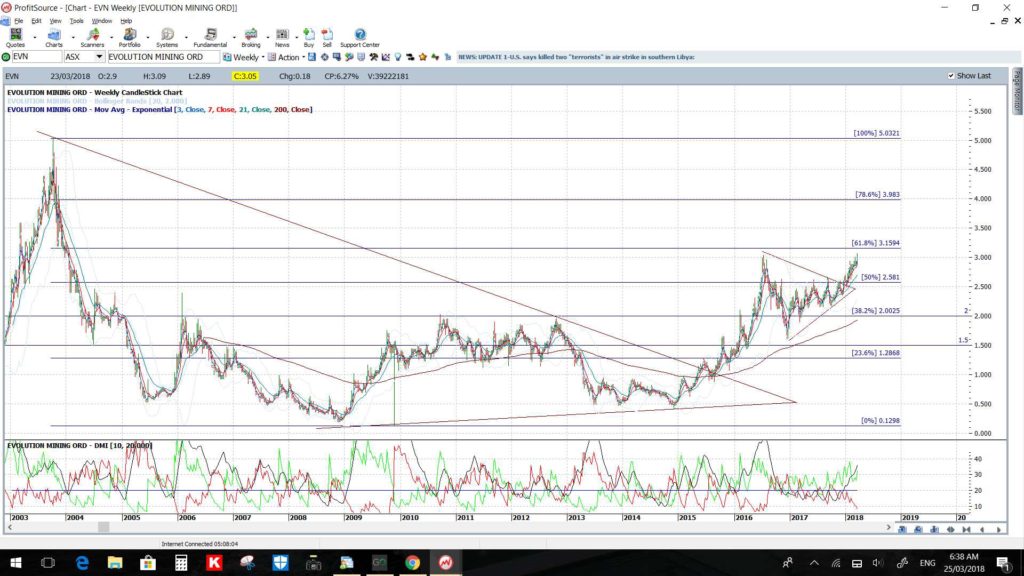
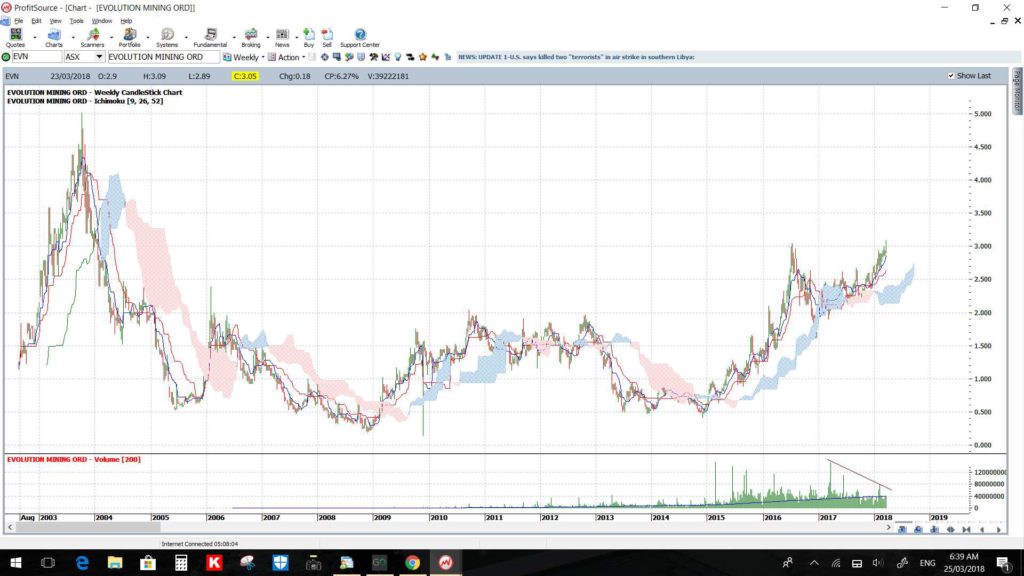
EVN weekly Evolution Mining: price is almost at the weekly 61.8% Fib so watch for a test of the High near the 100% Fib.
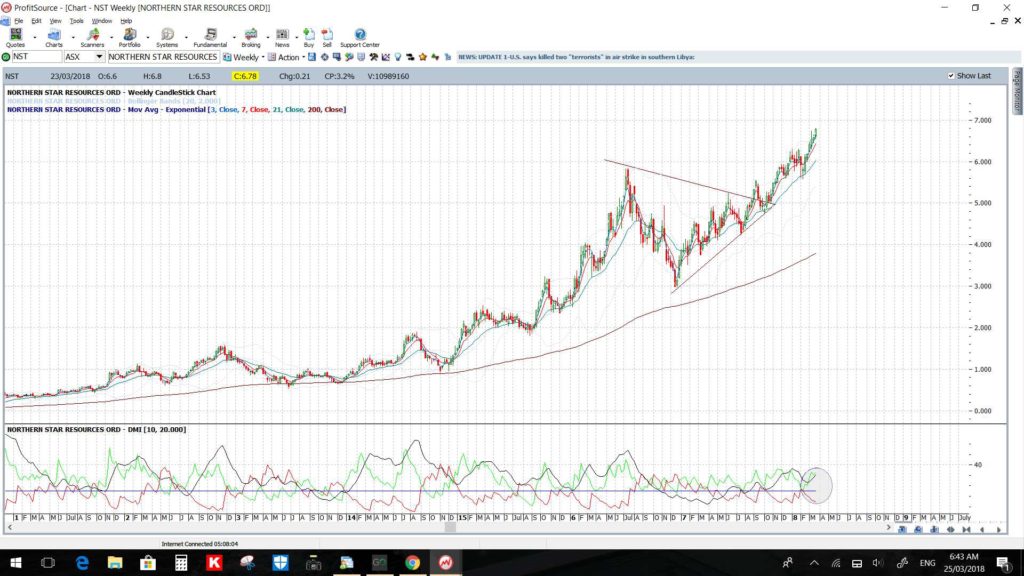
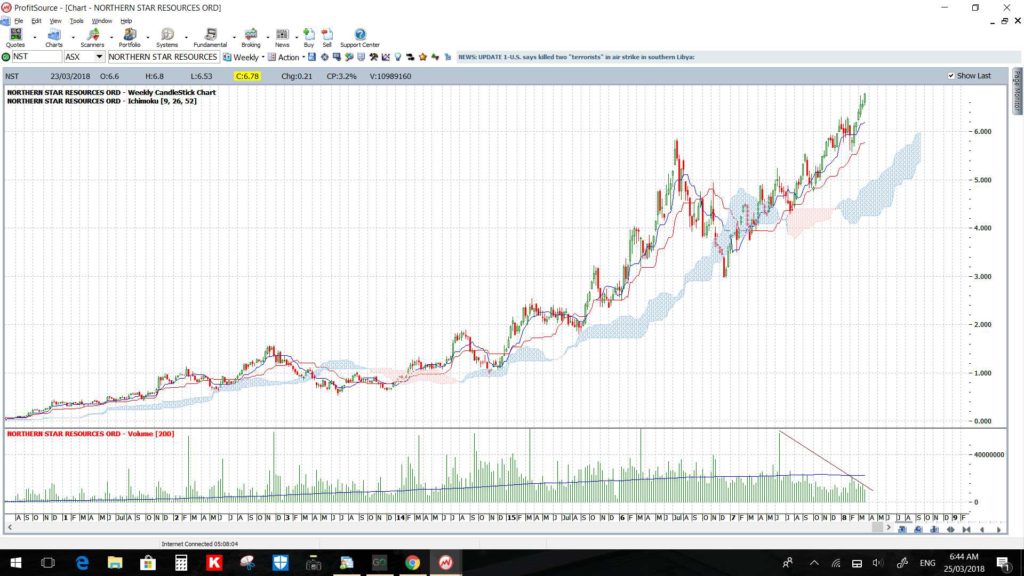
NST Norther Star Resources: this one has already broken out of its congestion pattern:
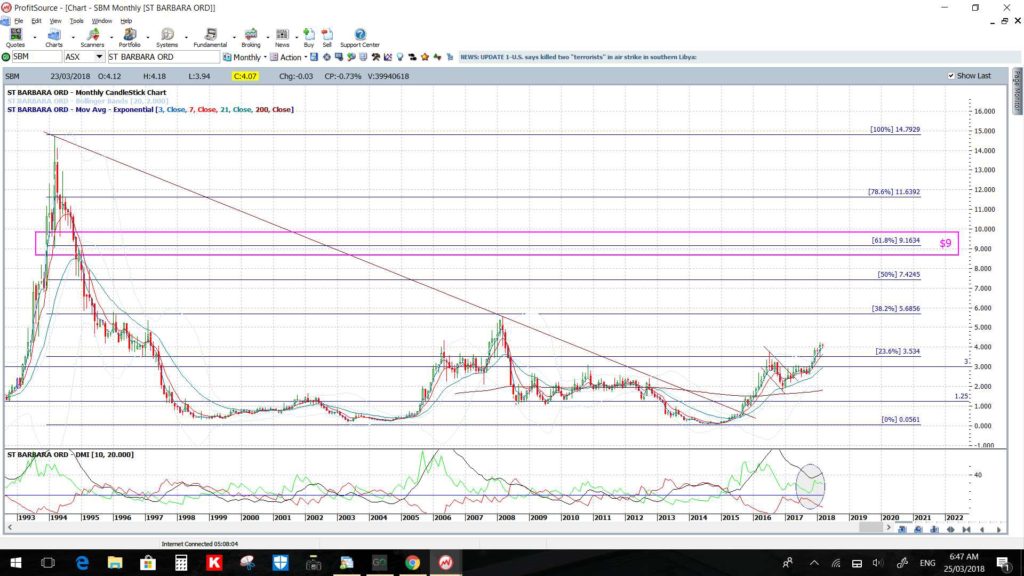
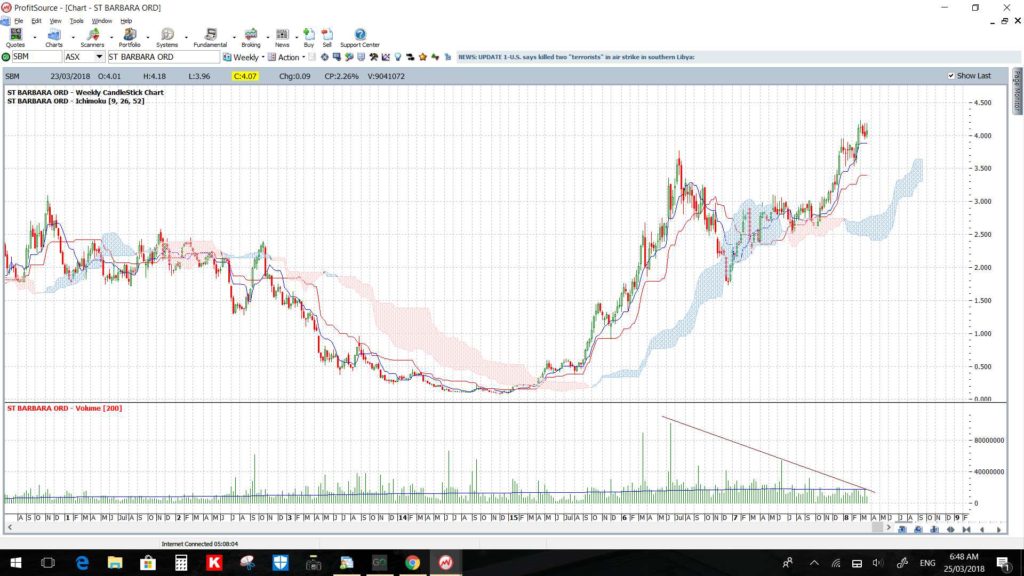
SBM monthly & weekly St Barbara: Note that the key monthly 61.8% Fibonacci level is up near previous S/R at $9:
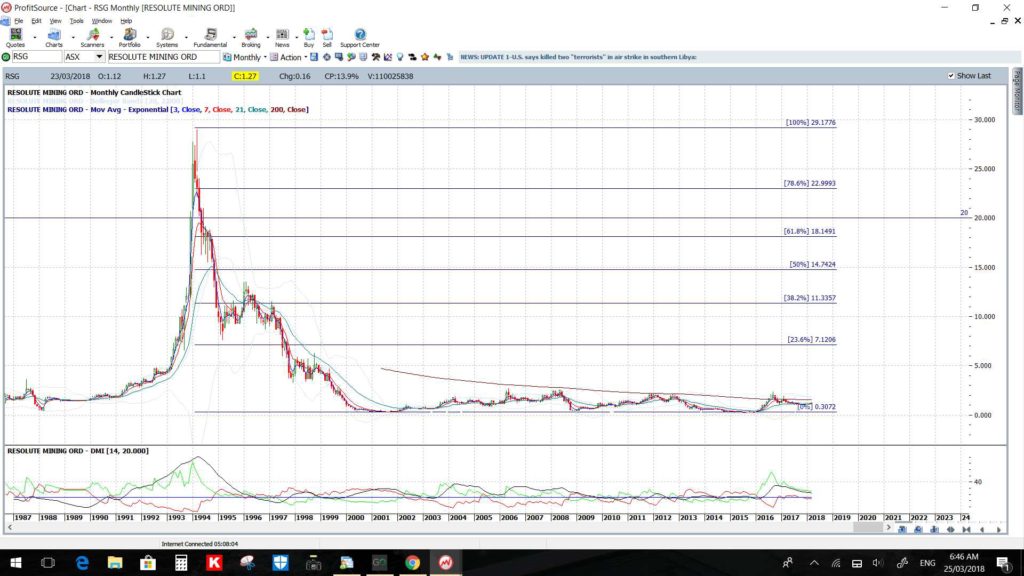
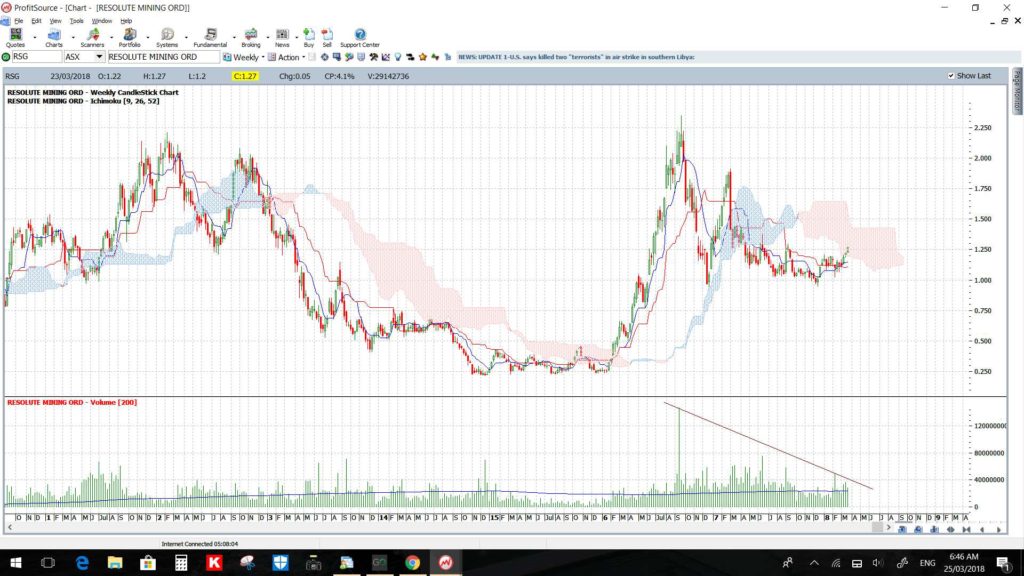
RSG monthly and weekly Resolute Mining: Note that the key monthly 61.8% Fibonacci level is up near previous S/R at $20:
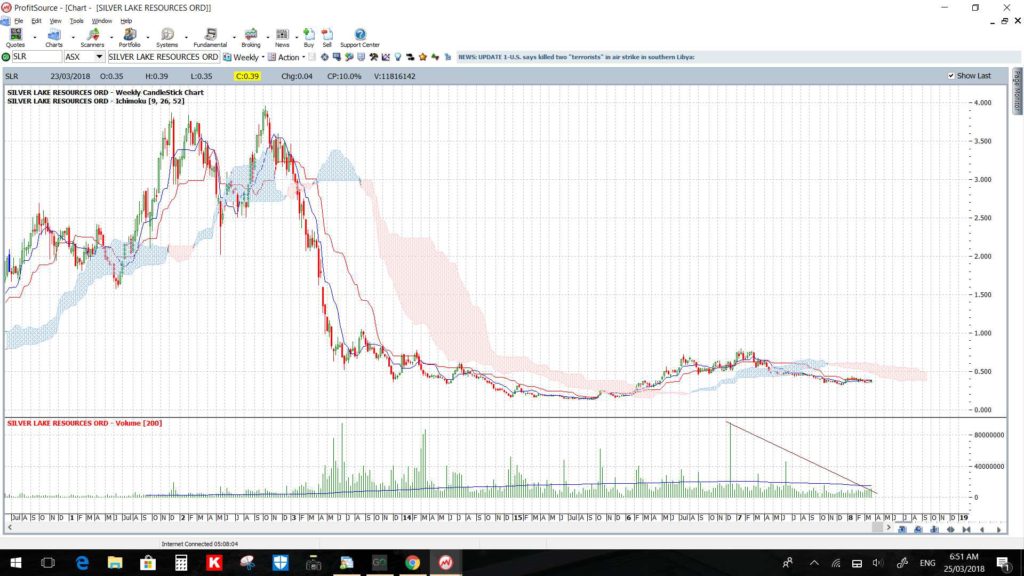
SLR weekly Silver Lake Resources: Note that the key 61.8% Fibonacci level is up near previous S/R at $2.50:
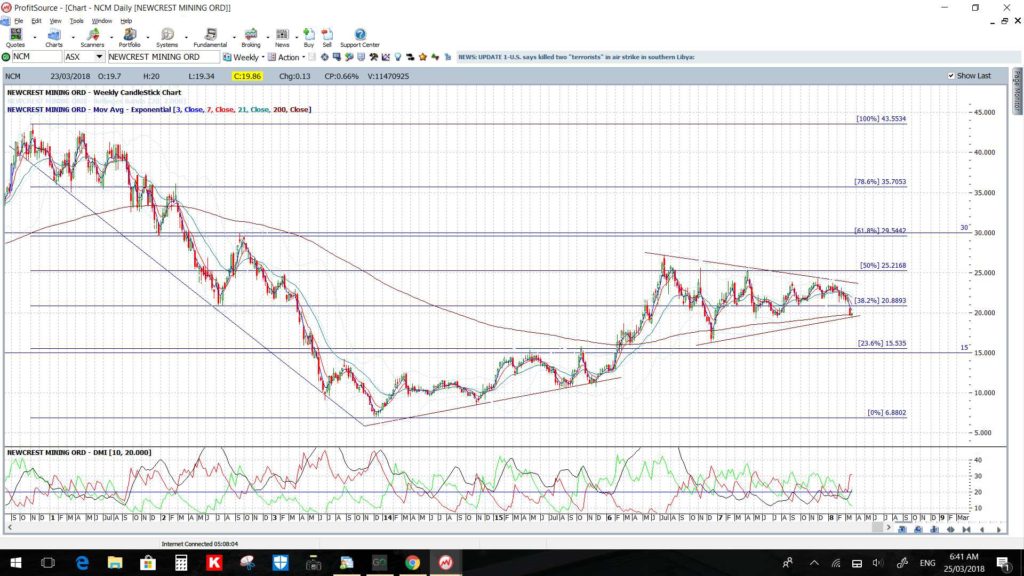
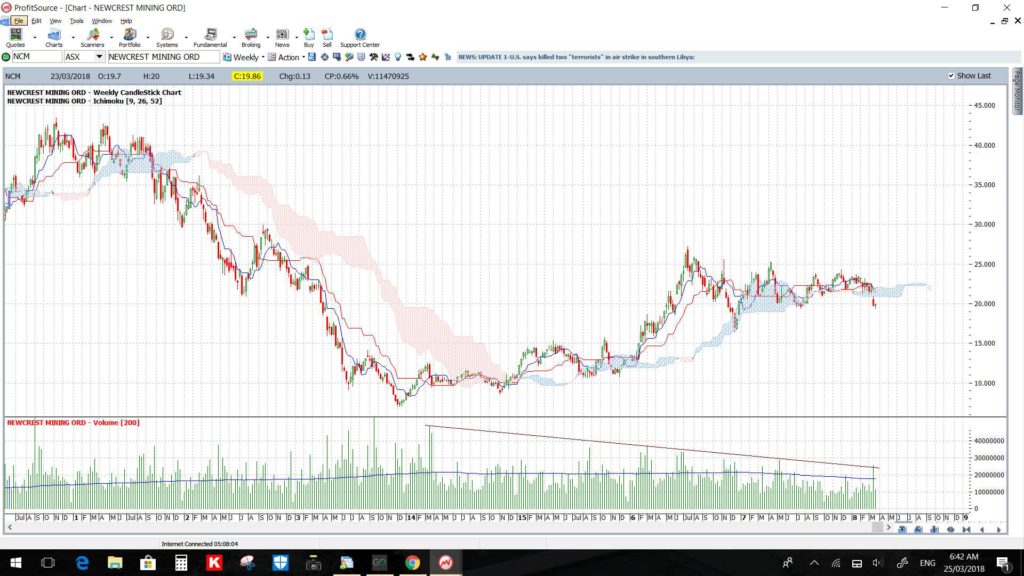
NCM weekly Newcrest Mining: Note that the key 61.8% Fibonacci level is up near previous S/R at $30:
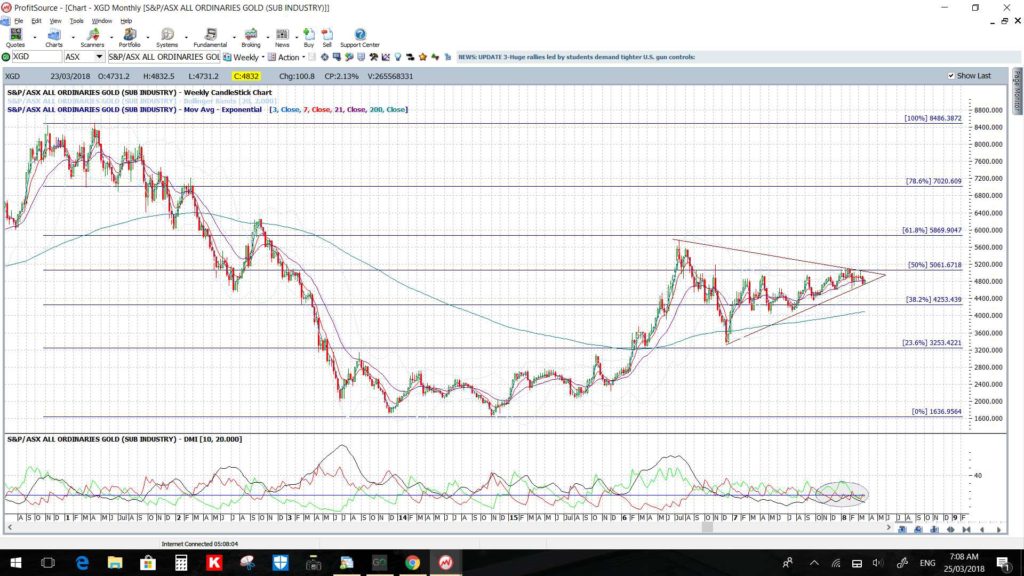
XGD weekly S&P/ASX Gold Index: Note that the key 61.8% Fibonacci level is up near previous S/R at 6,000:


