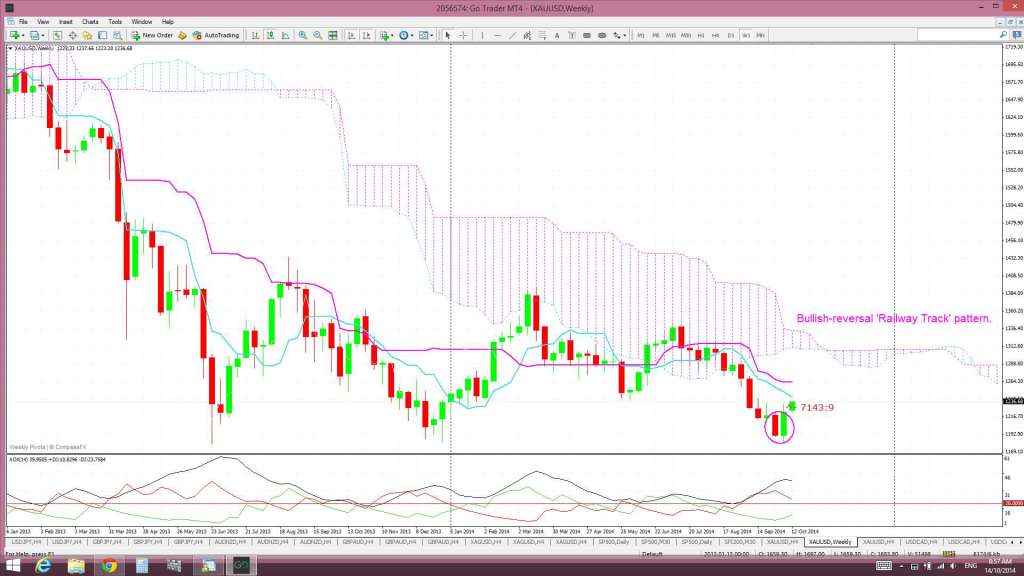
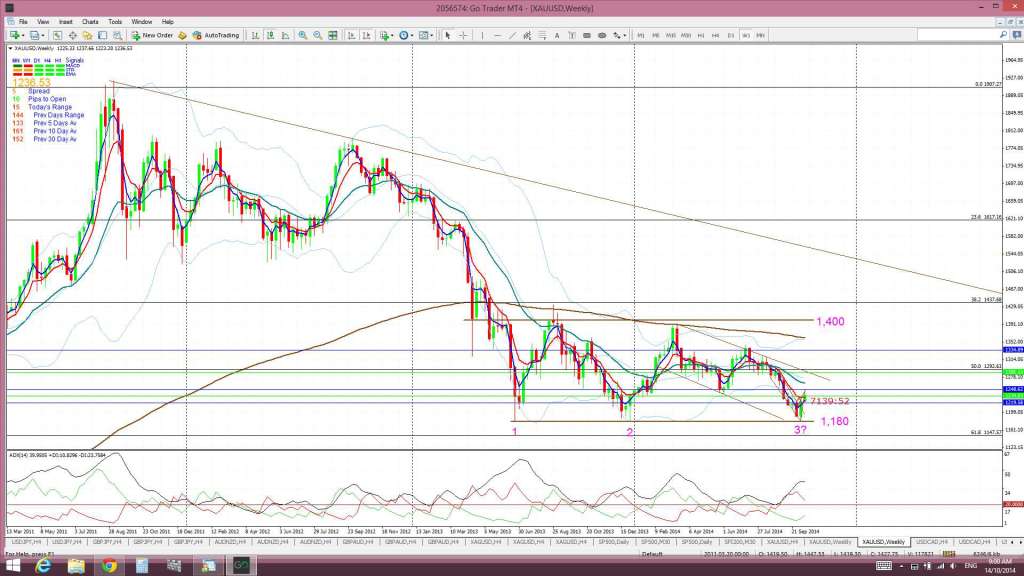
I noted over the w/e how the weekly candle of Gold had closed with a bullish reversal ‘Railway Track’ pattern and this pattern, formed at key $1,180 support, suggested continuation.
Gold weekly: showing the bullish reversal ‘Railway Track’ pattern:
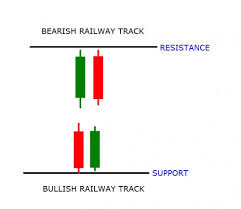
Railway Track patterns:
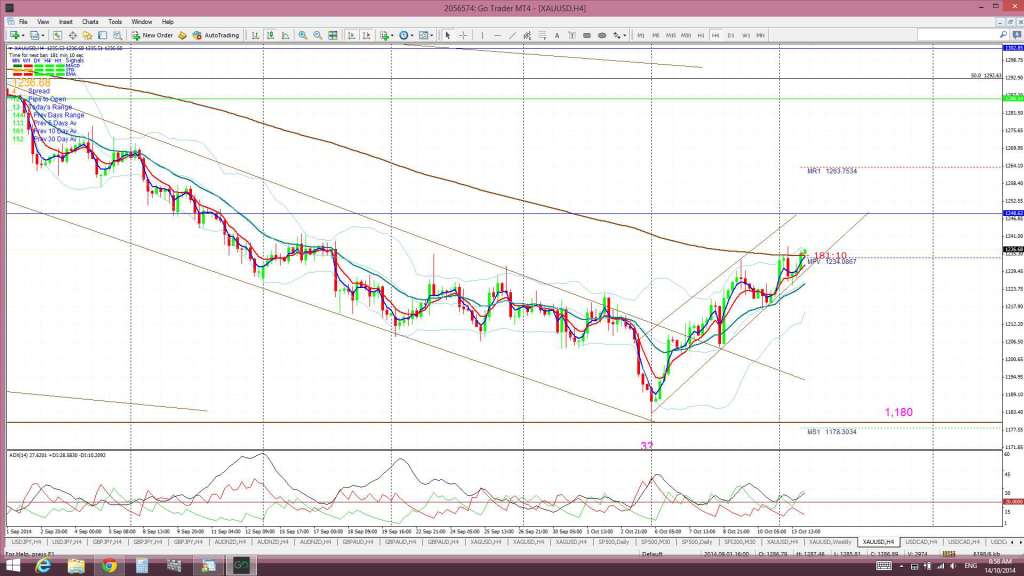
Gold 4hr: the 4hr chart shows that Gold has continued with this bounce up from the $1,180 S/R area and looks like attempting a 4hr close above the 4hr 200 EMA. A successful close and hold above the resistance would suggest continuation:
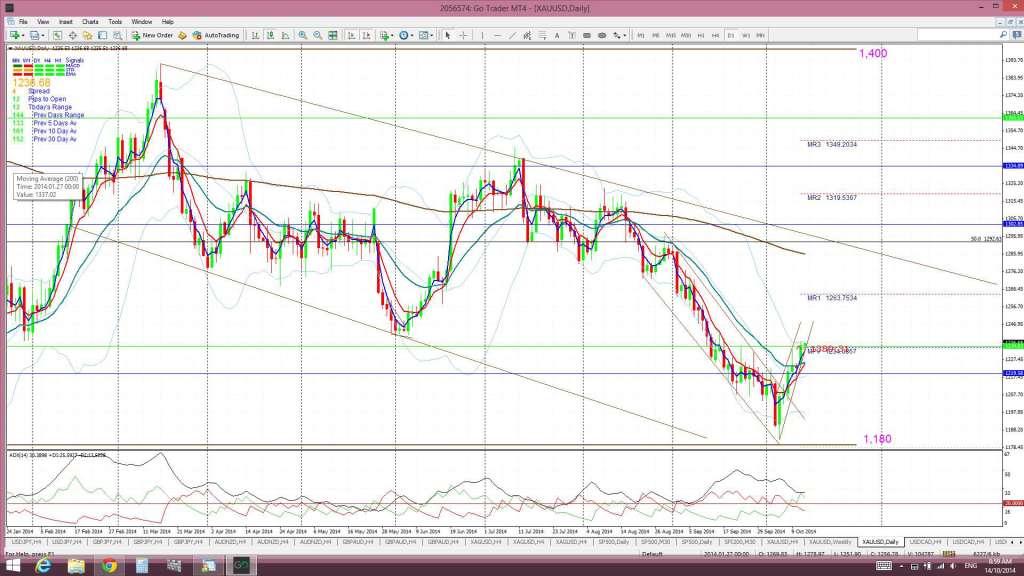
Gold daily: a close and hold above this 4 hr 200 EMA resistance would suggest a move possibly up to test the top of the daily chary’s trading channel near the $1,280 level. This is near the the 50% fib of the 2007-21011 bull run and also near the daily 200 EMA and thus would make a decent level to target:
Gold weekly: the weekly chart show the trading channel that Gold has been within for the last 18 months or so and also the bullish reversal ‘Triple Bottom’. Any close and hold above the daily chart’s channel trend line would suggest a move back up to test the top of this weekly channel at $1,400:
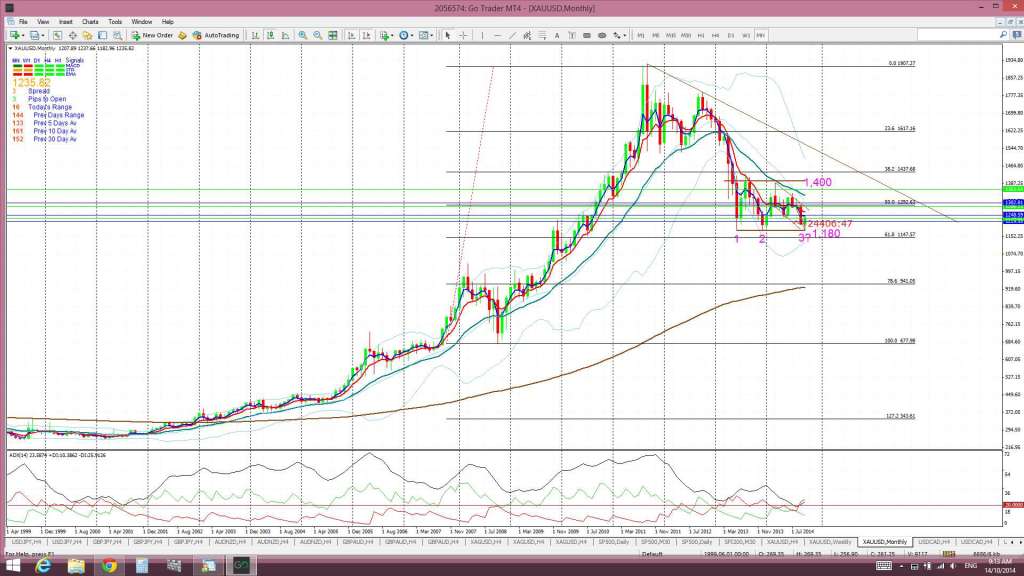
Gold monthly: showing the 50% fib of the 2007-21011 bull run near $1,280. Note also how the 61.8% fib has been support here:
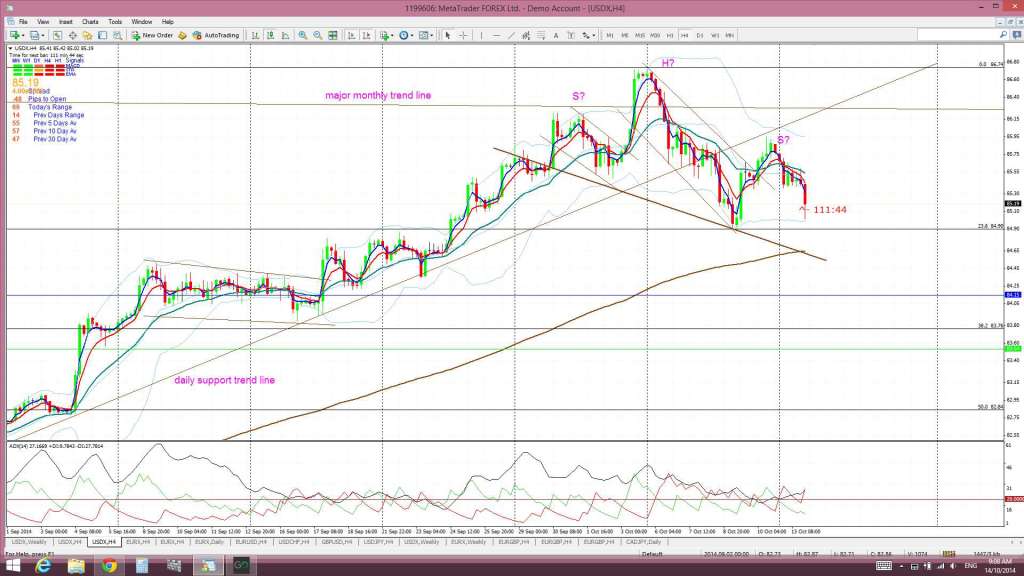
USDX 4hr: USD weakness will help to support a bullish move on Gold and traders need to keep an eye on the USD index. The index looks to be weakening at the moment which is helping Gold but a reversal here could undermine the move on the metal:
Summary: Gold looks to be gaining strength from the weakening USD. Traders need to watch for any close and hold above the above the following key levels to assess potential recovery efforts for the metal:
- 4hr 200 EMA.
- daily chart’s trading channel trend line near $1,280.
- weekly chart’s channel trend line at $1,400.


