The most recent bullish breakout run for Gold started in May 2019. Some commentators are suggesting that we’re only now starting to see a new bullish era for the precious metal but others suggest this rally is well overdone. In this post I review the charts of Gold from a technical perspective and consider bullish and bearish targets from its current position. I’ve been monitoring Gold for many years and noted a recent trend line breakout having a target at $1,600. Price action is not far below this level now but the bullish rally looks like it might be starting to stall. I would expect price to pause, or even pullback, at this major resistance zone and I offer new levels of interest to monitor.
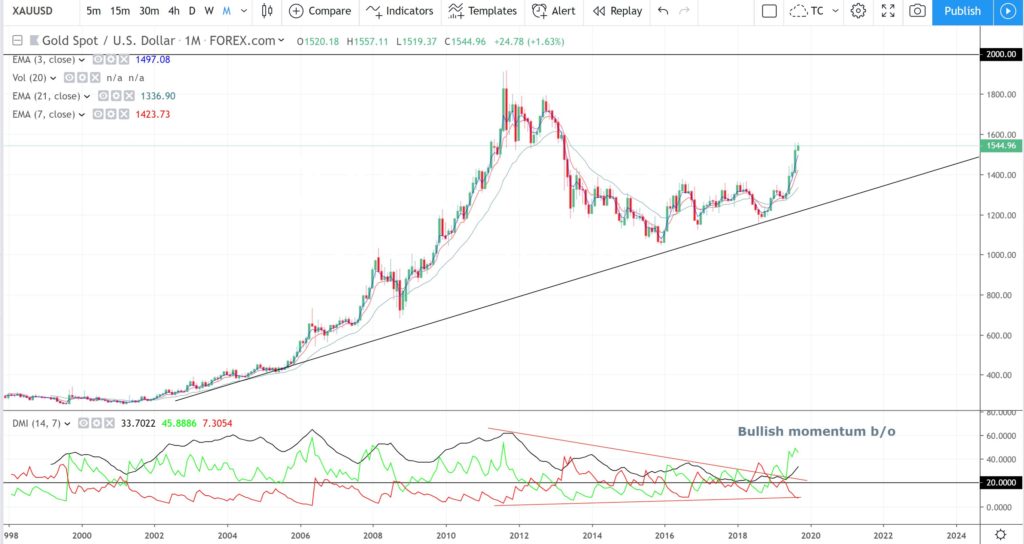
Gold monthly: This Trading View monthly chart of Gold shows the all time High as $1,920.70. The psychological whole-number $2,000 is just above this level. Any bullish continuation from current levels would bring the whole-number levels on the way up to the previous High and, then, $2,000 level into focus.
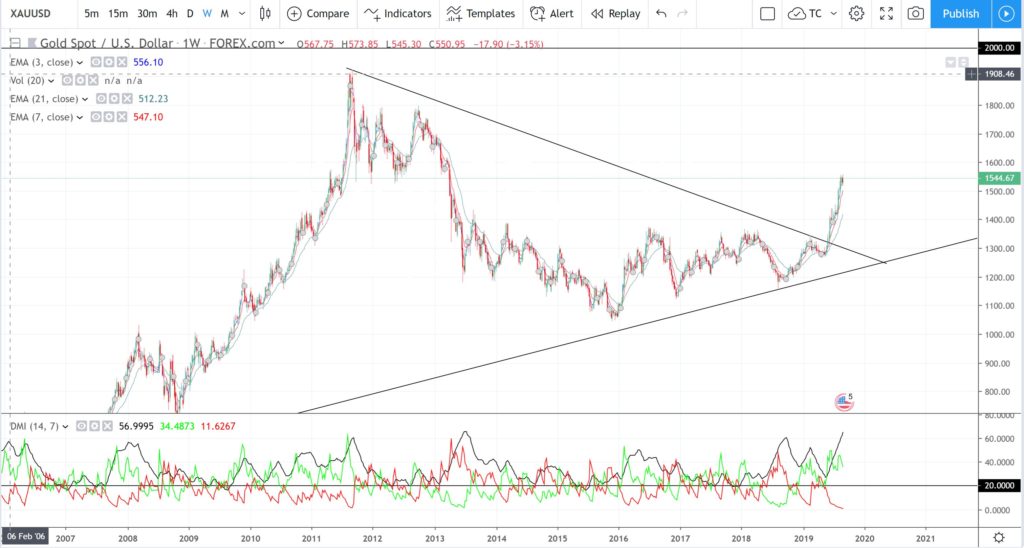
Gold weekly: this weekly chart shows a bullish trend line breakout I was stalking back in June and this breakout is now well underway.
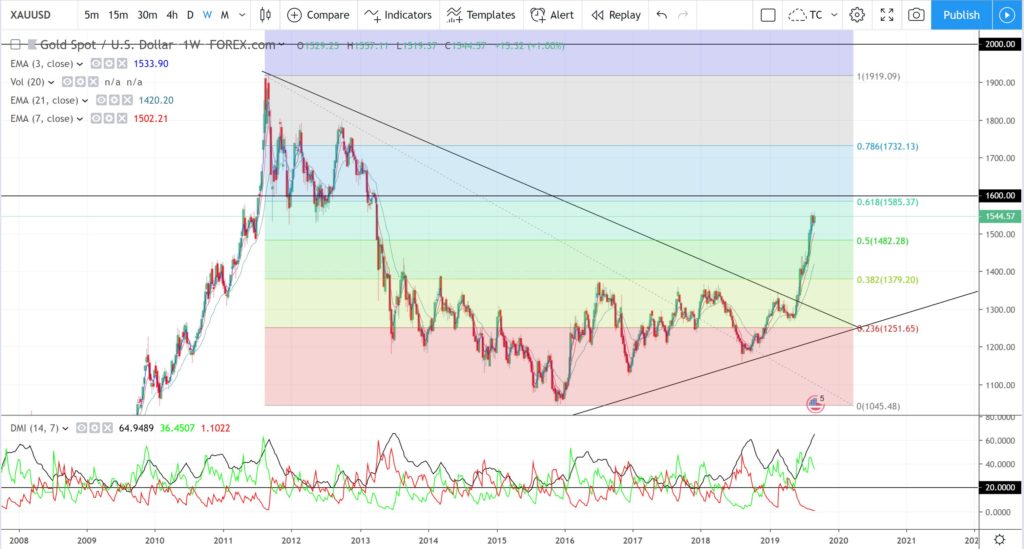
Gold weekly + Fibonacci (swing Low): Fibonacci retracement has been placed on the Aug 2011- Dec 2015 swing Low move. The key 61.8% Fibonacci level of this move is up near the whole-number $1,600 level and so this has been my target for the trend line breakout move. Last week’s candle though, on this software, was a bearish-reversal Hanging Man style candle and in my weekly update I had warned traders to watch for any pause or potential pullback from here, despite the fact we have not quite reached the $1,600 target:
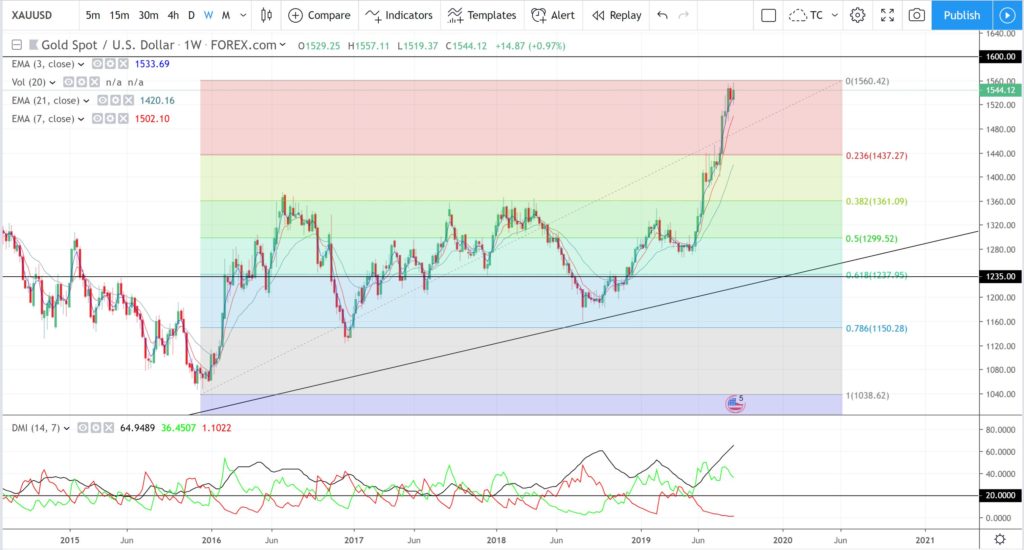
Gold weekly + Fibonacci (swing High): On this weekly chart, Fibonacci retracement has been placed on the Dec 2015 – current swing High move. Any deeper pullback from current levels, or the $1,600 region, would have me looking to the 61.8% Fibonacci region of this swing High move, circa $1,235, as a target. It is worth noting that Technical Theory would suggest that price action could pullback to this region as part of the normal ebb and flow of a trend, even if there is to be overall bullish continuation. A break and hold below $1,235 however would suggest that the uptrend is over. Note how this level lines up with the monthly support trend line though for added confluence!
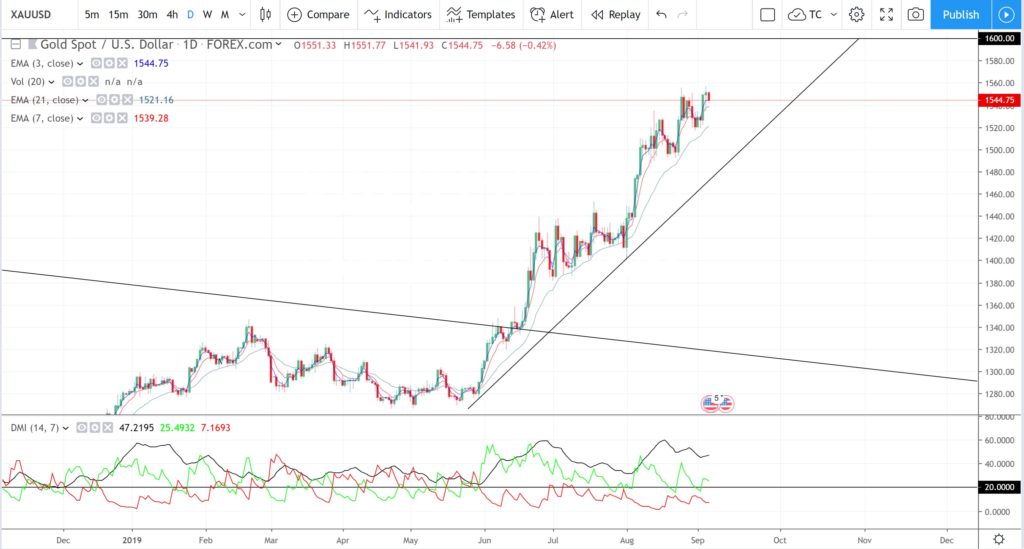
Gold daily: the daily chart shows that the most recent bullish run started in May 2019:
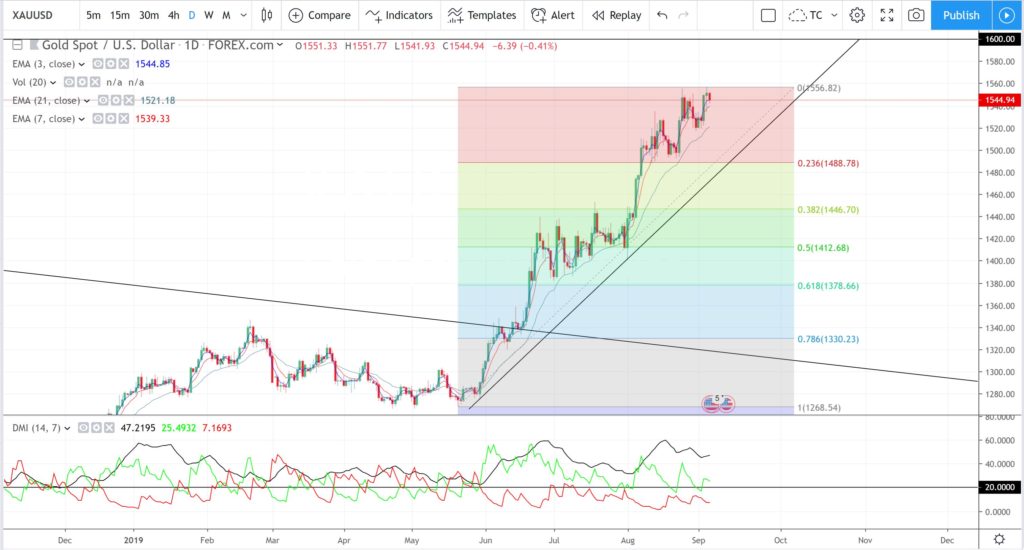
Gold daily + Fibonacci: Placing Fibonacci retracement on this swing High move shows the 61.8% Fibonacci level is down near $1,380. This would be the first target region for any break of trend line and pullback move. Any deeper than that would bring the target mentioned above, $1,235, into focus. However, if this daily chart support trend line does break then traders, in the first instance, need to watch out for any potential Bull Flag formation:
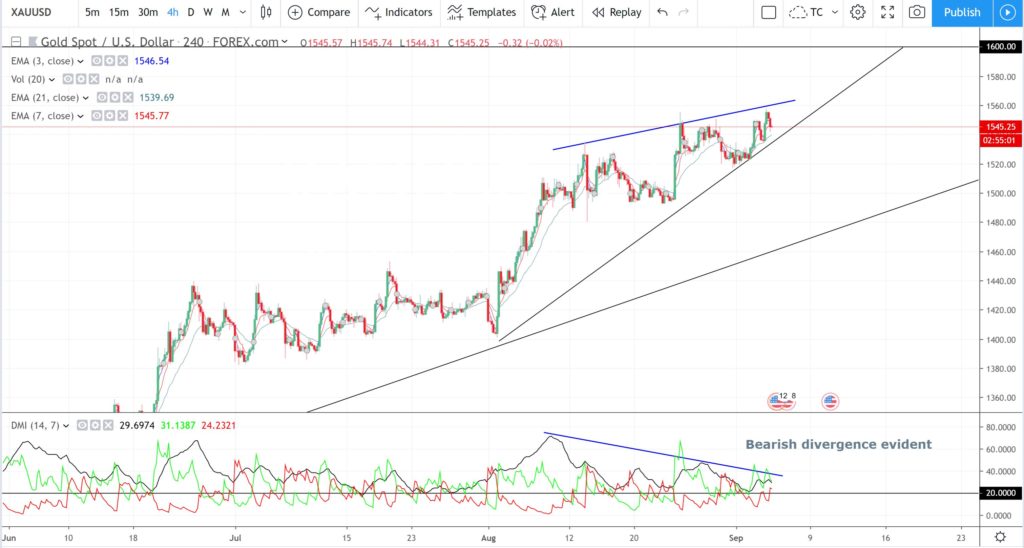
Gold 4hr: the 4hr chart of Gold shows that there is bearish divergence evident and this is not too surprising given price action is reaching up to near the key $1,600 level. I’m not the only trader who would have $1,600 in focus; any Fibonacci or Elliott Wave trader, of which there are many, would have this level in sight too. Thus, price action might stutter and / or stall here on the way to any potential test of $1,600:
Summary: Price action is nearing a major resistance level of $1,600. This is a key whole-number level and the 61.8% Fibonacci level of the Aug 2011- Dec 2015 swing Low move. Many technical traders, not just me, would have this region in focus and so it is not surprising to see price action slow under this region.
Bullish targets: any break and hold above $1,600 would bring the following levels into focus:
- $1,700, $1,800 and $1,900: as whole-number levels.
- $1,920.70: as the previous all time High.
- $2,000: as the whole-number above the previous all time High.
Bearish targets: any deeper pullback from the $1,600 region would bring the following levels into focus:
- $1,380: as the 61.8% Fibonacci level of the May 2019 – current swing High move.
- $1,235: as the 61.8% Fibonacci level of the Dec 2015 – current swing High move.


