Gold has moved above a 6-year bear trend line and looks to be making a bullish breakout. However, traders need to watch to see if there is a weekly close and hold above this trend line to support a breakout thesis. In this post I review the charts of Gold, some ETFs and Gold stocks.
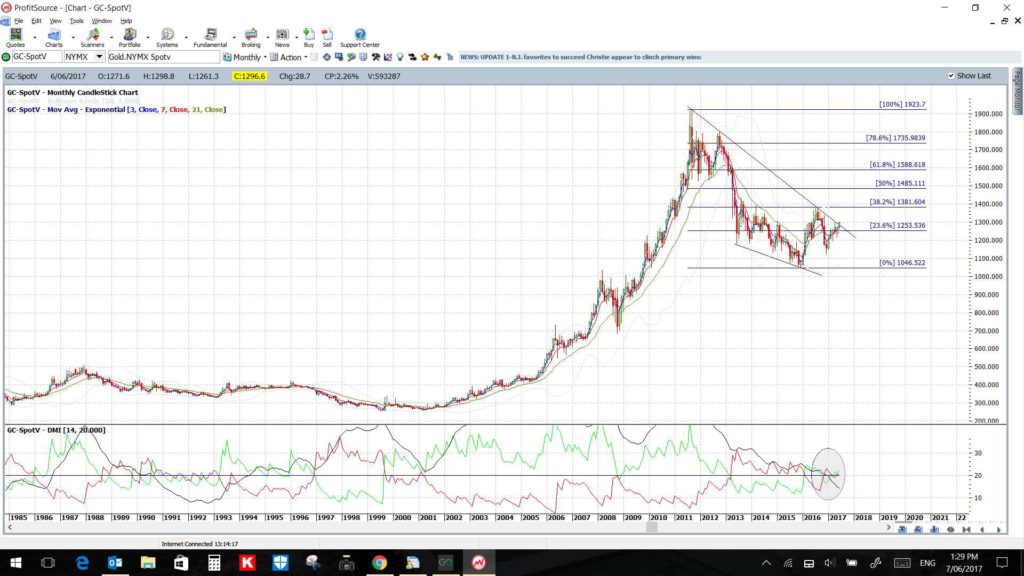
Gold monthly: this has looked like a Bull Flag for some time and it might be starting to render! A monthly candle close above the trend line would need to be seen to confirm this Flag:
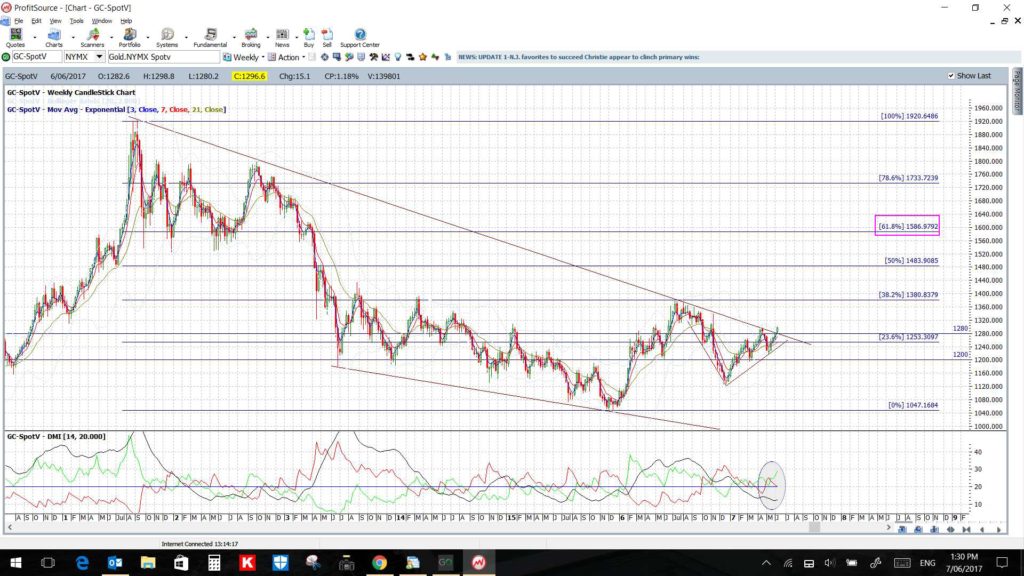
Gold weekly: watch for any hold above this trend line to support a bullish bias. A test of this broken trend line would not surprise either though so be on the lookout for that; near $1,280:
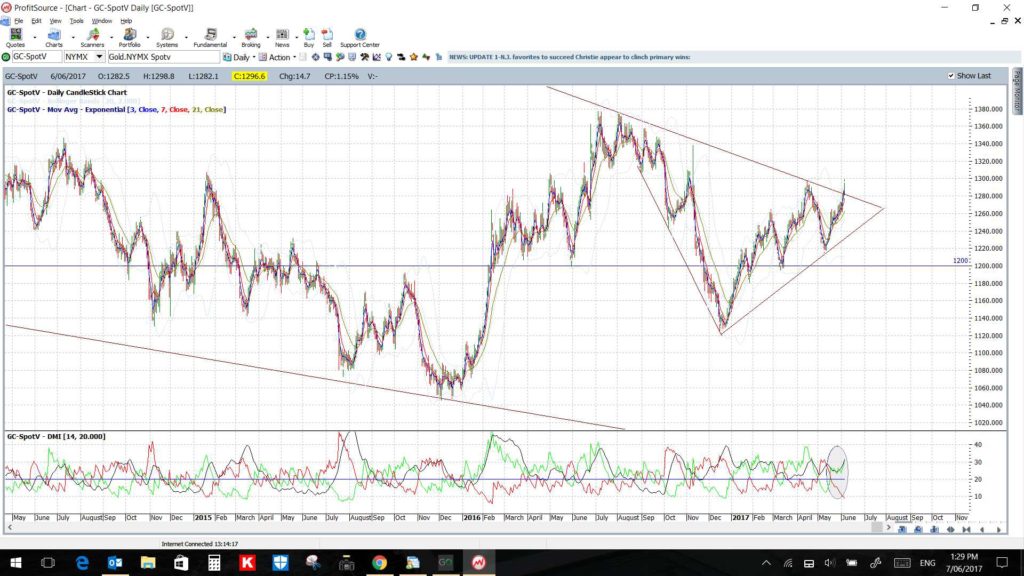
Gold daily: there has been a daily candle close above this 6-year bear trend line but we need to see a weekly close:
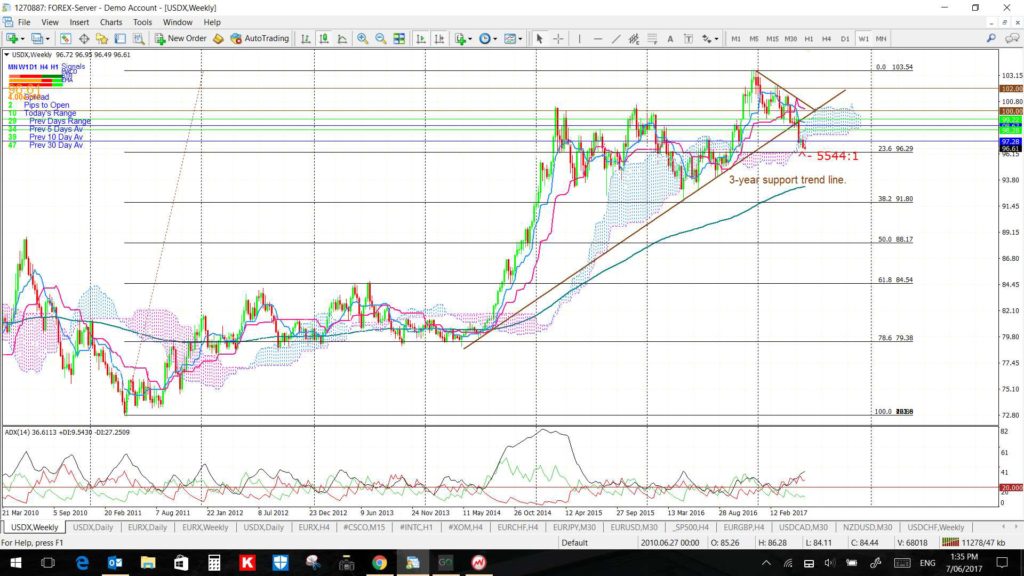
USDX weekly:
Any bearish follow through on the US$ would help to underpin bullish sentiment on Gold, that and growing Geo-political jitters:
Gold Stocks and ETFs:
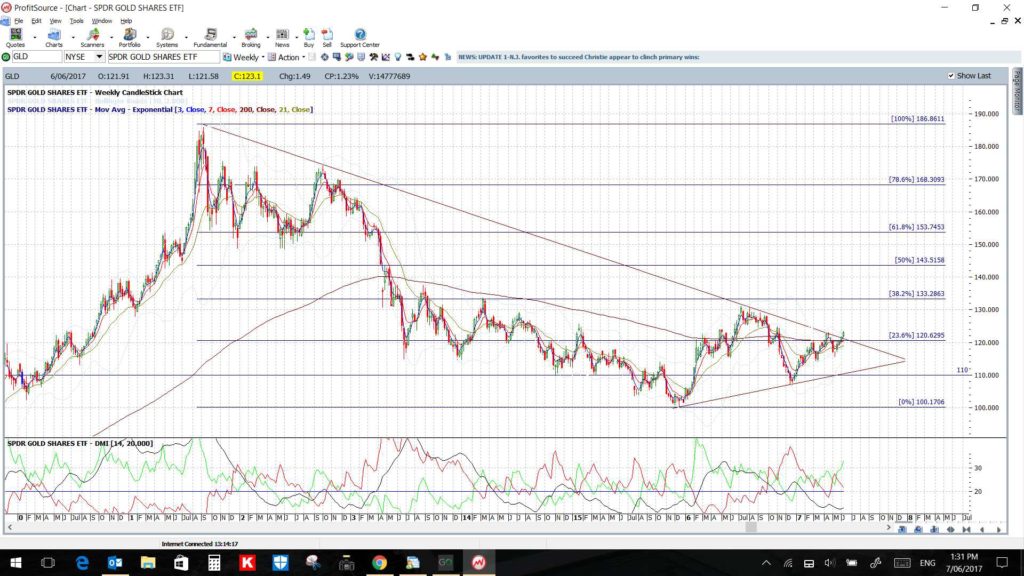
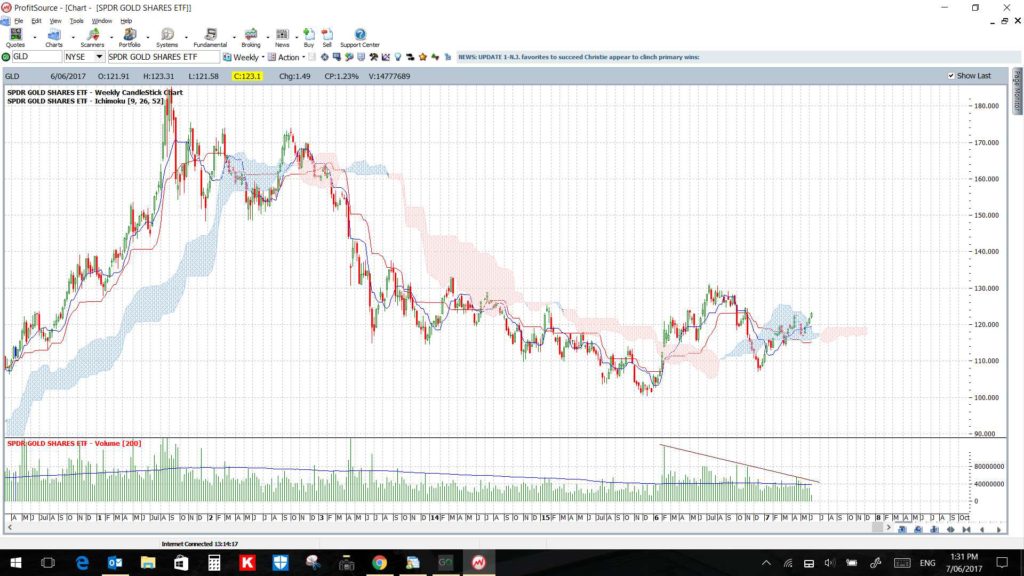
GLD weekly: Gold bullion ETF; like the base metal, this ETF is attempting a bullish trend line breakout.The trend line and weekly Cloud have been broken but watch for the ADX and Volume to kick in:
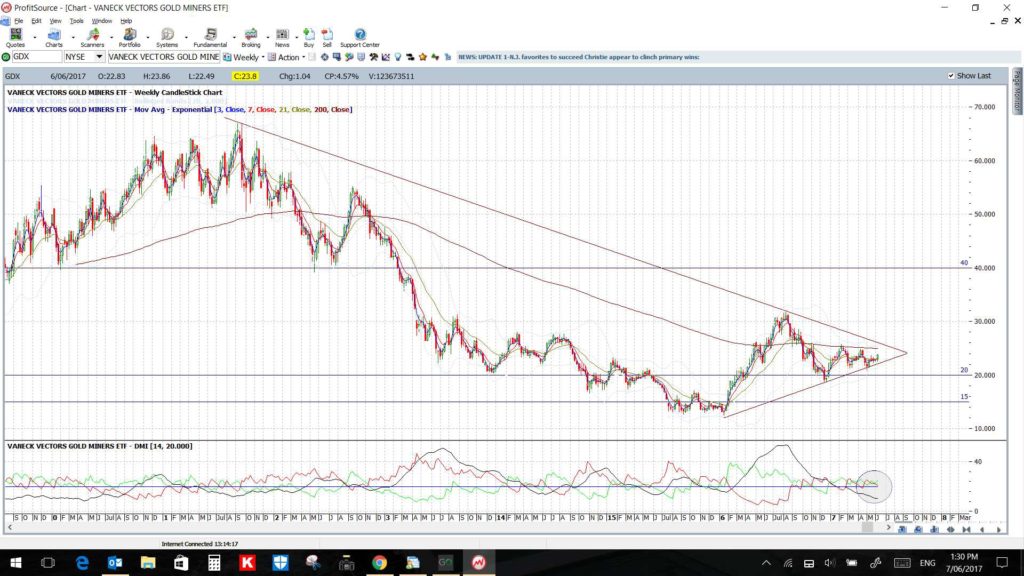
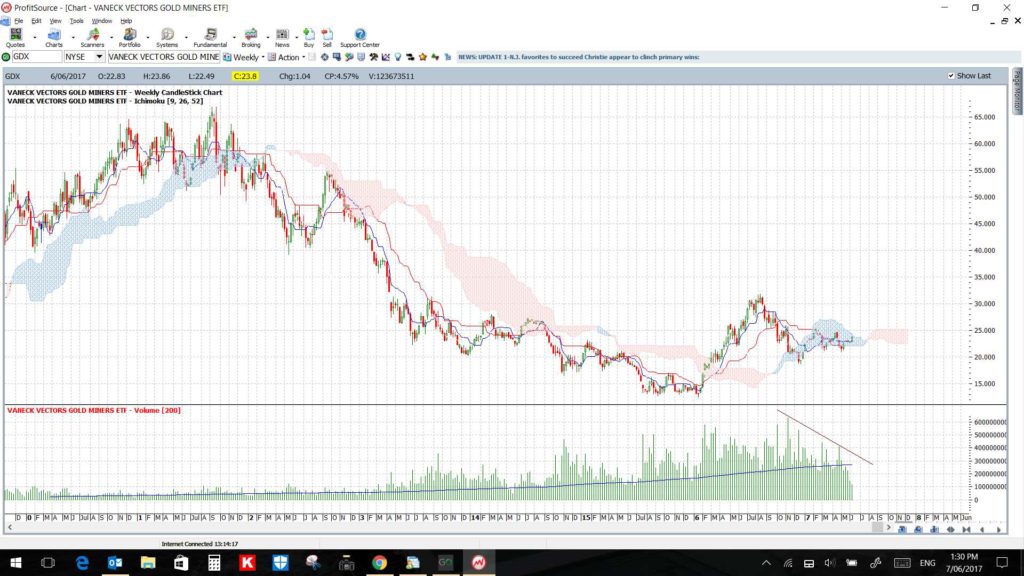
GDX weekly: Gold Miners ETF: I’m still seeing a bit of work to be done here for this to achieve a trend line, Cloud and Volume breakout:
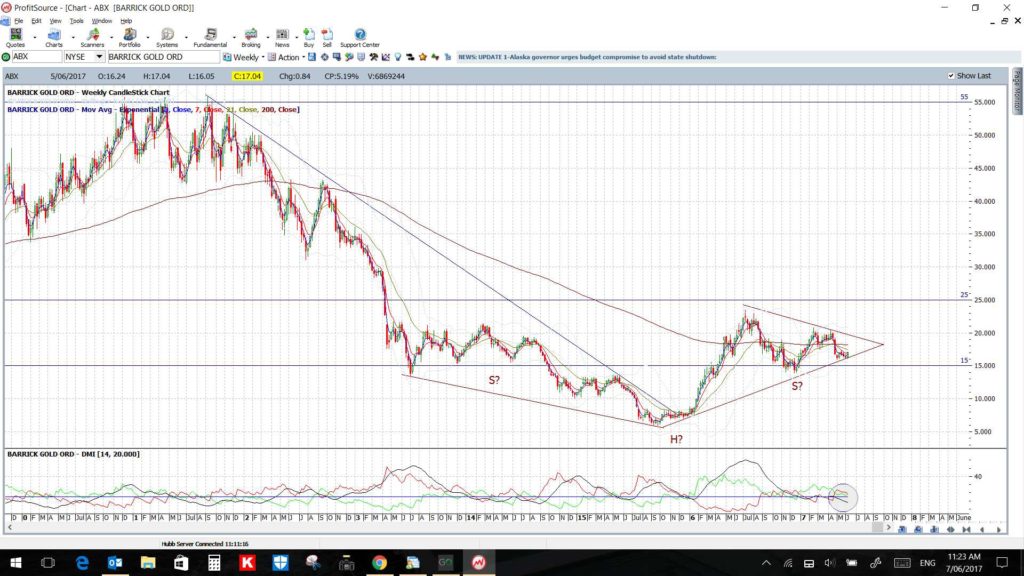
ABX weekly: Barrick Gold: watch for any momentum-based trend line breakout:
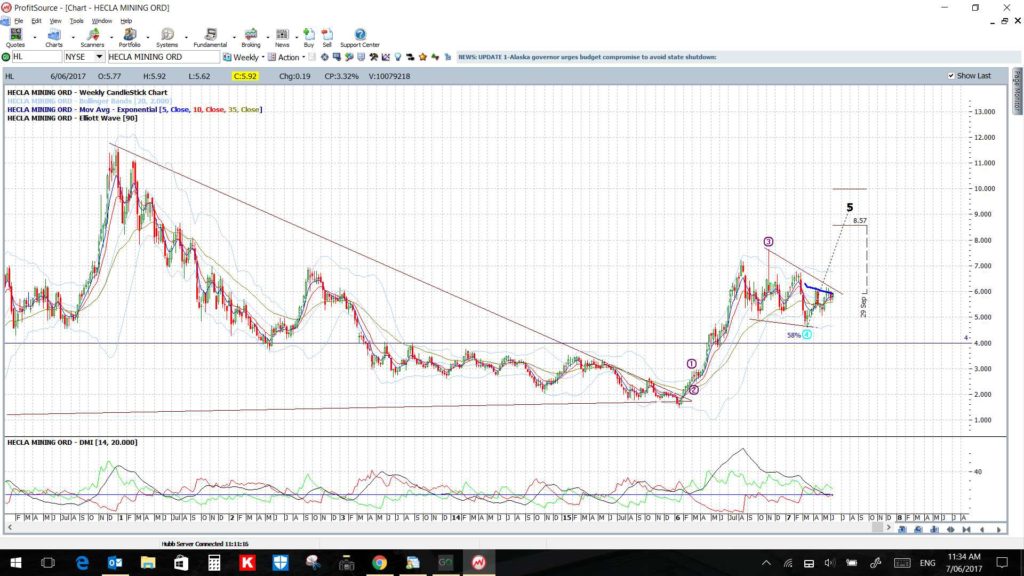
HL weekly: Hecla Mining: ditto:
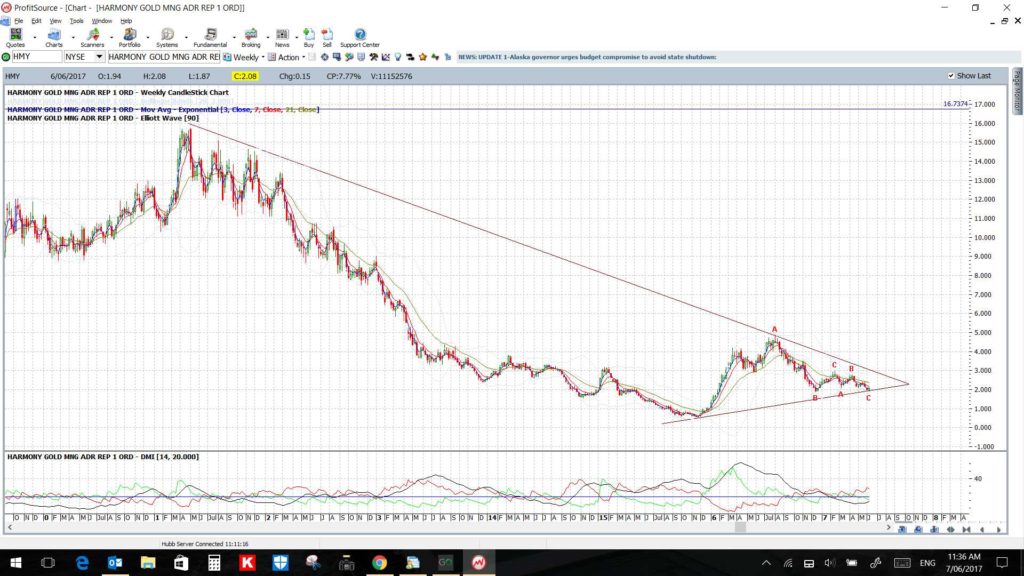
HMY weekly: Harmony Gold: watch for any momentum-based trend line breakout:
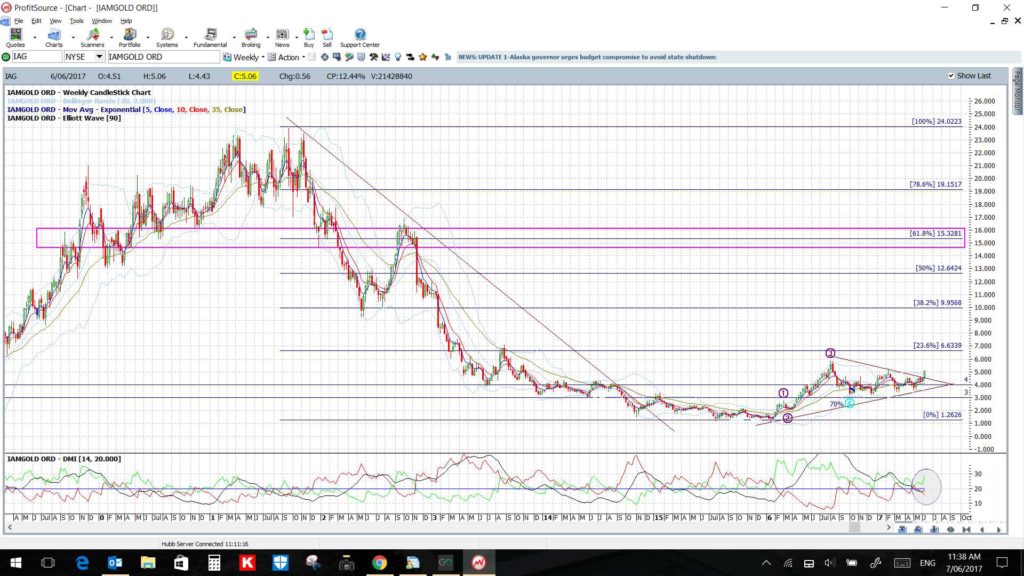
IAG weekly: IAMGOLD Corp: a bullish breakout looks to be underway here. Target would be the 61.8% fib:
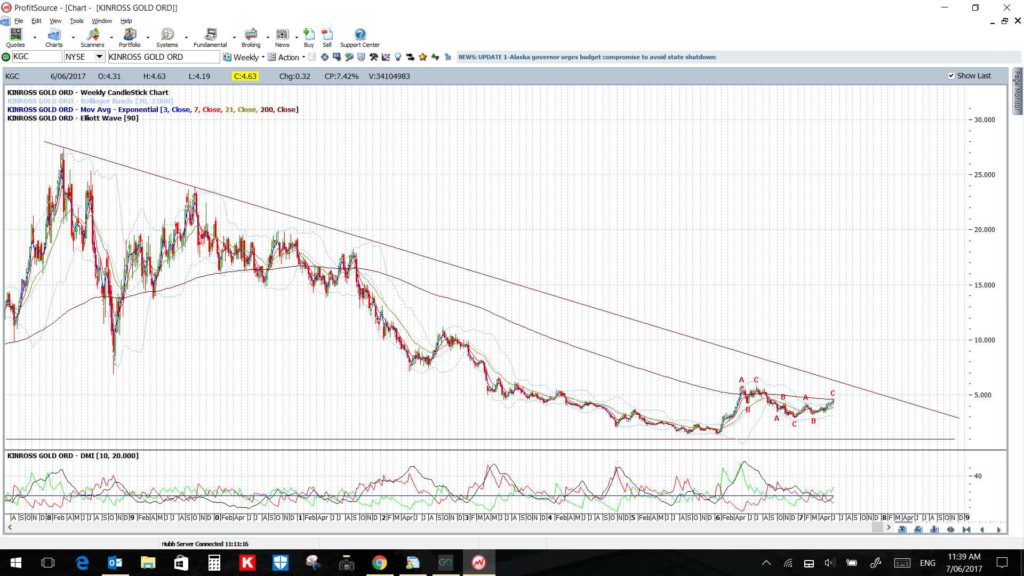
KGC weekly: Kinross Gold Corp: watch for any momentum-based trend line breakout:


Hi Mary, thank you for the great analysis.
As for gold there’s another weekly TL, starting from 07.2016, which is not broken yet. This one also is in confluence with the tops set in April at 1295. A break above this level will definitely confirm the break of the bigger TL.