Tue 19th Aug
Trading volumes may be down of late but many of the global stock indices are holding on to recent gains, despite all of the geo-political turmoil, and some even look quite bullish.
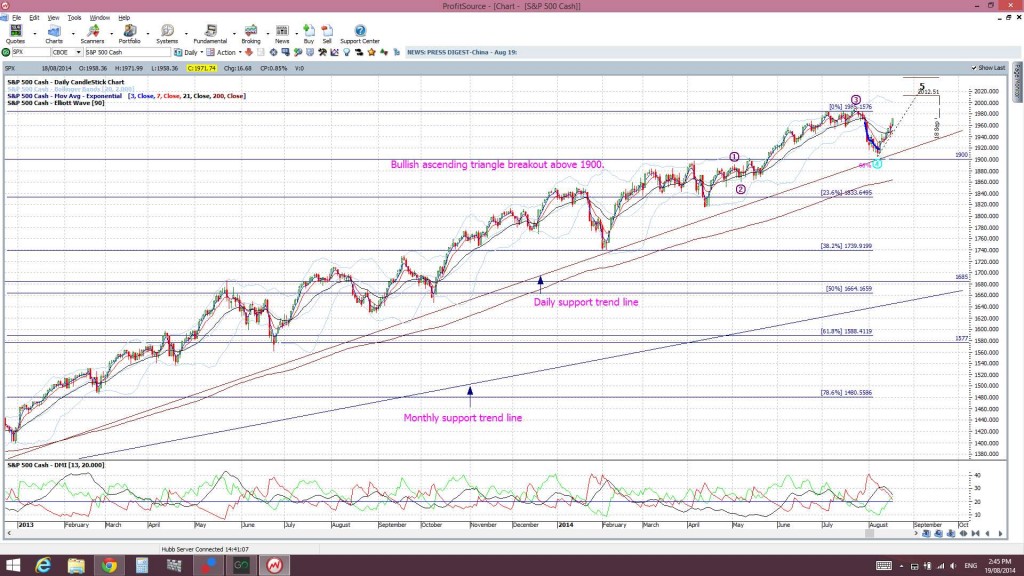
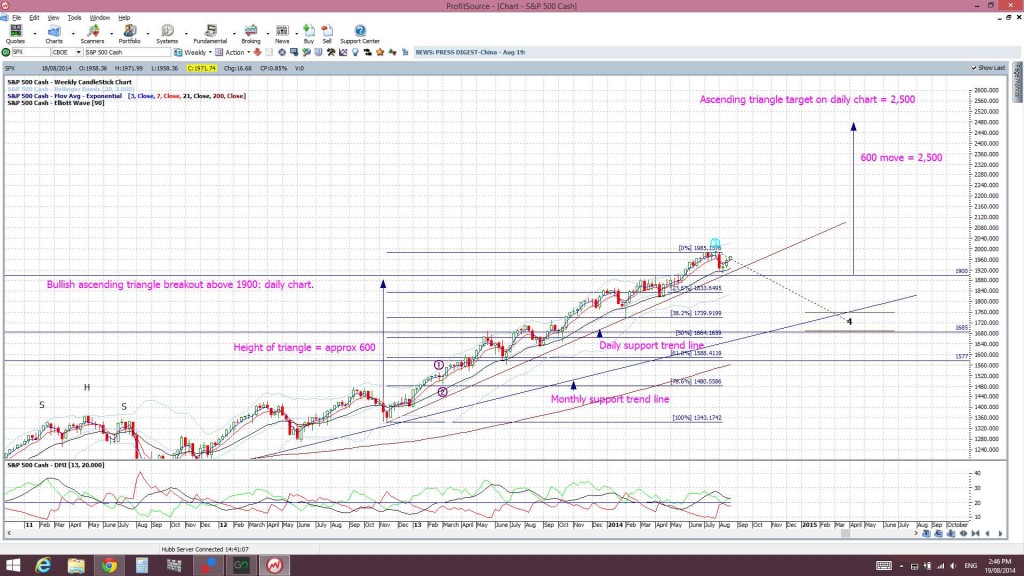
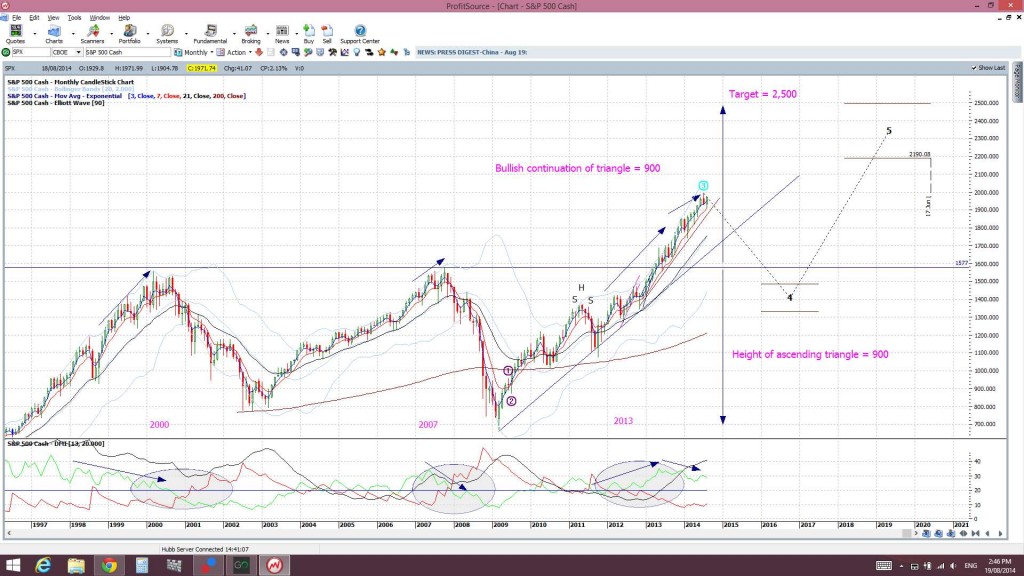
S&P500: this major heavy weight index is still holding above a daily support trend line. An ultimate bullish target of 2,500 is still seen here and this numerical value is being discussed by other traders now as well. The calculation of this target can be viewed in an earlier post through this link.
S&P500 daily:
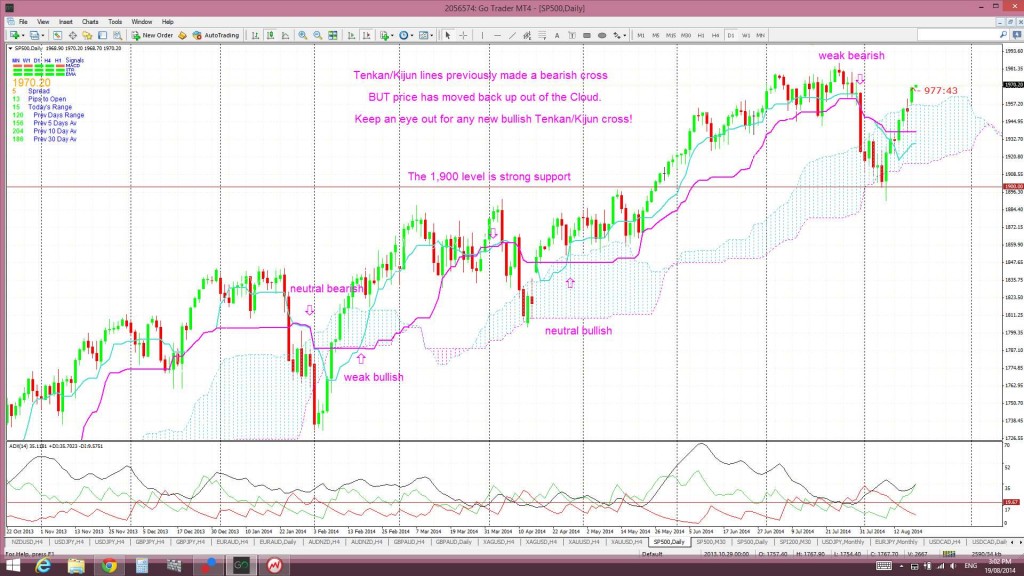
S&P500 daily Cloud: the index has moved back above the Cloud and traders need to watch for any possible new bullish Tenkan/Kijun cross:
S&P500 weekly: showing one calculation for the bullish target:
S&P500 monthly: showing another calculation for the bullish target:
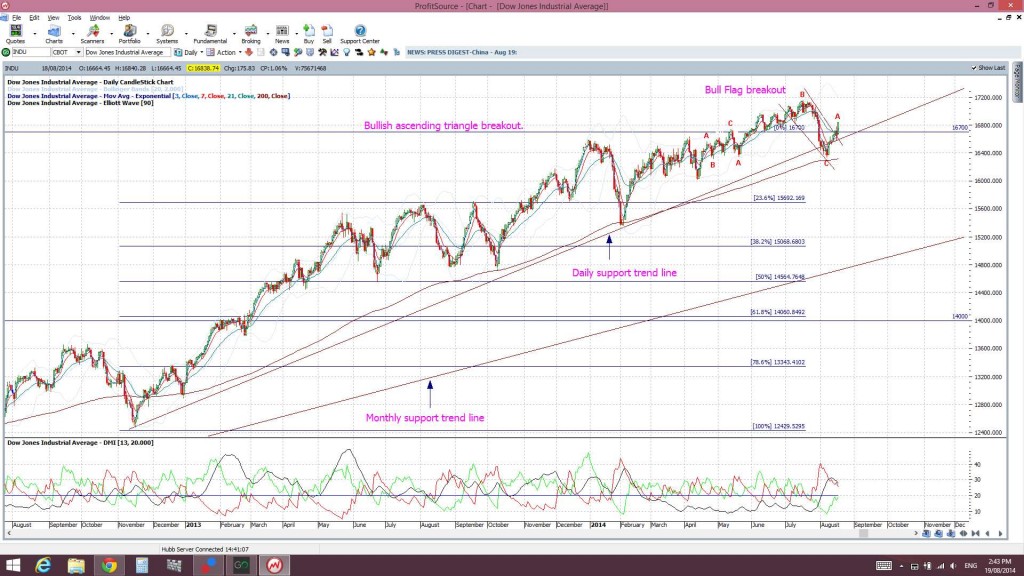
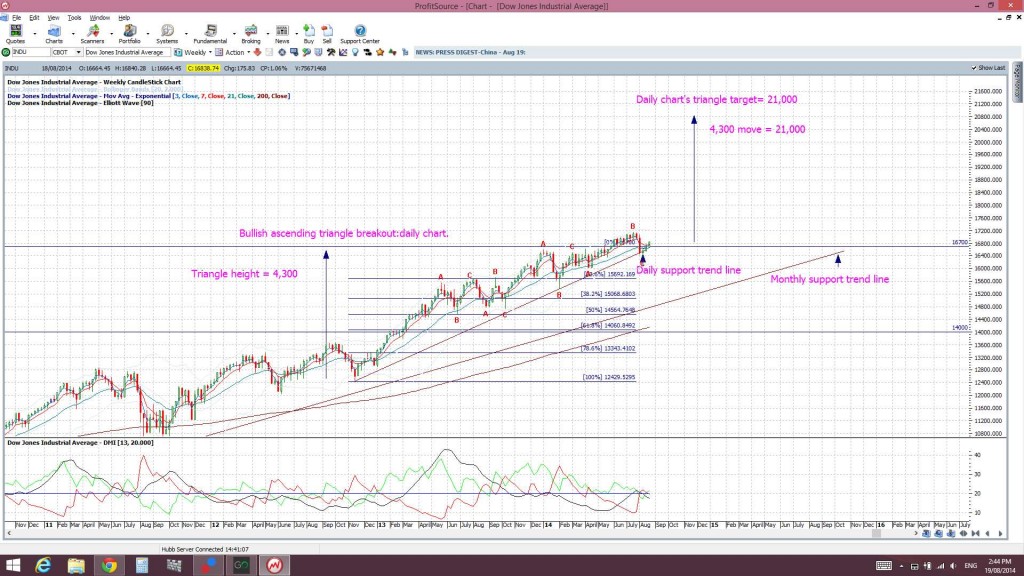
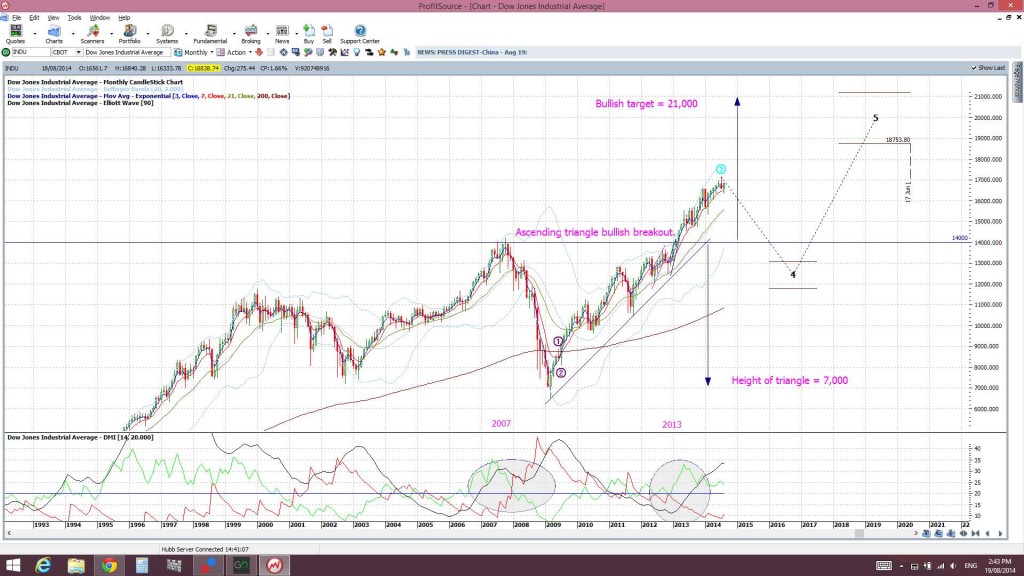
DJIA: Like the S&P500, this index has also held above a daily support trend line. It has also just made a ‘Bull Flag’ breakout. I am still seeing an ultimate target of 21,000 here. The calculation of this target can be viewed in an earlier post through this link:
DJIA daily:
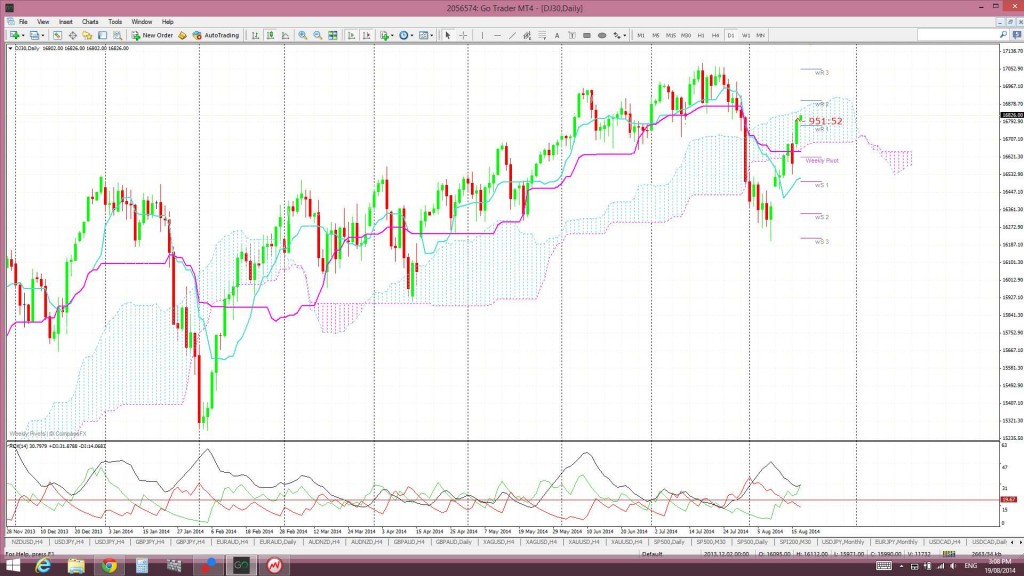
DJIA daily Cloud: price is trying to break back up above the Cloud:
DJIA weekly: showing one calculation for the bullish target:
DJIA monthly: showing another calculation for the bullish target:
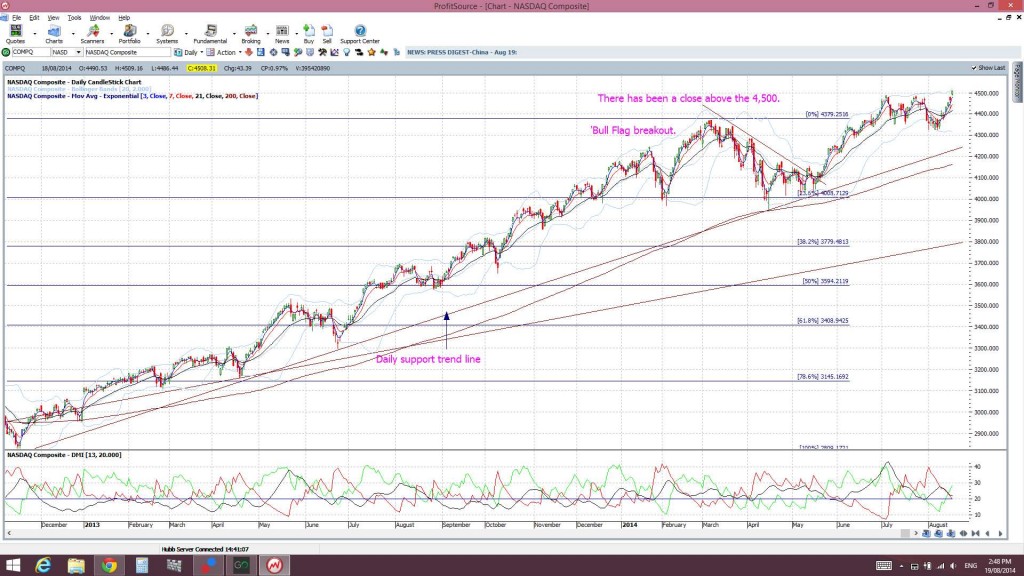
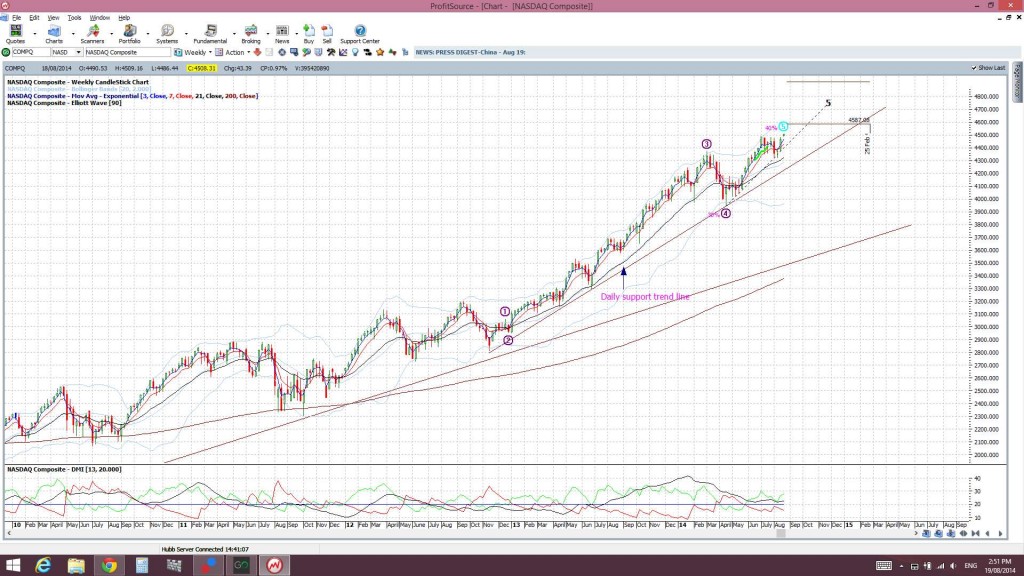
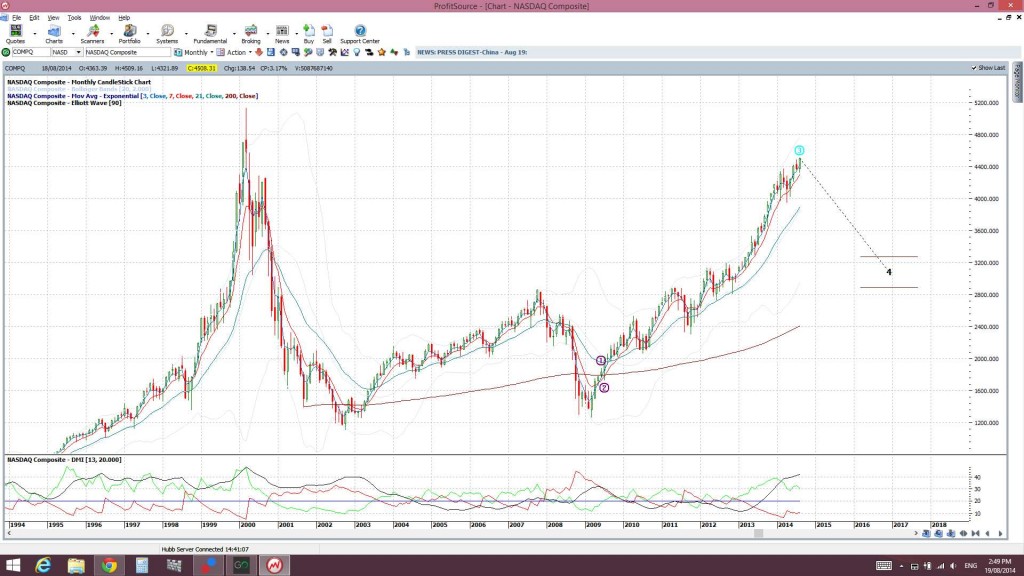
NASDAQ: this has made a bullish close above the 4,500 level for the first time in 14 years. This index is also still holding above a daily support trend line but might stall again as it reaches a potential monthly chart ‘Double Top’ region :
NASDAQ daily:
NASDAQ weekly:
NASDAQ monthly: showing a potential ‘Double Top’ region setting up here:
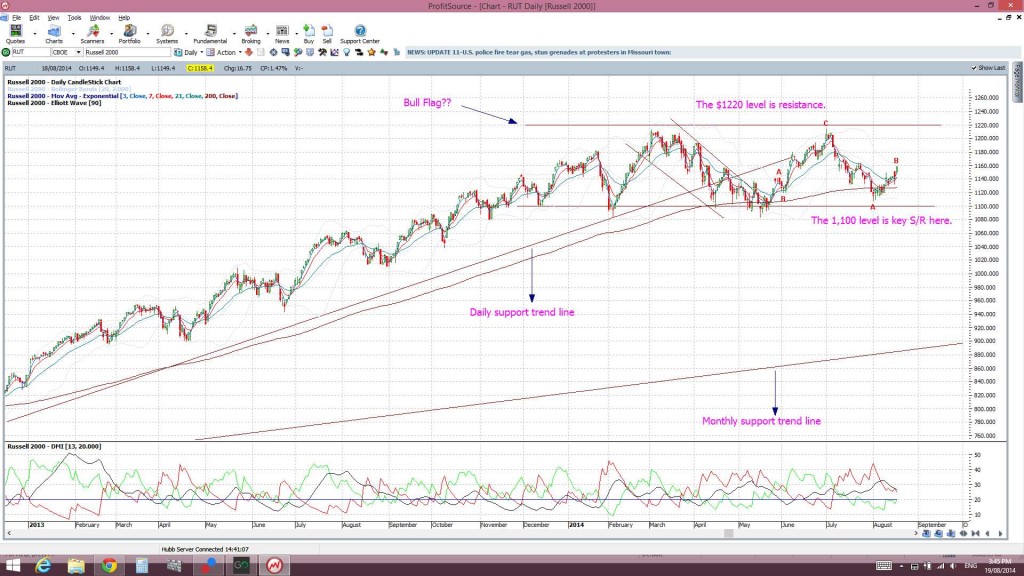
Russell 2000: the US ‘small caps’ index. This continues to hold above the 1,100 support level. It also looks to be forming a bullish ‘Flag’ pattern:
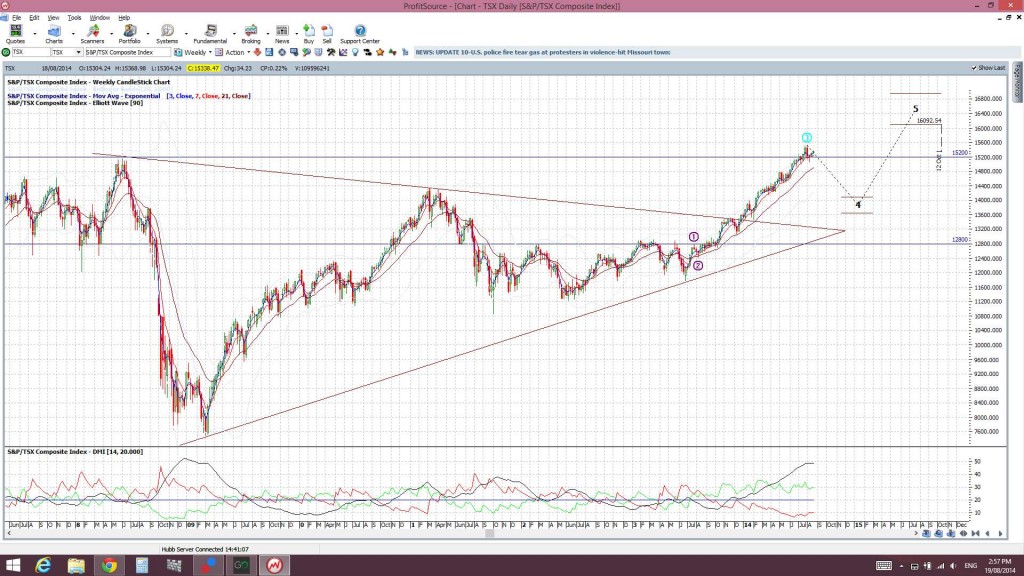
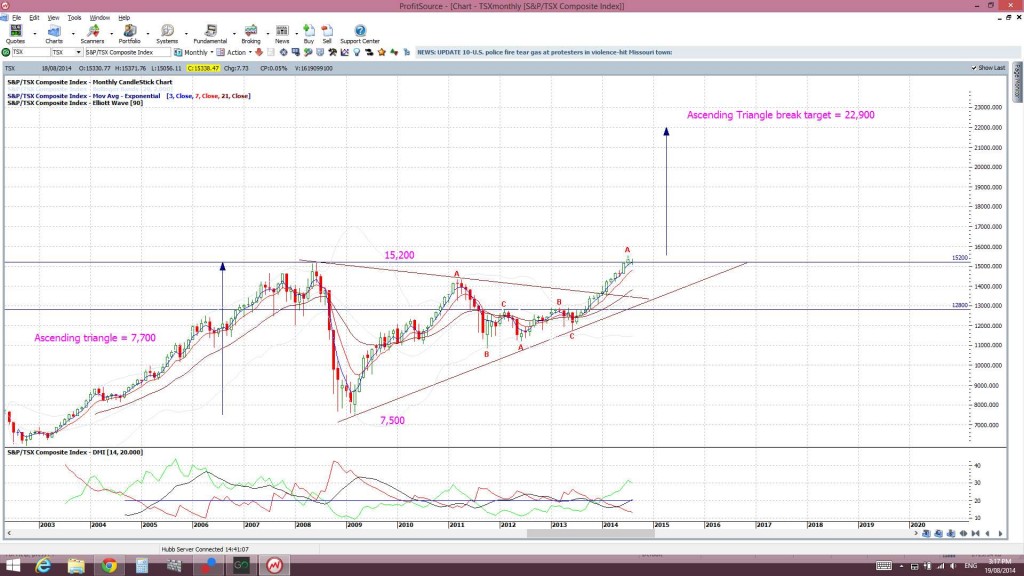
Canada’s TSX: This index had already made a bullish symmetrical triangle break but it now looks like achieving a bullish ascending triangle breakout as well. A monthly hold above the 15,200 level would support this breakout. The height of this ascending triangle is 7,700 (15,200 – 7,500). Thus, the target for any bullish follow through is technically predicted to extend possibly up as far as 7,700 from the 15,200 level. This gives a predicted target of 22,900:
TSX daily: a bullish symmetrical triangle has evolved and now an ascending triangle break is in play:
TSX monthly: showing an ultimate predicted target of 22,900.
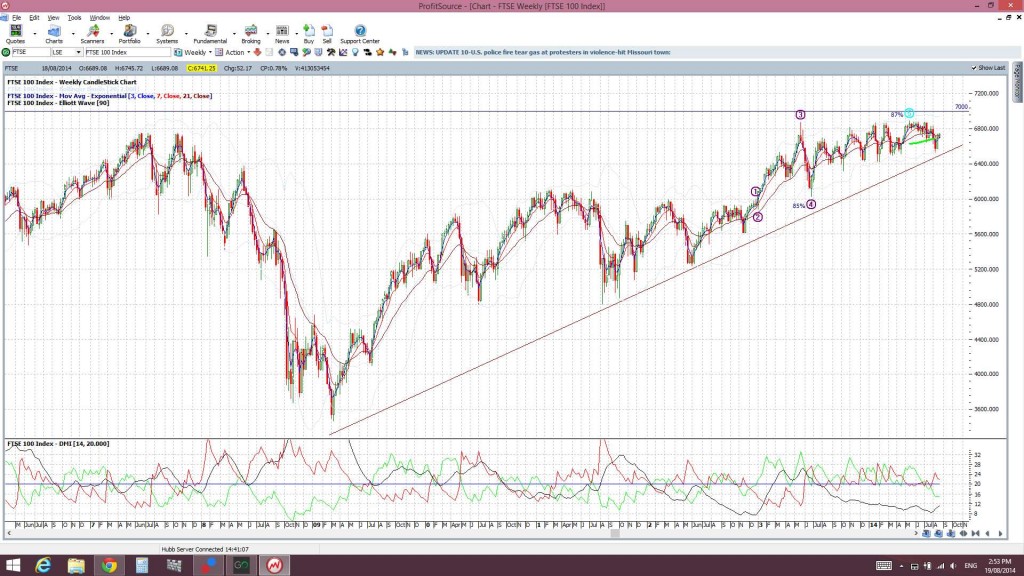
London’s FTSE: This index is still looking bullish as it trades in an ascending triangle pattern:
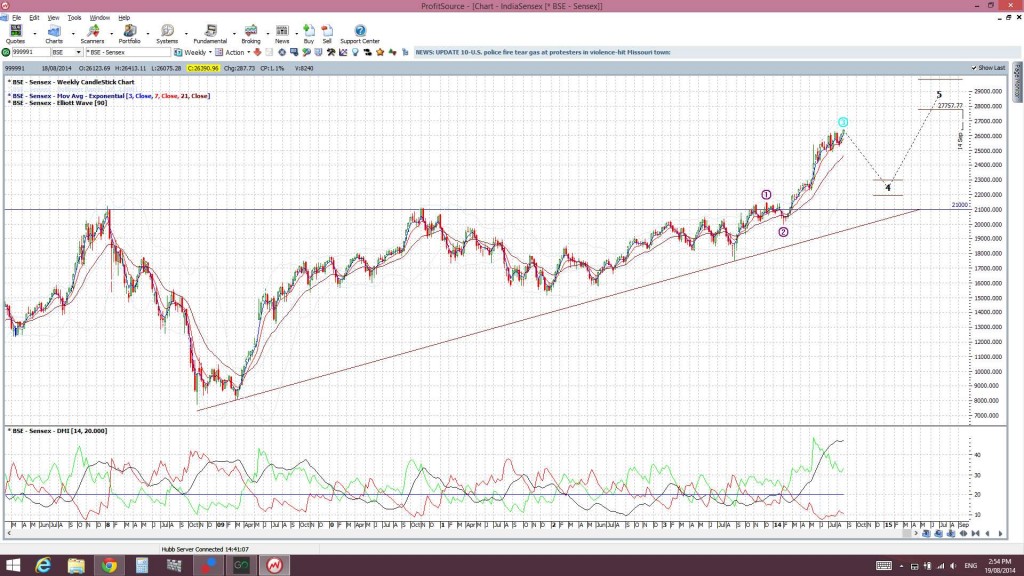
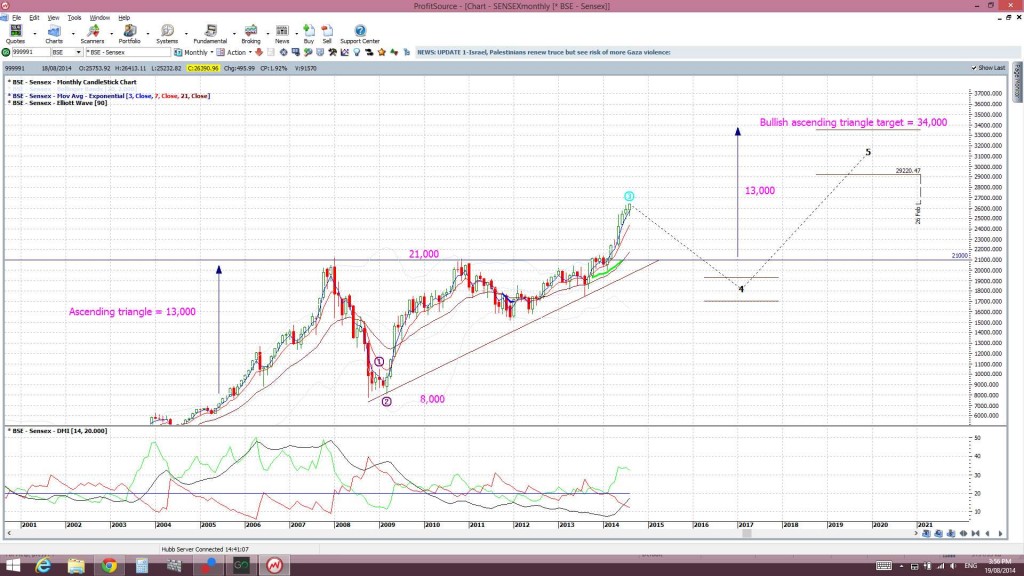
India’s SENSEX: has continued with its bullish ascending triangle breakout. The height of this bullish ascending triangle was 13,000 (21,000 – 8,000). Thus, the predicted technical target for any potential bullish follow through would be up 13,000 from the 21,000 level. This predicts a target of 34,000:
SENSEX weekly:
SENSEX monthly: showing the bullish target of 34,000:
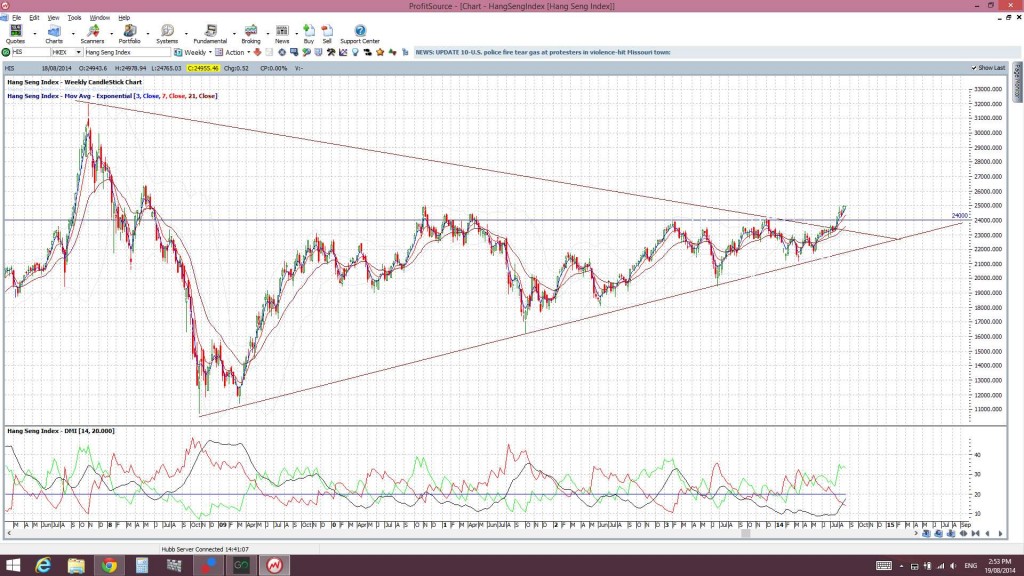
Hang Seng Index: much is being made about this index flirting up near the 25,000 level. I see this index has already carved a bullish triangle breakout here though with the close above the 24,000 level:
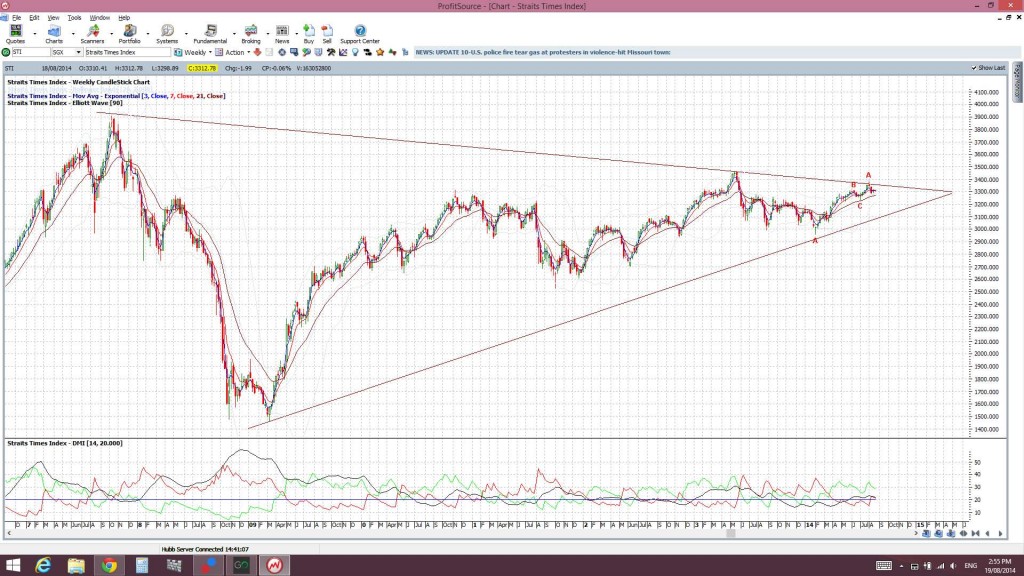
Shanghai’s Straits Times Index is looking bullish as it trades near the top of a symmetrical triangle as well:
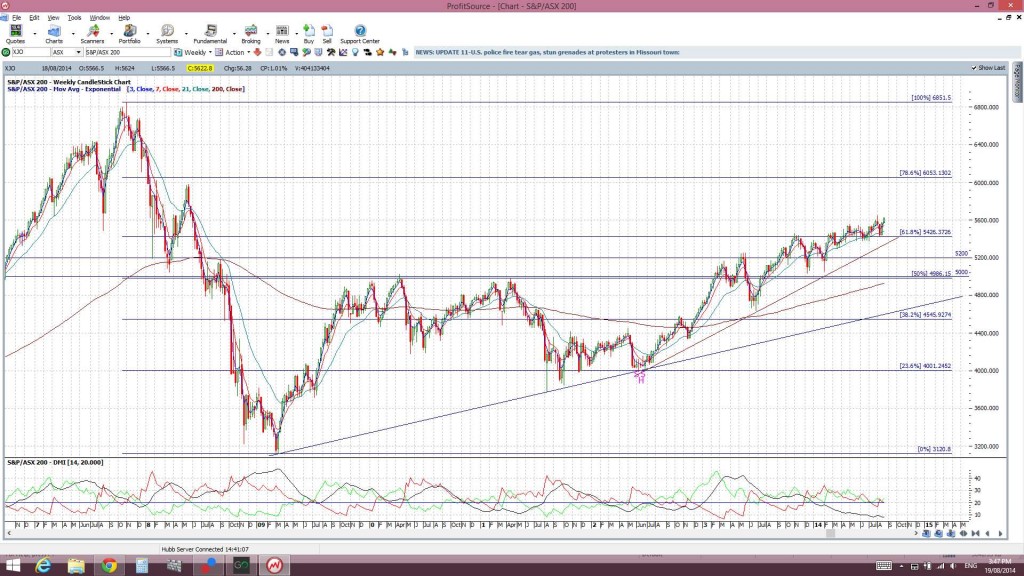
XJO: S&P/ASX 200: seems now to have cleared the 61.8% fib and I’m suggesting the next target area will be the 78.6% fib up near 6,000:
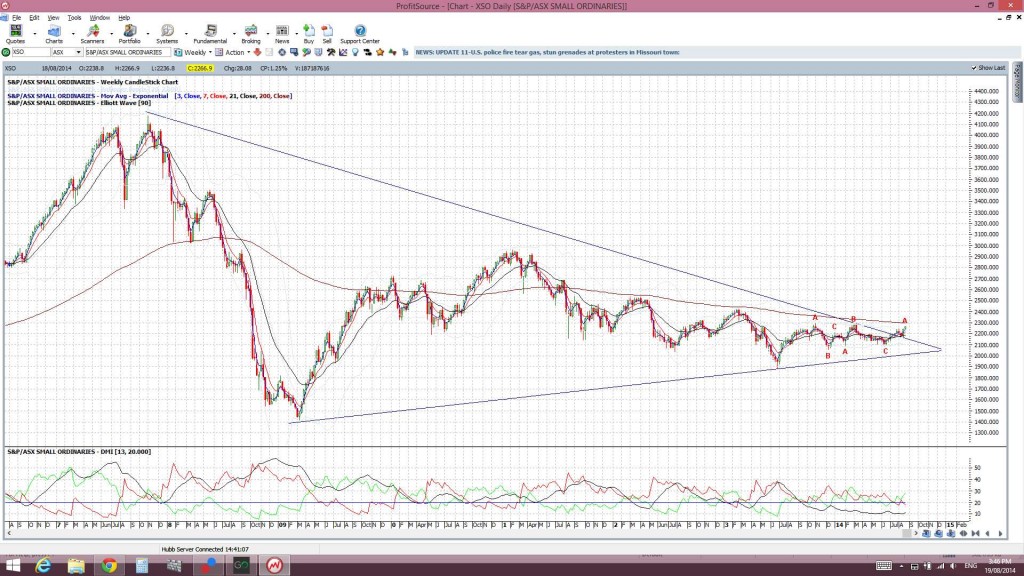
XSO: The Aussie ‘small caps’ index: this has achieved a bullish triangle breakout:


