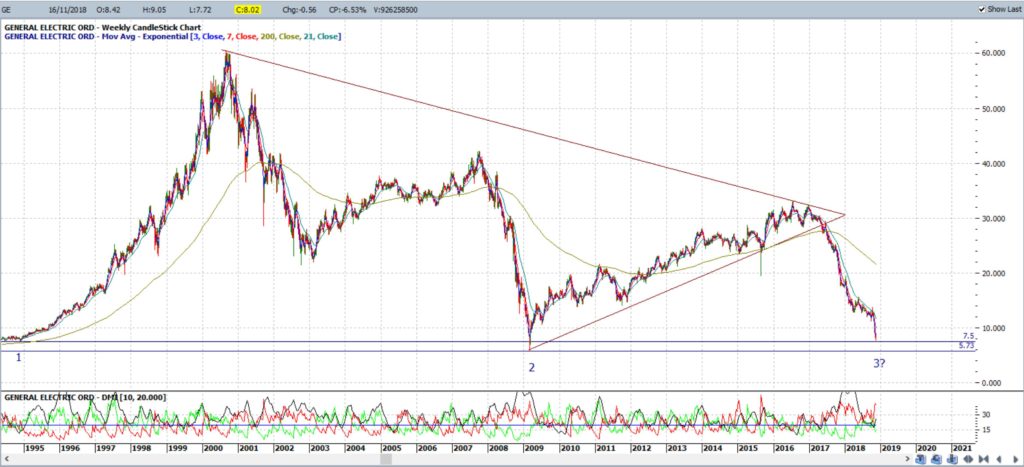
General Electric (GE) has been in a downtrend since mid 2016, that is, for the last 2 1/2 years and price has dropped from the $30 level down to near $8. The all time Low (since 1990) from my charts is $5.73 but, for now, price is holding above the historic Low range of $7.50. The company was founded in 1892 and whilst price action can fall further, with this pedigree, I would not expect the Company to disappear all together. With this, and the charts, in focus I will be watching for any shift in the latest price action cycle for this multi-national company.
GE weekly: price action peaked at $60 in 2000 but has essentially been on a decline since then. The Low on this chart span is $5.73 but the $7.50 region looks to be the rounded-off support level here:
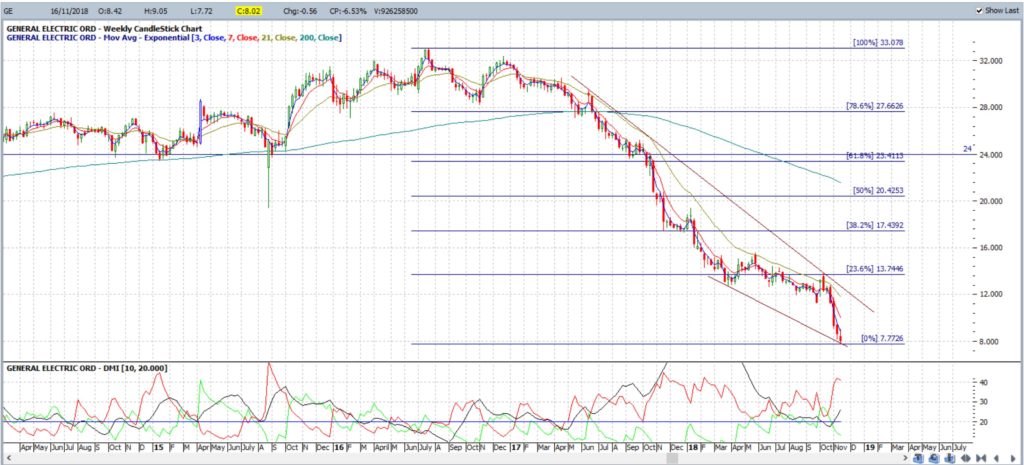
GE weekly with Fibonacci retracement: Expanding the recent decline shows that a potential bullish-reversal descending wedge might be setting up. I find these to be one of the most reliable technical patterns and I have a separate article published on my site and accessible through this link to that effect.
Placing Fibonacci retracement on this latest 2016-2018 swing Low move shows that the 61.8% fib level is up near $24 which is also previous Support / Resistance. This would be the level to target if there is any bullish descending wedge breakout.
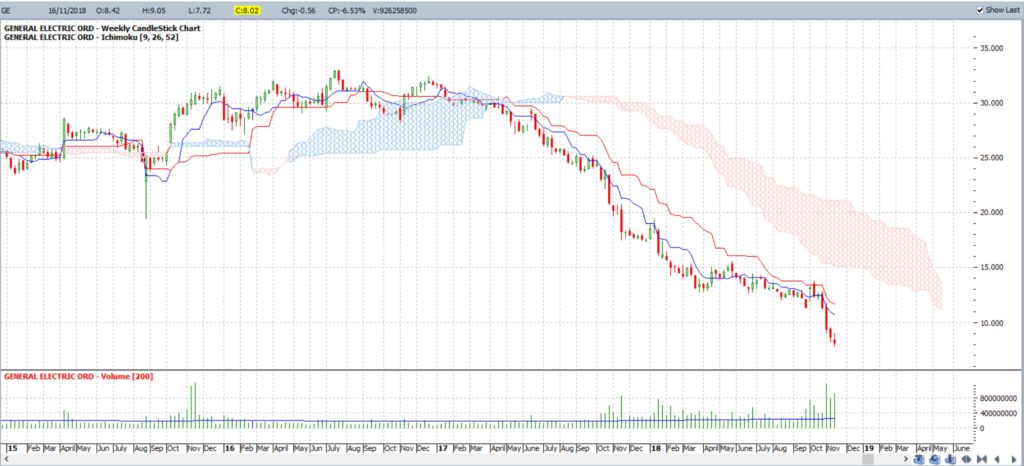
GE weekly with Ichimoku Cloud: Price action has a bit of recovery work to do though to get back above the resistance of the weekly Ichimoku Cloud. However, the Ichimoku Cloud is waning and might marry up with the descending wedge trend line over time:
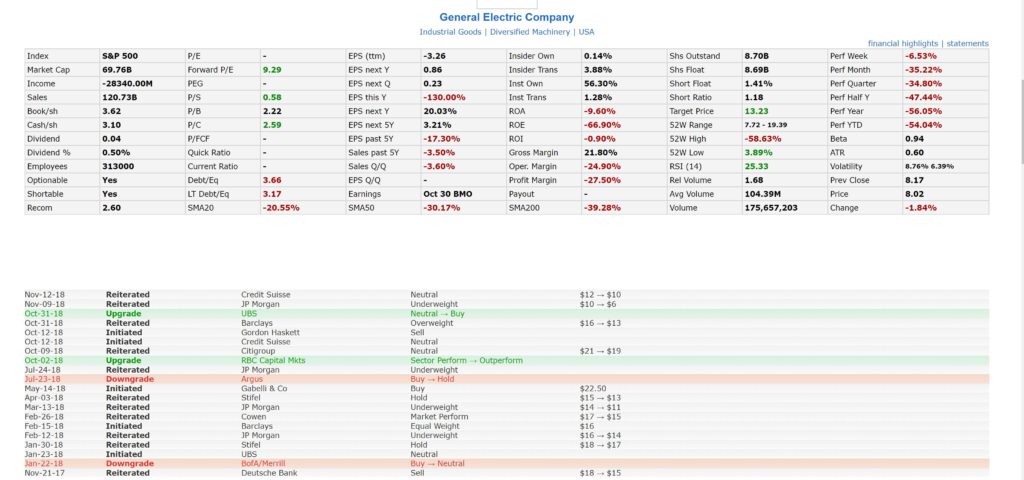
GE data from FinViz: Note the recent upgrades:
Summary: GE has been in a downtrend for the last 2 1/2 years and may well keep declining, however, price action is know to cycle up and down and so I am keeping an open mind here. I will be keeping an eye on the descending wedge trend lines on the weekly chart for any new breakout and any bullish breakout would have me looking for a move up to the 61.8% fib, near $24.


