I have been asked to review the GBP/JPY so here is how I’m currently seeing this currency pair. This pair had been dominated by issues surrounding Brexit although it started to look like it was moving on from this but, then, a curve ball in the form of Yen strength and Coronavirus struck and is making quite a mark!
Technical Analysis: Please note that it is important to keep in mind that this analysis is Technical and chart-based but that any major Fundamental news items, as recently seen with Coronavirus, have the potential to quickly undermine identified chart patterns. This is why it is critical that traders appropriately manage their trade exposure and risk per trade.
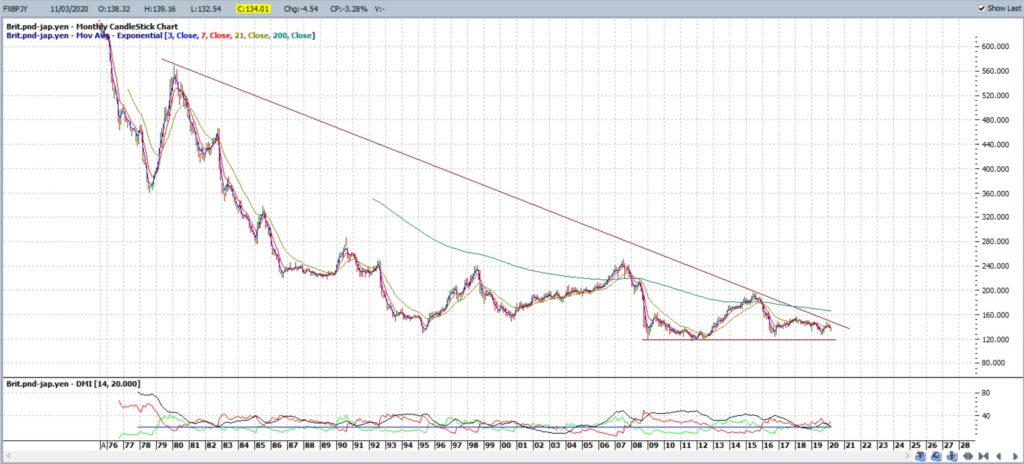
GBP/JPY monthly: The longer term trend remains down as there are still lower Highs still being printed BUT note how the Low seems to be trying to carve out a base around 120:
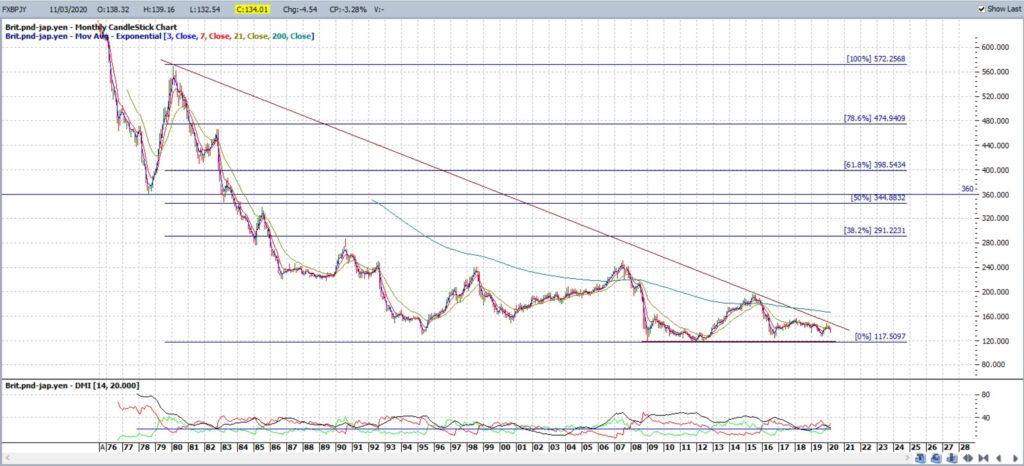
GBP/JPY monthly: there does look to be a bullish-reversal descending wedge, of a sort, so any bullish wedge breakout would bring 360 into focus over the longer-term as this is previous S/R and is near the 61.8% Fibonacci:
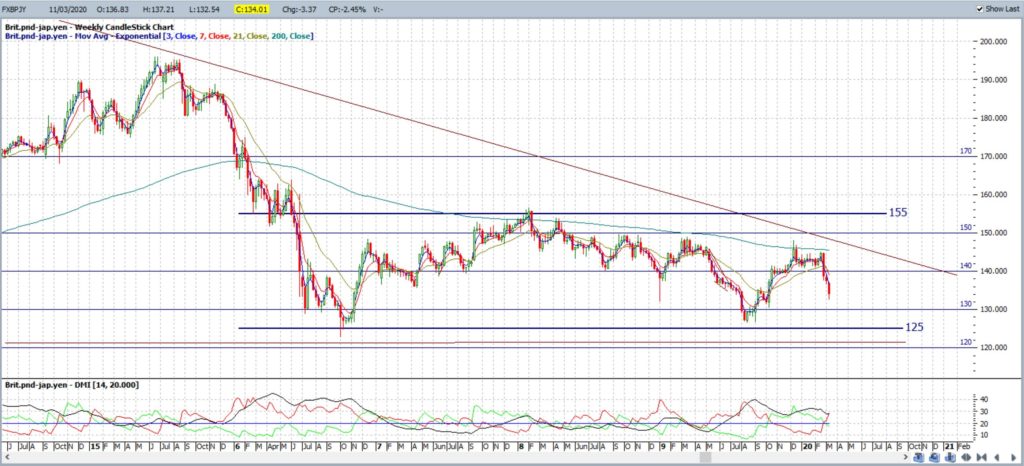
GBP/JPY weekly: narrowing down onto the weekly chart shows up a bit of a channel bound by 155 at the top and 125 down the bottom. I would expect we might see a test of the lower range with the Coronavirus-related risk-off shift:
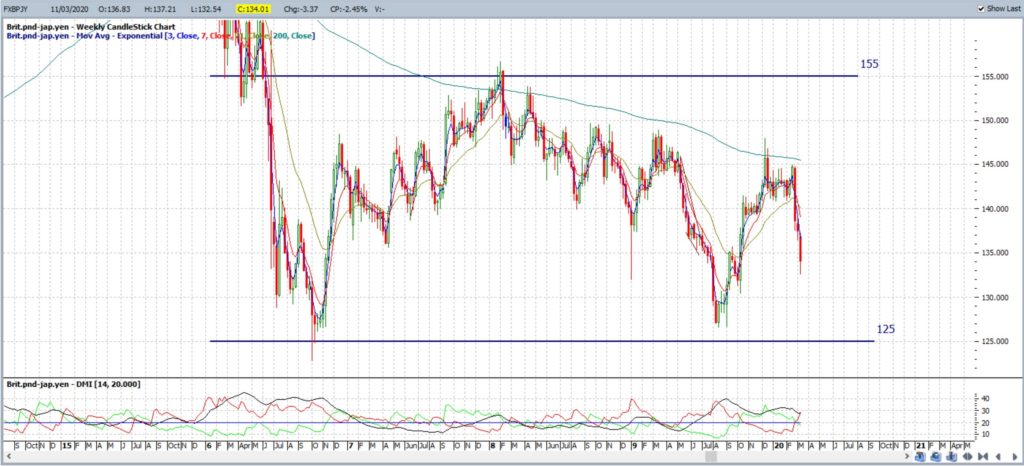
GBP/JPY weekly: keep an eye on 125:
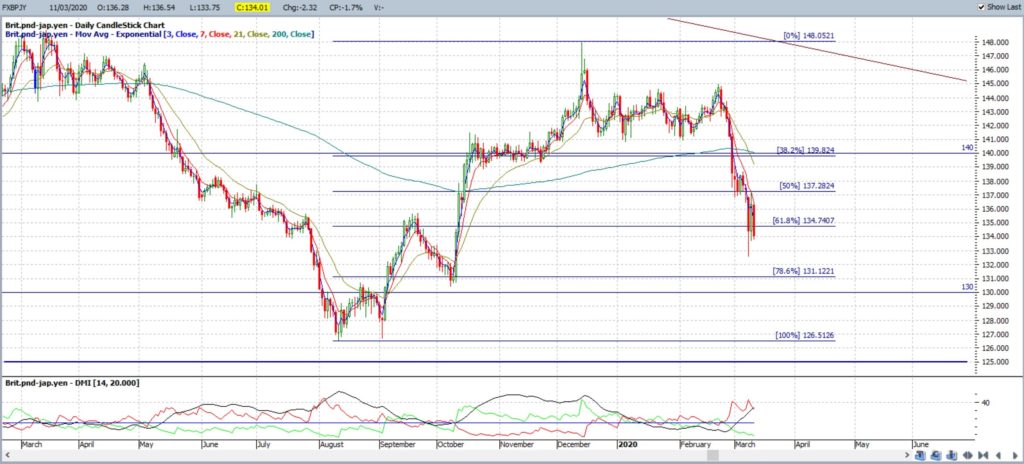
GBP/JPY daily: this latest move is currently below the daily 61.8% fib so watch for any shift lower; towards the 100% fib, circa 126.5:
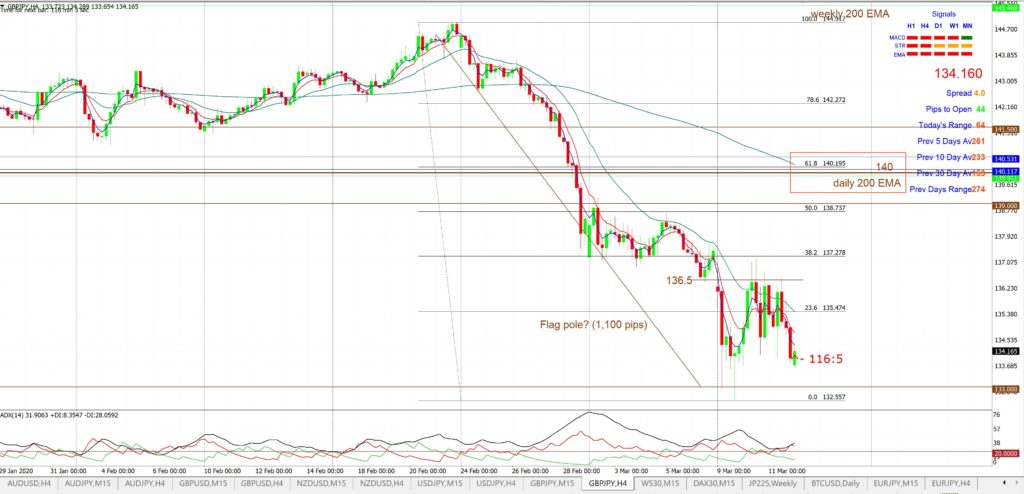
GBP/JPY 4hr: IMHO: this chart has a bit of a Bear Flag look to it so watch the Flag trend lines. However, any relief rally above 136.5 would bring the 4hr chart’s 61.8% fib region into focus as this is near 140 S/R and the 4hr chart’s 200 EMA, and, after that I’d look towards the recent High that is near 146 and the weekly 200 EMA:
Summary: the GBP/JPY is looking bearish and the weekly chart shows a trading channel with a base near 125 so that would be the Low to target in any continued sell off.


