The page contains examples of FX Index Alignment for Risk On:
Risk on:
- price is above the Cloud on the EURX for both daily and 4hr time frames AND
- price is below the Cloud on the USDX for both daily and 4hr time frames.
FX Index Alignment is quite rare but offers enhanced trend trading conditions and so should be harnessed at the earliest possibility.
FX Ichimoku Cloud Alignment often results in:
- More reliable TC trend signals on the 4hr time frame.
- Longer duration trends from any TC signals.
- TC signals that deliver a large number of pips (often in the order of hundreds)
- A less choppy and, thus, safer trend-trading environment.
Example: July / August 2020
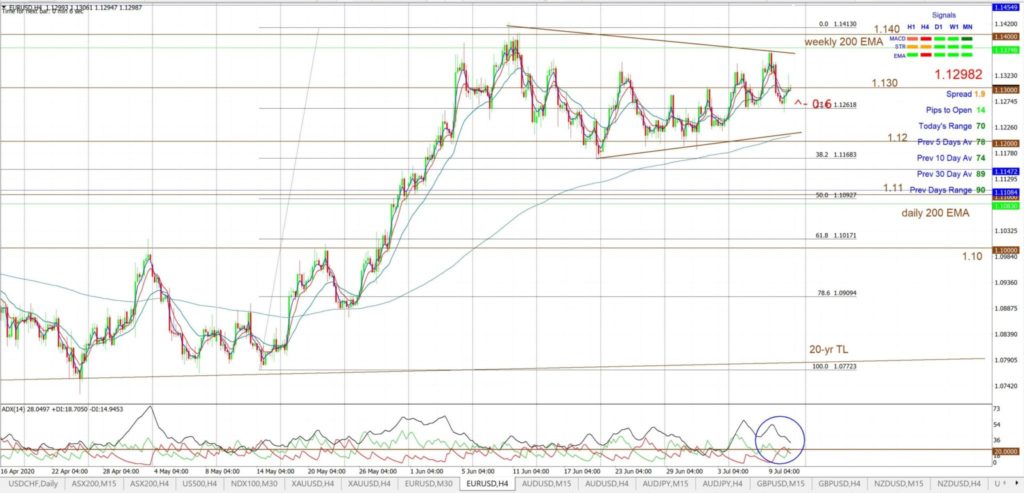
The Forex Indices moved into risk on alignment in mid July and this was noted in my post of July 11th. In this post I noted the implications for bullish potential with the EUR/USD. The EUR/USD chart was posted the next day, on July 12th, and is shown below.
EUR/USD 4hr: chart shown on the w/e July 12th where risk-on FX Index alignment noted:
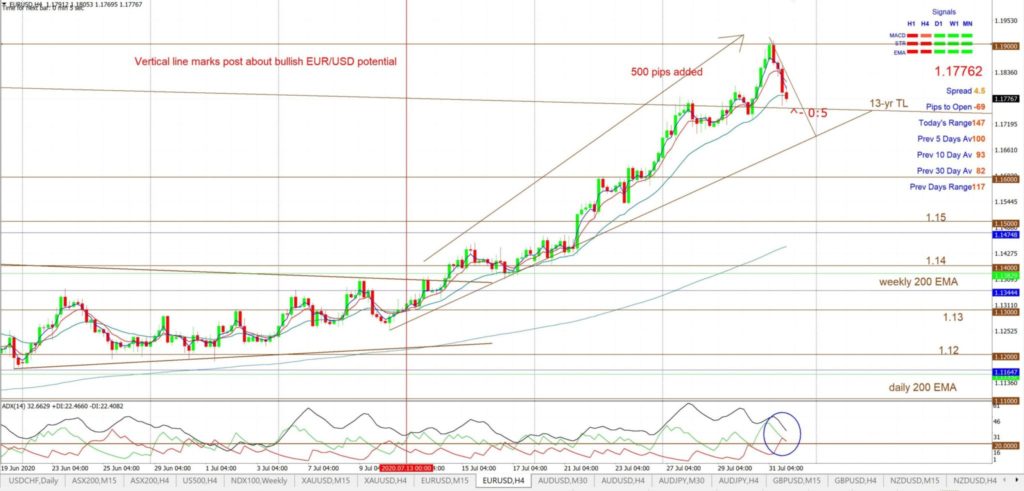
It only took a few weeks but by August 2nd the EUR/USD had made a bullish breakout that delivered over 500 pips!
EUR/USD 4hr: chart after the bullish breakout and after adding 500 pips!
Example: May / June 2020
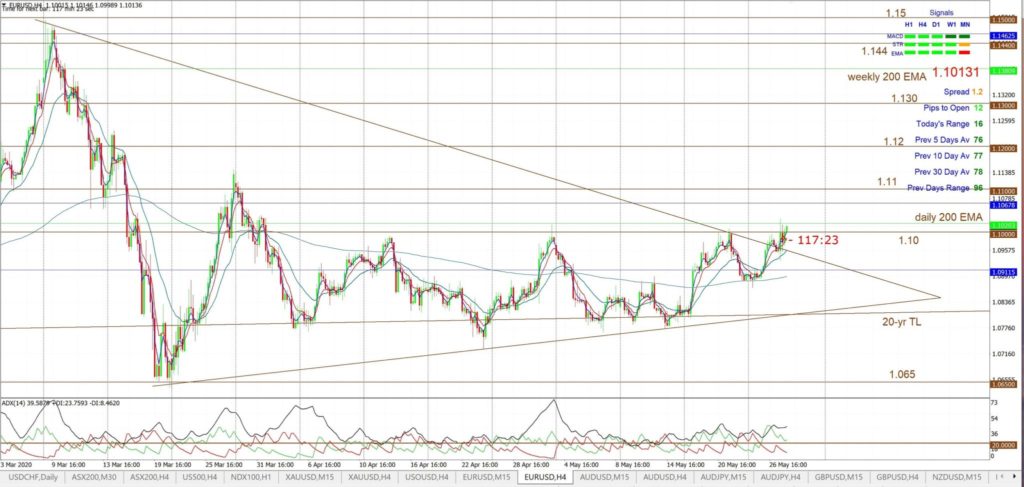
The Forex Indices slipped into new alignment for risk on around May 28th 2020. My weekend FX Index analysis post on May 30th announced this new risk on alignment.
This was the chart of the EUR/USD on May 28th where the triangle trend line had been broken but the key 1.10 level was in focus:
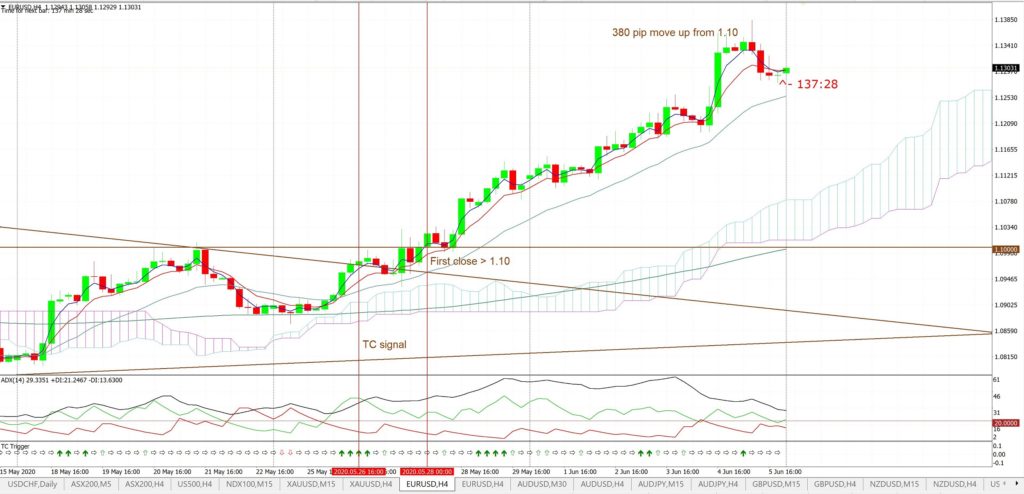
This expanded view of the EUR/USD shows that price action kicked on with the new FX Index alignment and gave a 380 pip move above the 1.10 level. Note how there was a TC signal prior to this breakout above 1.10 though:
Concluding comment: Forex Index alignment that evolves with a chart pattern trend line breakout is a powerful trade combination and offers a high probability outcome.
Example: February 2018
The week had opened with NO FX Index Alignment and this resulted in just one 4hr chart-based trend line breakout up until the Thursday and that was on the GBP/AUD cross pair. The FX Indices slipped back into alignment for ‘risk on‘ during Thursday’s US session and this translated into numerous new trend line breakouts and TC signals triggering during that session.
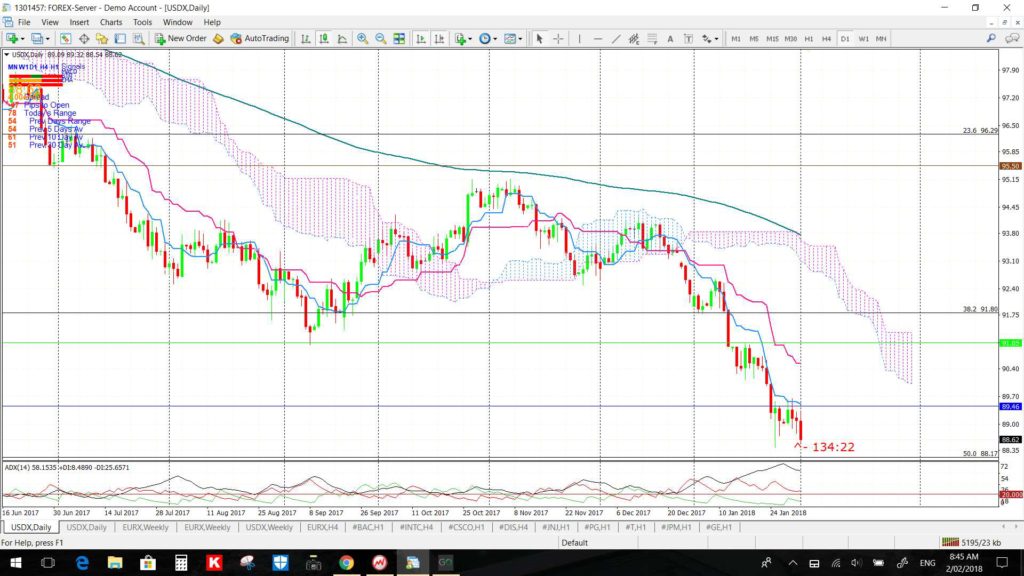
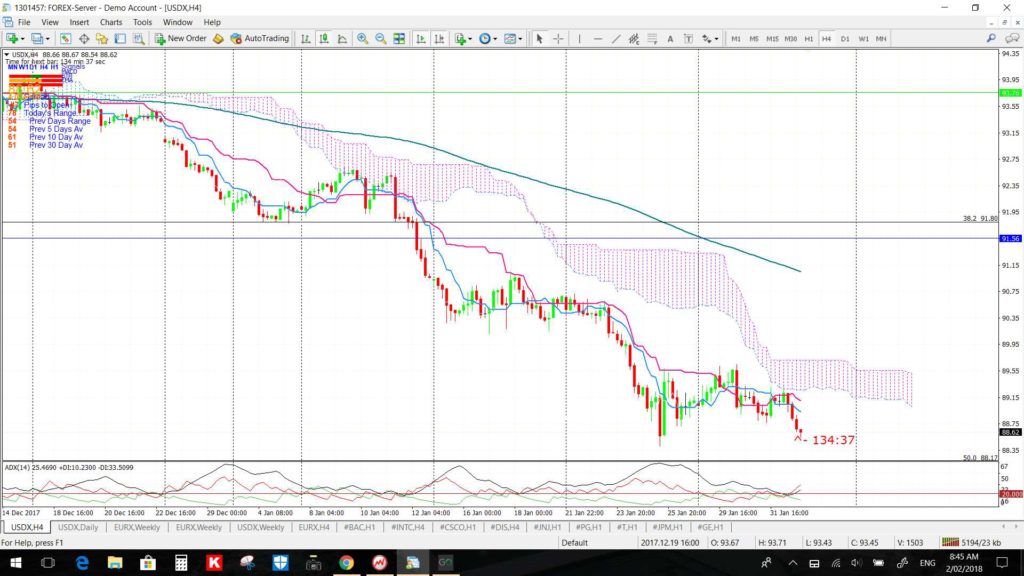
USDX: the US$ index had been in SHORT US$ mode on both the daily and 4hr charts for over one month:
USDX daily: below the Cloud here for over a month now:
USDX 4hr: below the Cloud for most of the last 6 weeks:
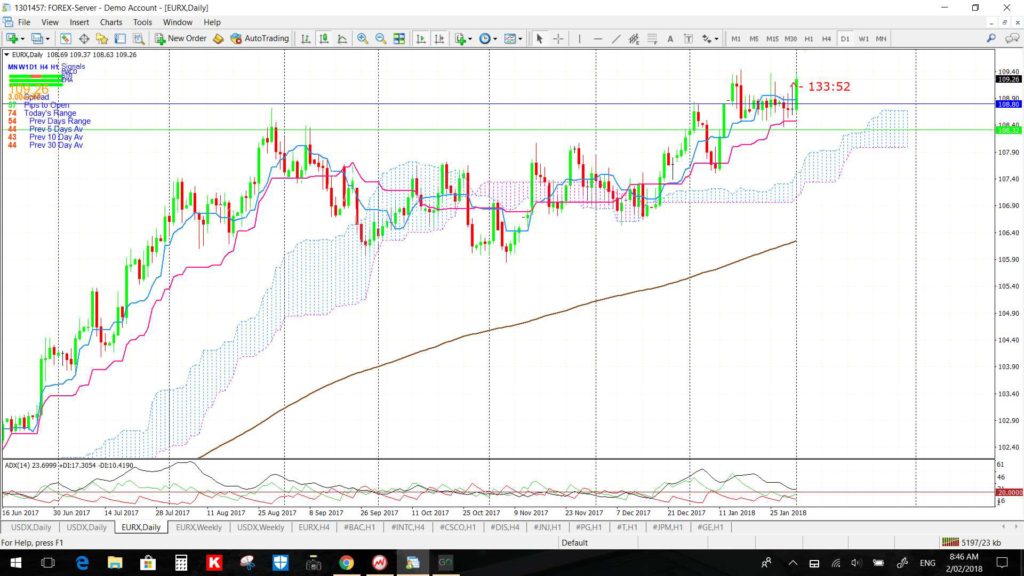
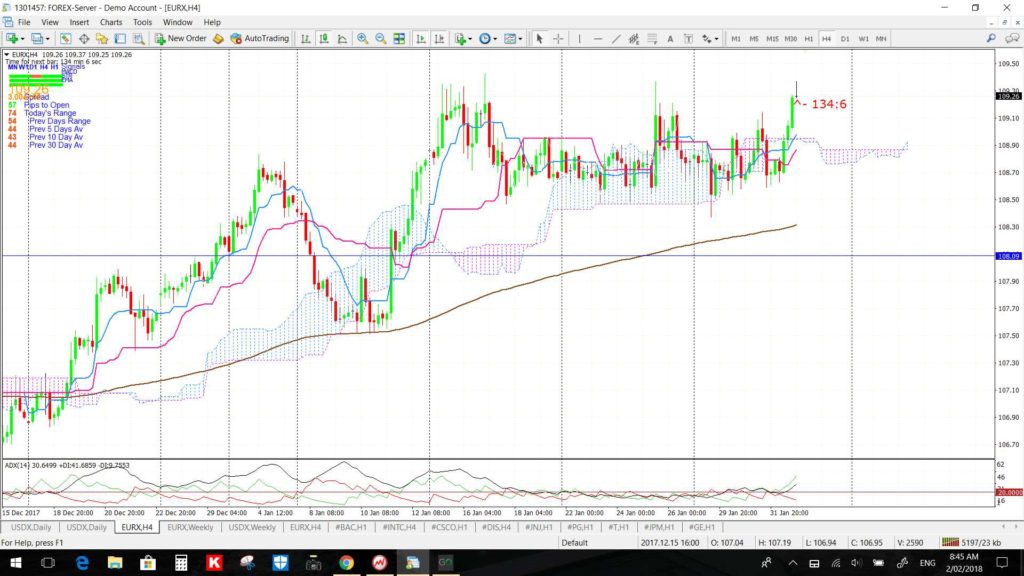
EURX: Price has been above the daily Cloud for some time but slipped above the 4hr Cloud last session which helped to develop some new trend line breakouts and TC signals:
EURX daily: price has been above the Cloud here for over a month now:
EURX 4hr: back above the Cloud during the last trading session which helped to trigger FX Index Alignment:
Trend line breakouts and TC signals: the renewed FX Index Alignment for ‘risk on’ helped to trigger new trend line breakout and TC signals. During this period TC signals that were for LONG EUR$ or SHORT US$ would have been preferred:
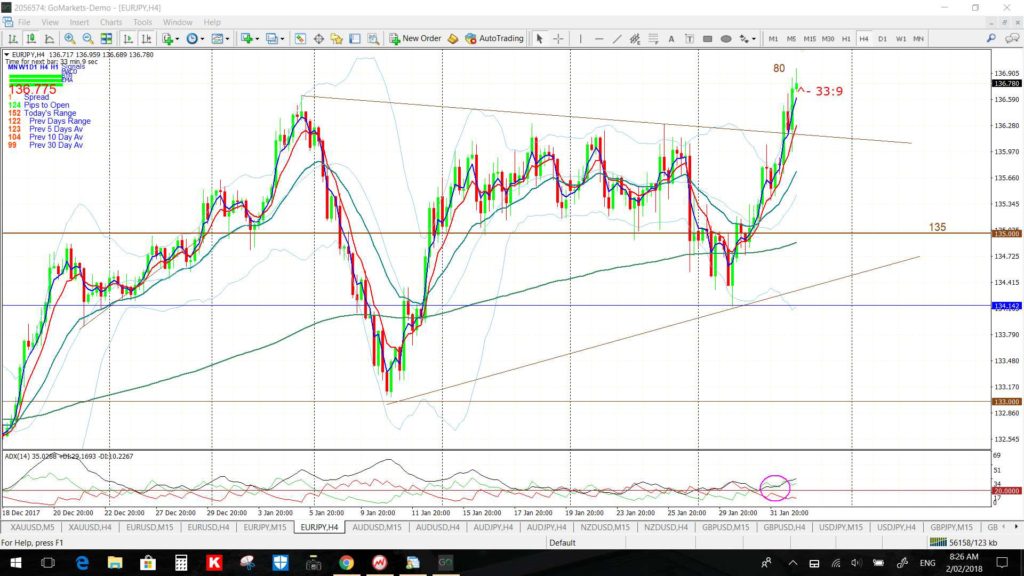
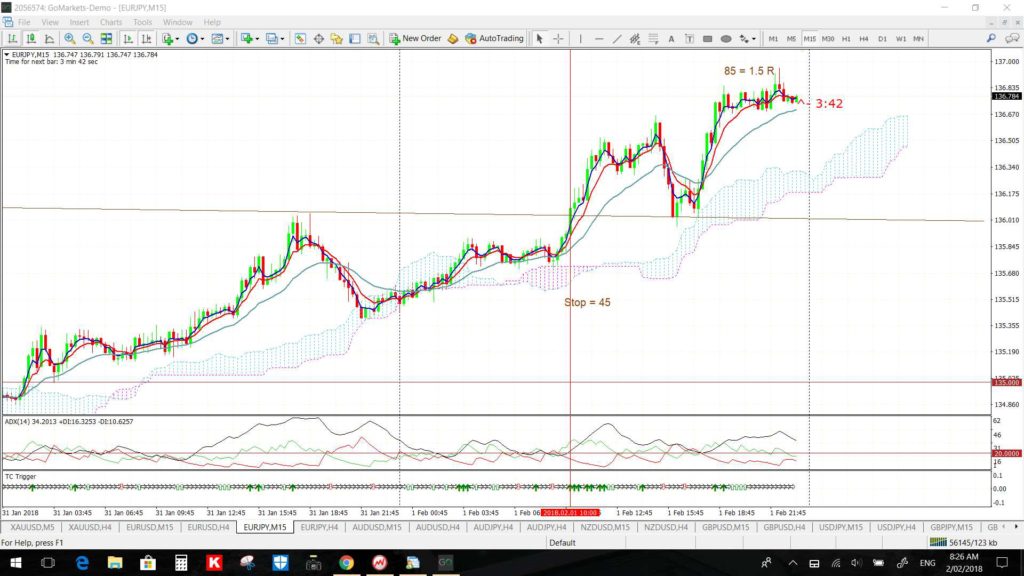
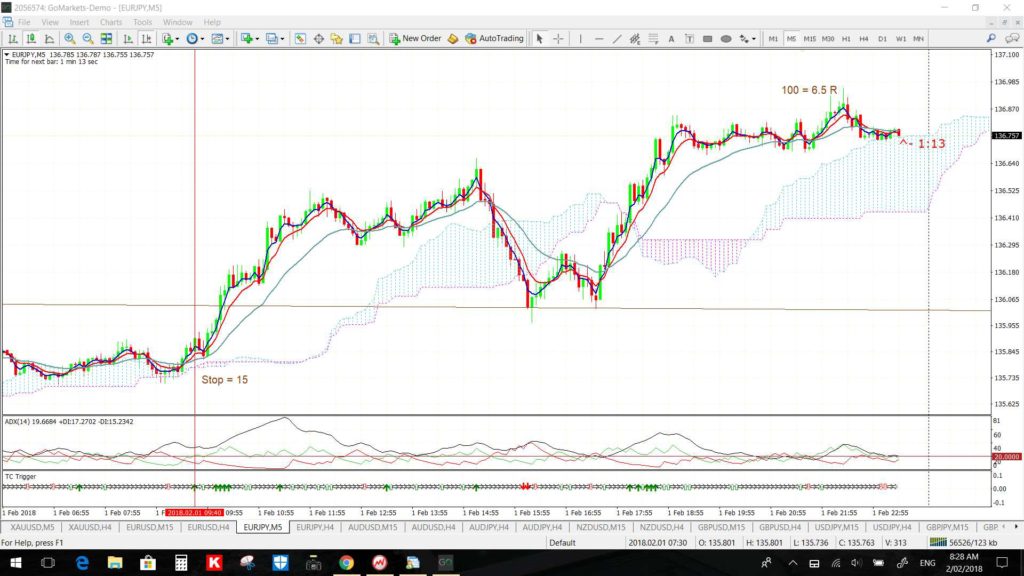
EUR/JPY: EUR strength helped to trigger a new trend line breakout here with TC signals off the 15 and 5 minutes charts:
EUR/JPY 4hr: 80 pips for now:
EUR/JPY 15 min: a TC signal for 1.5 R here:
EUR/JPY 5 min: a TC signal for 6.5 R here:
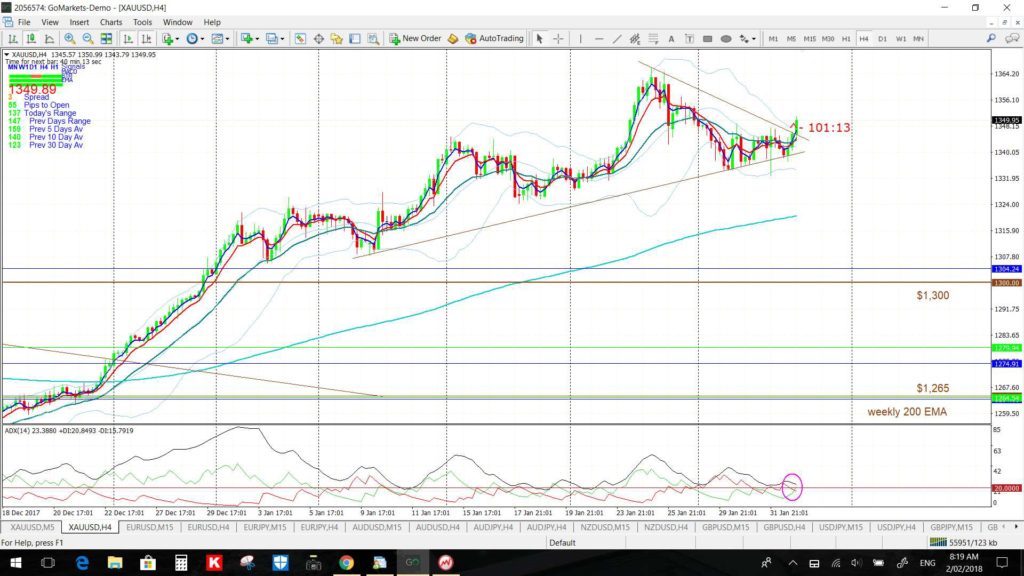
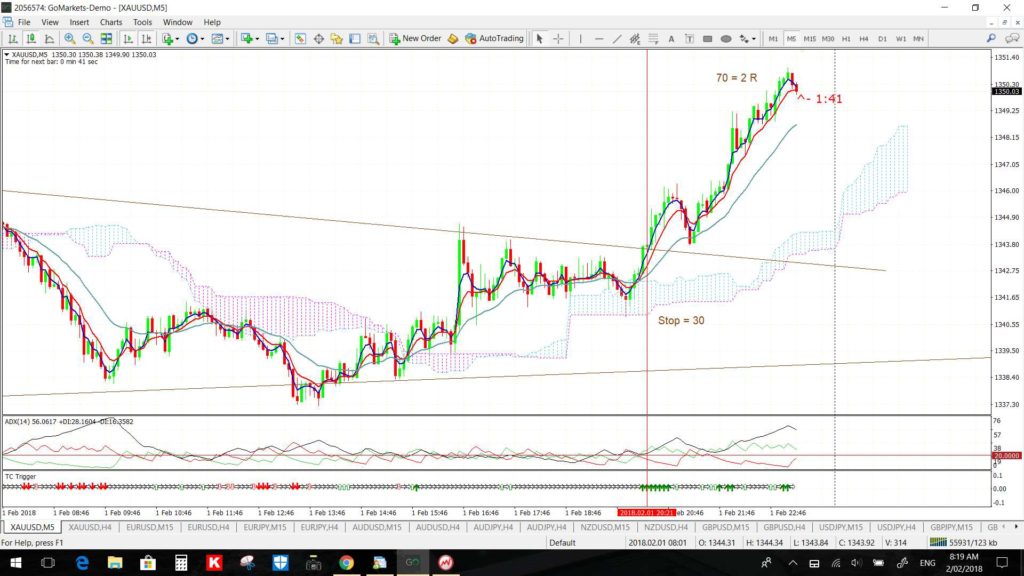
Gold: US$ weakness helped to trigger a new trend line breakout here:
Gold 4hr: a new trend line breakout due to US$ weakness:
Gold 5 min: a TC signal for 2 R here:
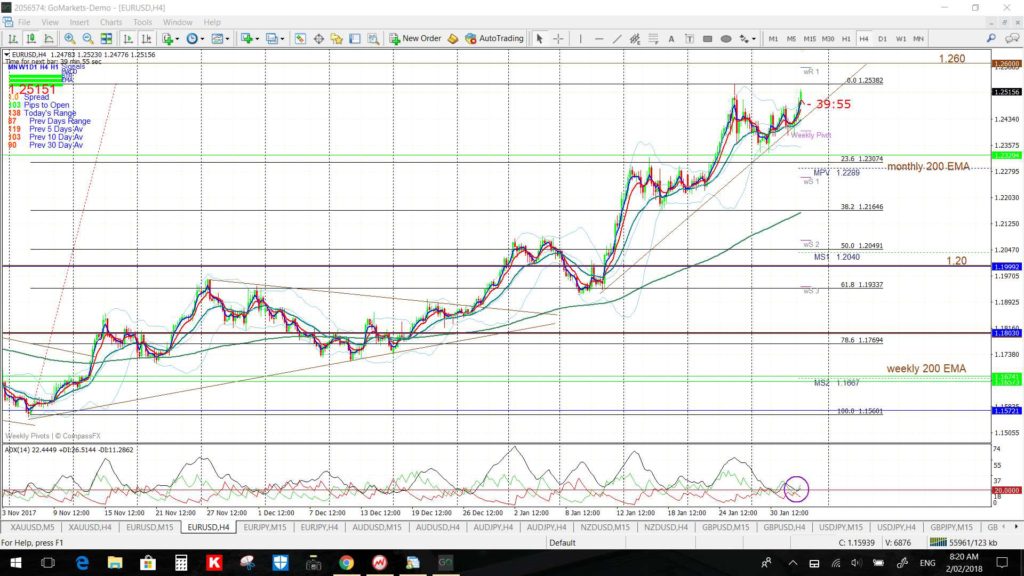
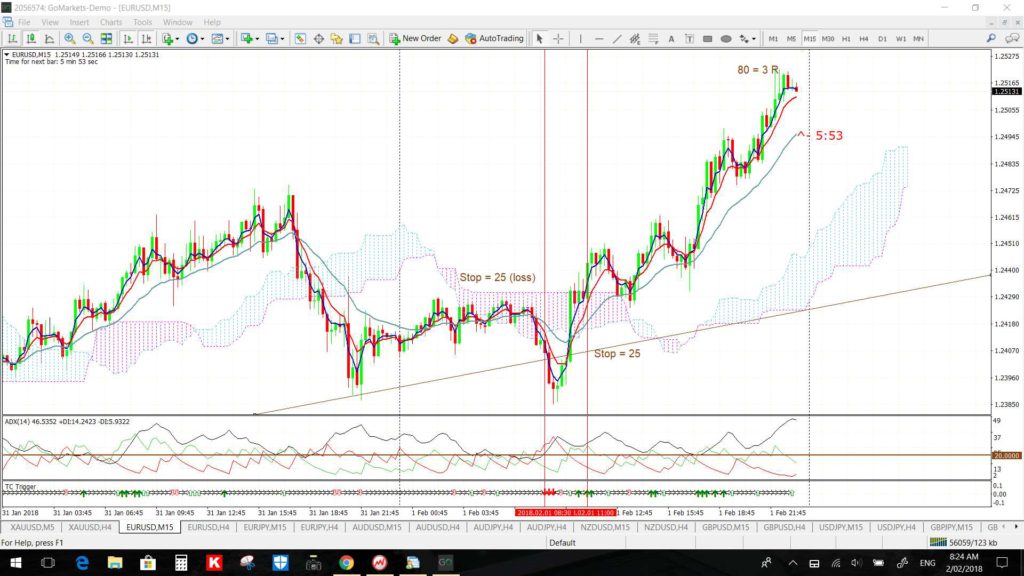
EUR/USD: There was no 4hr chart breakout here just yet, however, EUR strength helped to trigger a decent TC signal here off the 15 min chart for 3 R:
EUR/USD 4hr: watch 1.260 for any new make or break:
EUR/USD 15 min: there was a SHORT signal here that was a loss BUT I would only have been looking for LONG signals given the Index Alignment. This TC signal gave 3 R:
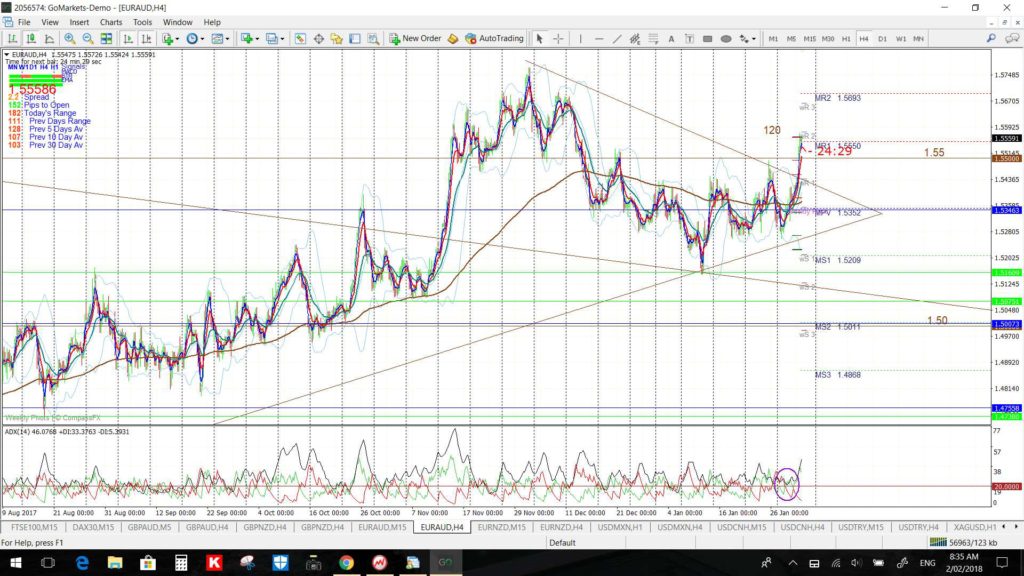
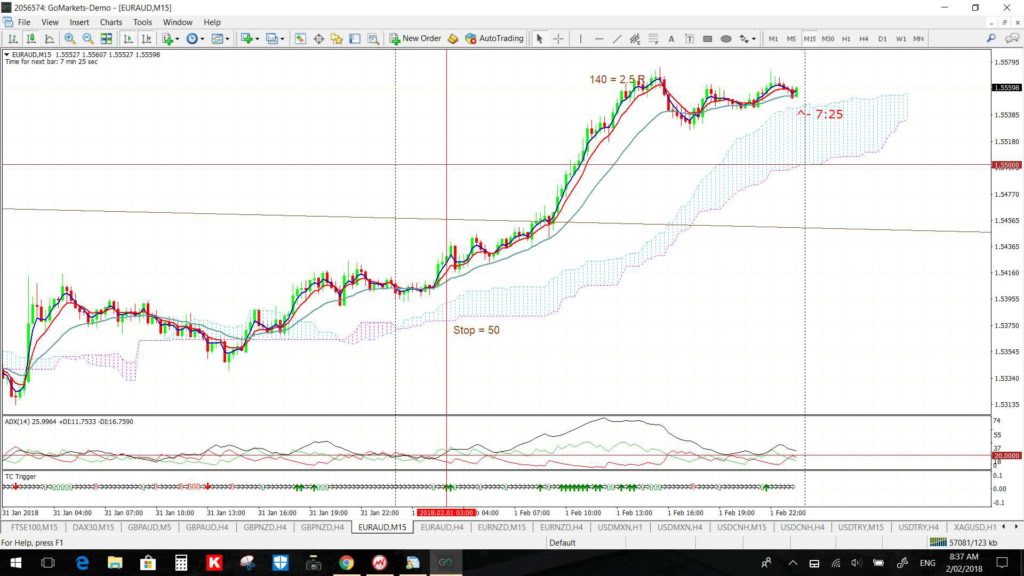
EUR/AUD: EUR strength helped to trigger a new trend line breakout here and a move above the major 1.55 level with a decent 15 min chart TC signals as well:
EUR/AUD 4hr: 120 pips:
EUR/AUD 15 min: a TC signal here for 2.5 R:
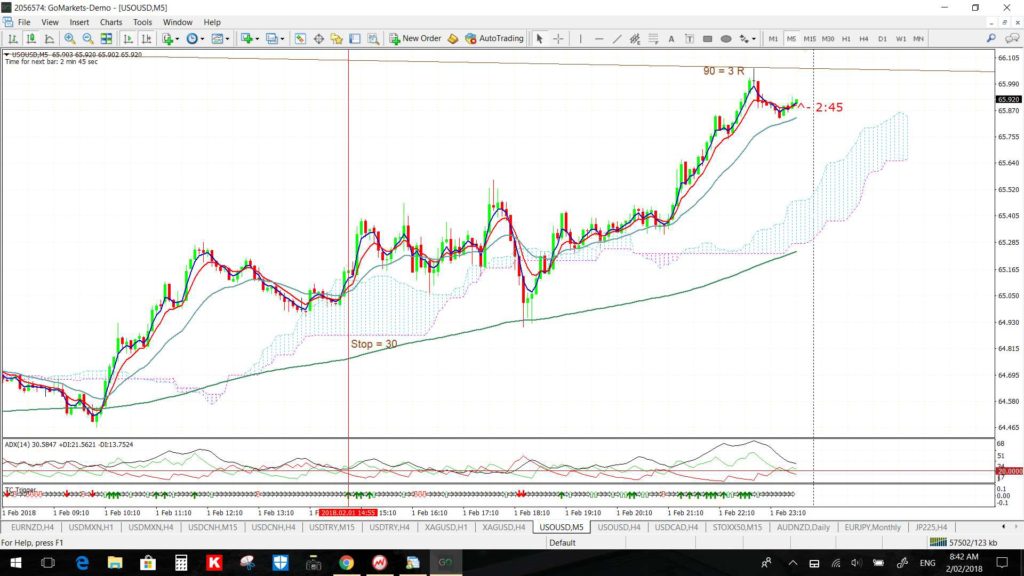
Oil: no 4hr chart breakout just yet but US$ weakness helped to trigger a decent TC LONG signal for 3 R off the 5 min chart during the US session:
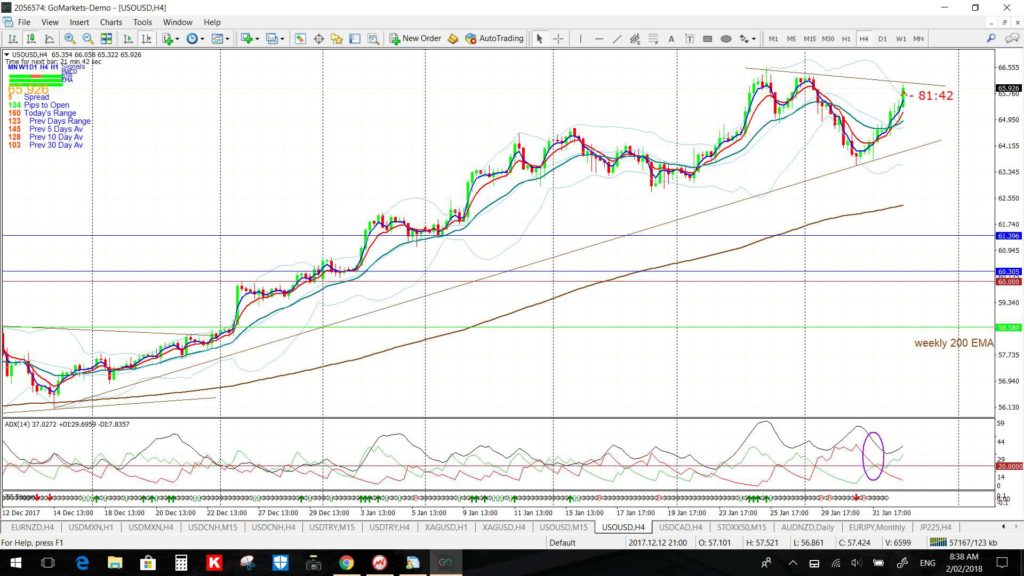
Oil 4hr: watch for any new breakout:
Oil 5 min: a TC signal for 3 R here:
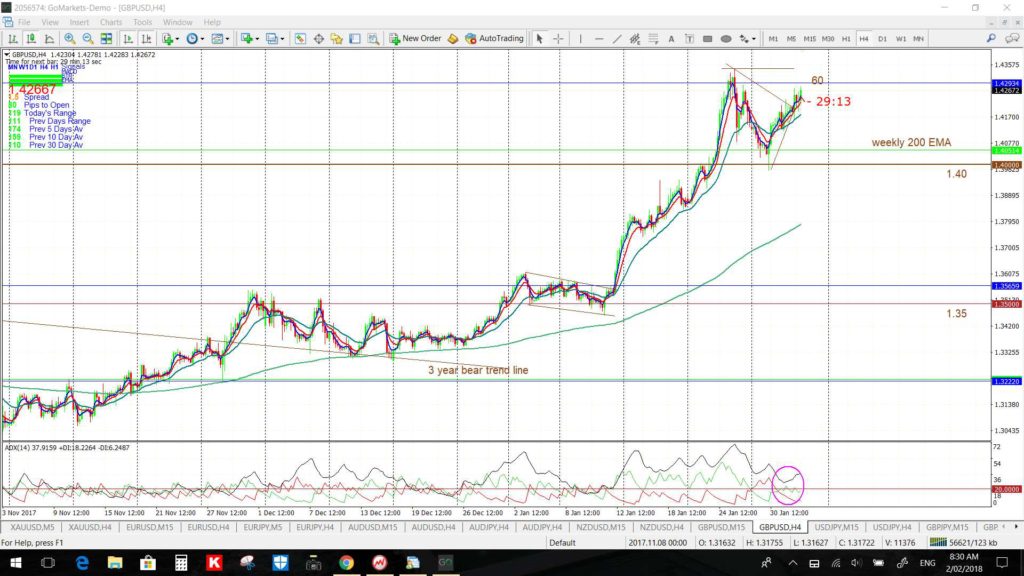
GBP/USD 4hr: US$ weakness helped to trigger a choppy trend line breakout for only 60 pips thus far.
Example September 2012
EURX and USDX: The first two weeks of September 2012 were great for ‘risk on’ trading. The EURX daily chart shows that price was above the Cloud for those two weeks. By contrast, the USDX index traded below the Cloud for the same time period.
Currency pairs: All of the major currencies showed great LONG trending opportunities for the 2 week period. An exception back then continued to be the EUR/AUD though.
Example January 2013
EURX and USDX: I had been watching and waiting for, and writing about, this Cloud alignment for some weeks prior to its arrival. The pity for me was that I was away when the trends started and missed the first and best entries. I feel I’ve learned a lot over the 10 days since this alignment kicked in so I’m putting my thoughts down now. By doing this I hope to have a permanent record that I can refer back to so that I don’t make the same mistakes again.
The Ichimoku Cloud alignment kicked in towards the end of the fourth week of January 2013 on Jan 25th. This was the Australia Day Long weekend and we headed away for four days on the Friday morning, the morning when I noticed new TC signals underpinned by the alignment momentum move. The momentum move lasted for the whole of the following week as well and this is the time point I’m at now as I write. This alignment is still in place and so momentum may continue. One thing is for sure and that is that I’ll be watching for it. I will update my notes here for each week that the Ichimoku Cloud alignment is in place.
The alignment faded during the first week of February meaning that this optimum trending environment only last for about a week and a half or about 10 days. It has become very clear to me that these trending periods need to be embraced quickly to mamimise profits.
Currency pairs:
The moves during the first week of Cloud alignment delivered 1,470 pips on just the E/U, E/J and EUR/AUD alone. That is equivalent to 3 months worth of trading being achieved in just one week! That is a spectacular haul of pips and, the alignment has not waned as yet. There may be many more pips to come! The Cloud alignment that produced these great moves below only lasted for about a week and a half but delivered a huge amount of pips.
E/U: As at 3/2/13: The E/U moved from the weekly 200 EMA, at the 1.335 level, to end up spiking the 1.37 level during the first week of Cloud alignment. That was a move of 350 pips. I had been emphasising to watch for a break up from the weekly 200 EMA for weeks. This break came on the day we left for holidays!
 As at 5/2/13: The EURX and USDX were both approaching possible major road blocks. It was not surprising then to see a little bit of a retrace and some risk on creep into the market during the Asian session on the Monday to start the week. It was not at all surprising then to expect, and see, some pull back with the E/U, E/J, EUR/AUD and the S&P500. This gave a fairly clean SHORT and counter trend trade opportunity off the 30 min charts during the late London and US trading session. This short trade gave an 85 pip haul though:
E/J: As at 3/2/13: The E/J had been bouncing around the key S/R level of 120 for about a week or so and this was a level I had been stressing to watch for. A new TC signal came as price punched through this 120 level and then rallied to the 127 level. This was a move of 700 pips that also came through on the day we left for holidays. The 123 level was the key level during the next week and price bounced around here for a bit before finally heading to the 127 level. One thing I have noticed here over the last week is that major levels get re-tested, often more than once. So, you either need a wide stop and to be patient or you could trade each of these moves several times.
EUR/AUD: As at 3/2/13: The 1.28 level had been a major S/R level for this pair and one that I had been stalking for some weeks. Price produced a new TC signal and moved up through this 1.28 level…you guessed it…on the day I left for holidays. Price rallied from there over the next week to finish up almost near the 1.32 level. That was a move of over 400 pips. The 1.3 level was the level to watch for during the following week when I came back from holidays. Price bounced around there for a bit before finally taking off. Yet again, major levels were being re-tested.


