Despite all of the risk events making headlines around the world, US stocks are carving out decent gains with the major stock indices making or testing all time Highs. In this free post I apply the Fibonacci Extension tool on monthly charts for four of the US majors to see what light, if any, this might shed on any continuation moves.
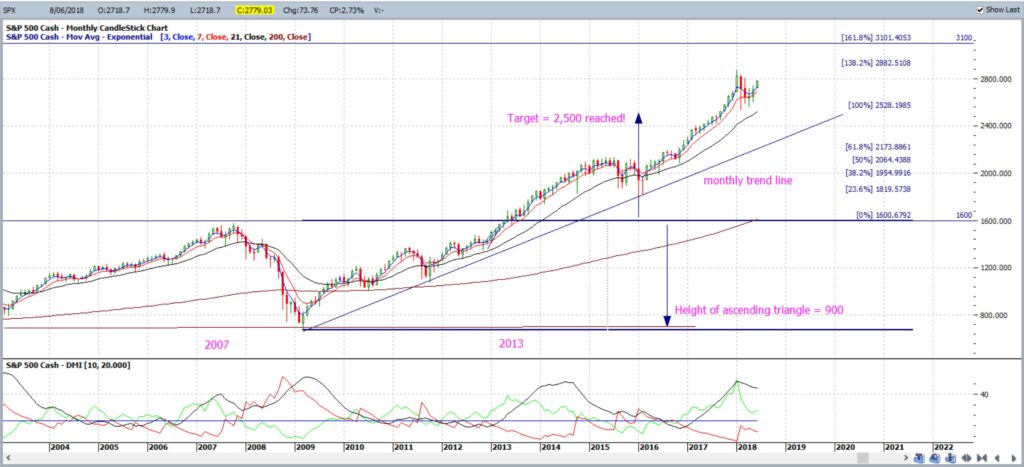
S&P500 monthly: The Fibonacci Extension has been placed on the move from 2009 to the breakout in 2013. Note how the 100% extension has been achieved and the next major level is the 161.8% level; near the 3,100 level. This would make a good target if bullish action continues and price action passes the previous High.
S&P500 weekly: the 2,880 is in sight as the nearest whole number to the recent High:
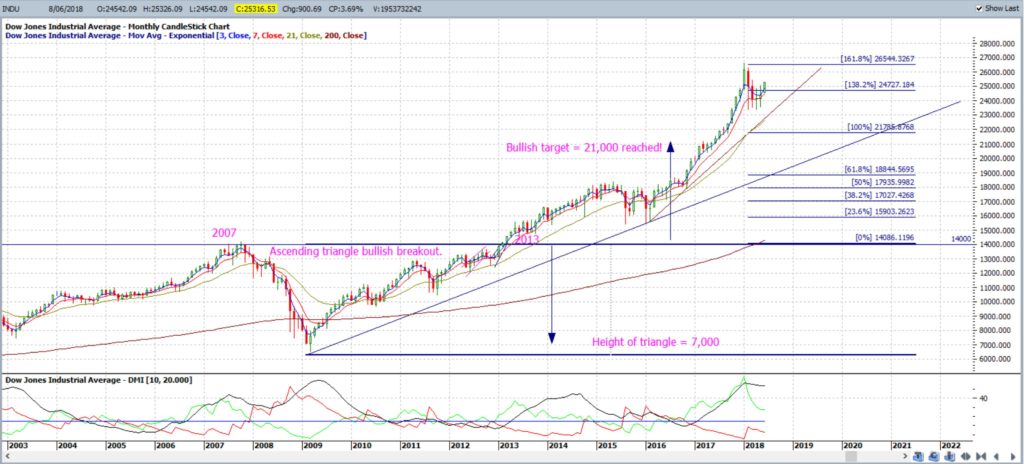
DJIA monthly: The Fibonacci Extension has been placed on the move from 2009 to the breakout in 2013. Note how the 100% extension has been achieved and the next major level is the 161.8% level where price has already peaked. This level is near 27,000 and would make a good target if bullish action continues. Any further continuation would then bring the 200% extension into focus.
NASDAQ monthly: The Fibonacci Extension has been placed on the move from 2009 to the breakout in 2016. Note how price action recently stalled at the the 61.8% level near the 7,600 level. Any continuation past the previous High would bring the 100% level into focus, near 9,200, and this also happens to be the monthly chart’s ascending triangle breakout target.
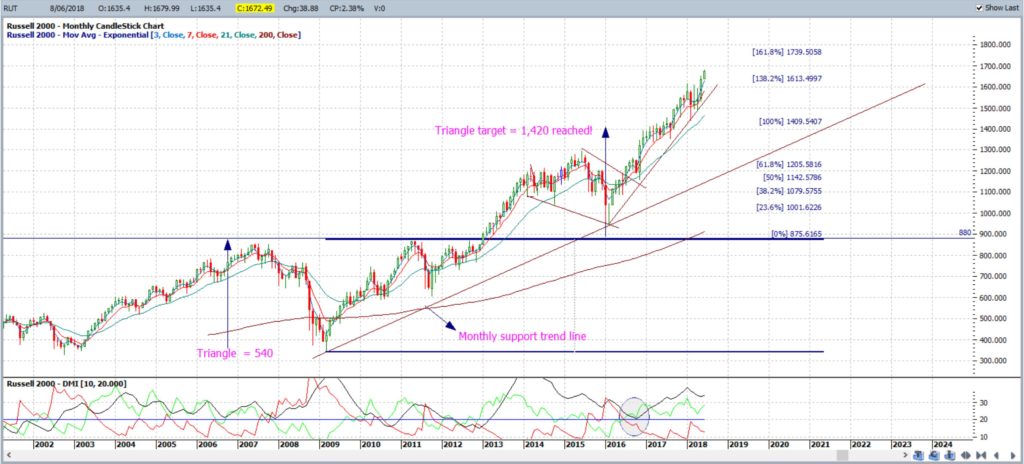
Russell-2000 monthly: The Fibonacci Extension has been placed on the move from 2009 to the breakout in 2013. Note how the 100% extension has been achieved and the next major level is the 161.8% level which is near the 1,740 level. This would make a good target if bullish action continues.
Summary: The four major US stock indices, the S&P500, DJIA, NASDAQ and Russell-2000, are all currently printing bullish monthly candles. The S&P500 and DJIA are trading below their all time Highs but the NASDAQ and Russell-200 are trading at all time High levels. The Fibonacci Extension tool is useful for mapping this movement and to help traders locate possible areas of confluence to identify potential new target levels. The bullish-continuation levels that are in focus on the following indices are summarised below:
- S&P500: the 161.8% level and this is near the 3,100 level.
- DJIA: the 161.8% level, where price has already peaked, near 27,000.
- NASDAQ: the 100% level near 9,200.
- Russell-2000: the 161.8% level which is near the 1,740 level.


