A previous instance of Trade Tariffs was parodied in the movie Ferris Bueller’s Day Off and some might recall the example from the…’anyone, anyone‘ scene. However, the parallel to the current tariff situation cannot be ignored and was the topic of my morning walk podcast which I highly encourage you listen to.
It seems that my podcast hosts are not the only ones drawing parallels between these historic tariffs, The Smoot Hawley tariffs, and the current situation given this above image sourced from bbc.co.uk. The Smoot Hawley tariffs are widely credited for plunging the US economy deeper into the 1930 recession, an era now referred to as the Great Depression. I’ve long looked at the charts of the US major stock indices and wondered what event could trigger a deep pullback to test particular lower support levels and a review back through my posts in the Stocks and Options tab will support this query of mine. Current economic fundamentals don’t seem to support conditions that would trigger such a deep pull but I now wonder, in light of learning about Smoot Hawley, whether the Trump Tariffs might be just the trigger!
In the remainder of this post I once again profile charts of the S&P500, DJIA, NASDAQ and Russell 2000 showing the key support levels I have identified as major support for these entities.
Context: The S&P500 multi-year chart:
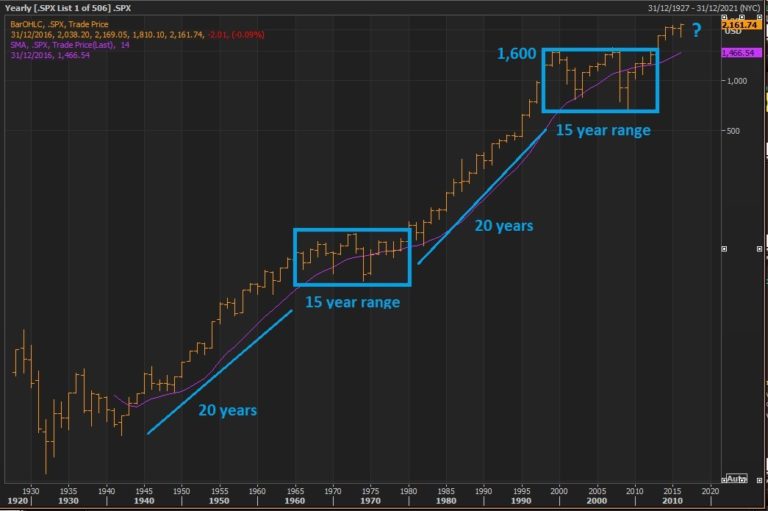
This is the chart that has kept me thinking all this time that some pullback to the key 1,600 level might evolve for the S&P500 and, thus, for the other US stock majors. The chart below is a multi-year Log chart of the S&P500 since the 1930s and there is an obvious pattern developing.
Note how the first 20 year rally was followed by a period of consolidation for 15 years. Note, then, that there was a breakout from this range and push higher for another twenty tears BUT the push higher did not evolve until there was a test of the previous breakout region. Price action broke out from this last 15-year consolidation phase in May 2013 BUT has not yet tested the 1,600 breakout level.
I do believe that 1,600 is the new base, or launch position, of the next long-term trading period for the index but major breakout levels are often tested before continuation moves. I have pondered what event could trigger such a pullback to test this key support level and am now wondering if the Trump-inspired trade tariffs might be just the trigger.
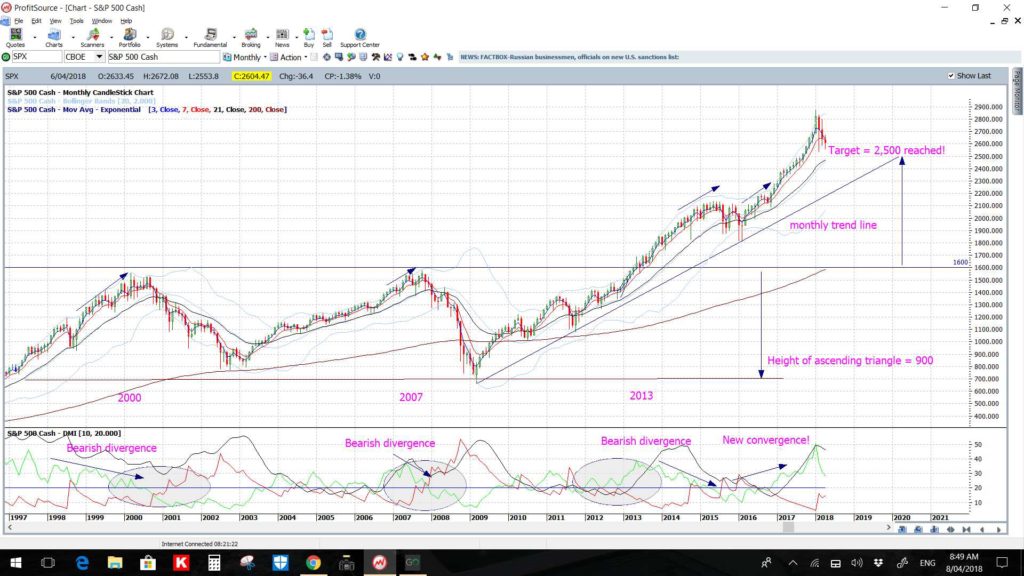
S&P500 monthly: I had the bullish target of 2,500 on my S&P500 charts since July 6th 2014 and the ascending triangle breakout move completed some months ago. After this lengthy rally some pause or pullback would not surprise, even if only just a technical relief pullback.
S&P500 monthly: Placing Fibonacci retracement on the swing high since the 2008 GFC shows that the 61.8% fib level is down near 1,600 and this is a very significant level. The 1,600 level was the previous High and ascending triangle breakout level and this region would be in focus on any serious and deeper pullback:
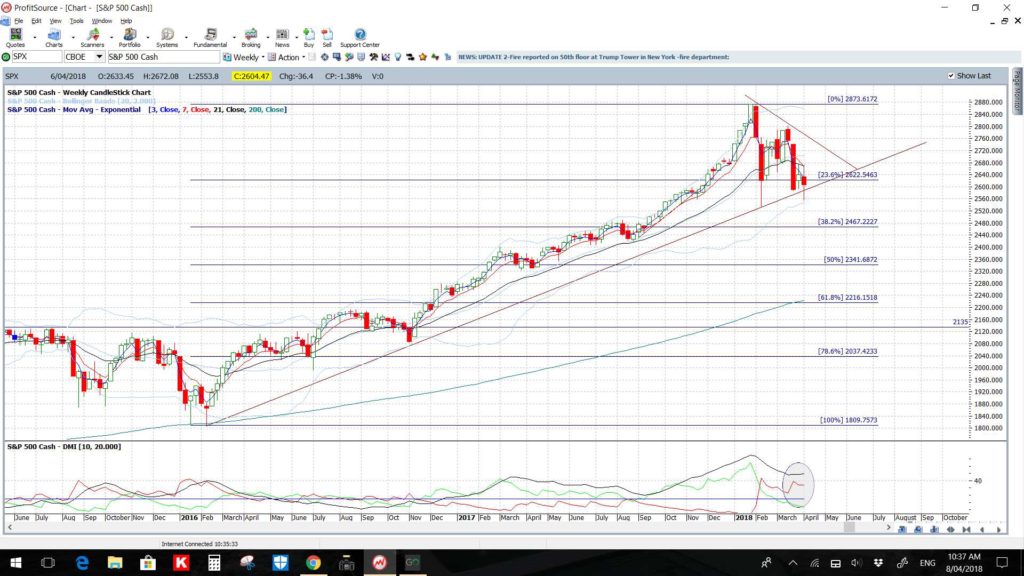
S&P500 weekly: Placing Fibonacci retracement on the last swing high move since 2016 shows that the 61.8% fib level is down near 2,200 and this is near the weekly 200 EMA and just above another S/R level of 2,135. This would be one of the first regions to watch if bearish momentum develops and the trend lines are broken. but note how there has not been a break of this support as yet. However, even if this support trend line is broken, traders need to watch for any Bull Flag style pattern that could develop here.
DJIA:
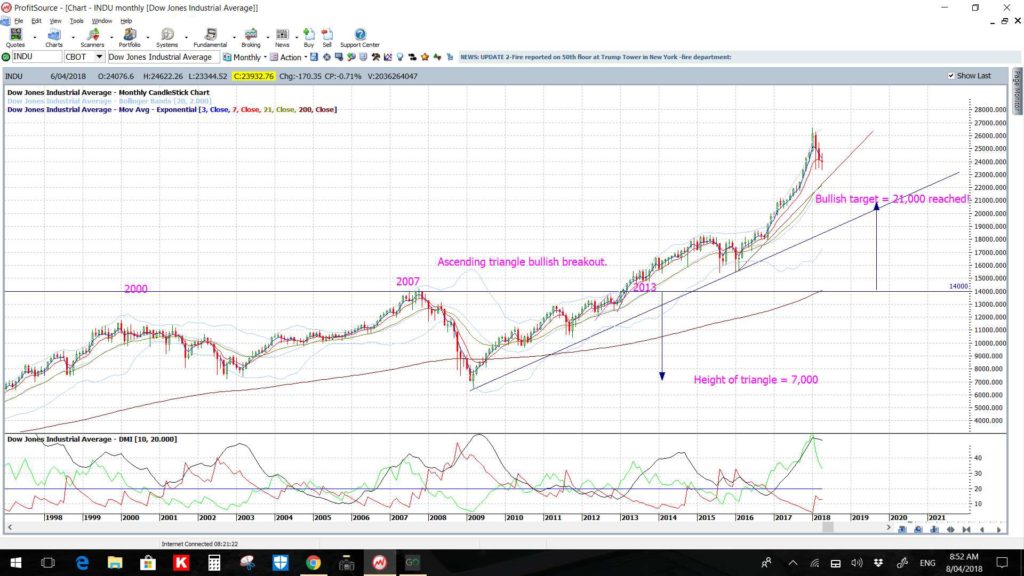
DJIA monthly: As for the S&P500, the ascending triangle breakout move completed some months ago and so a pause could be in order:
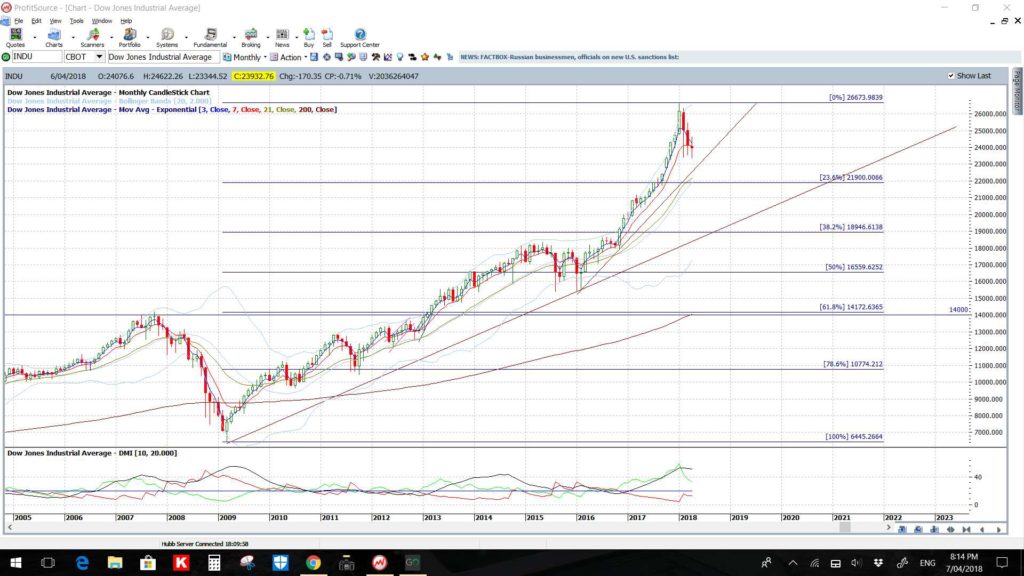
DJIA monthly: Again like the S&P500, placing Fibonacci retracement on the swing high since the 2008 GFC shows that the 61.8% fib level is down near 14,000 and this is a very significant level. The 14,000 level was the previous High and ascending triangle breakout level and would be in focus on any deeper pullback:
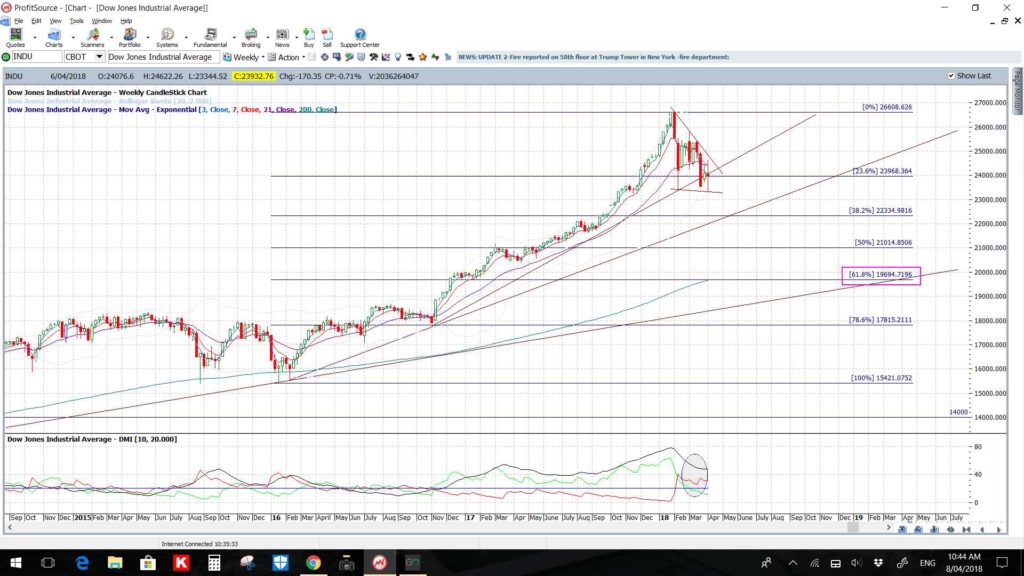
DJIA weekly: Placing Fibonacci retracement on the last swing high move since 2016 shows that the 61.8% fib level is down near the 20,000 whole-number and psychological level and this is also near the weekly 200 EMA. This would be one of the first regions to watch if bearish momentum develops and the upper two trend lines are broken. The first support trend line is being tested at the moment however, like when any support is broken, traders need to watch for any Bull Flag style pattern that could develop here.
NASDAQ:
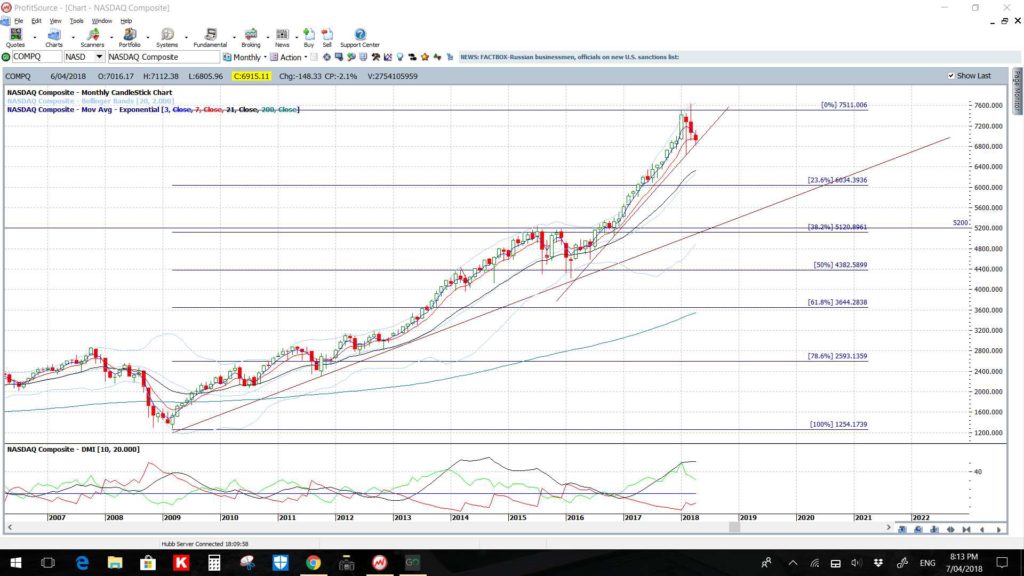
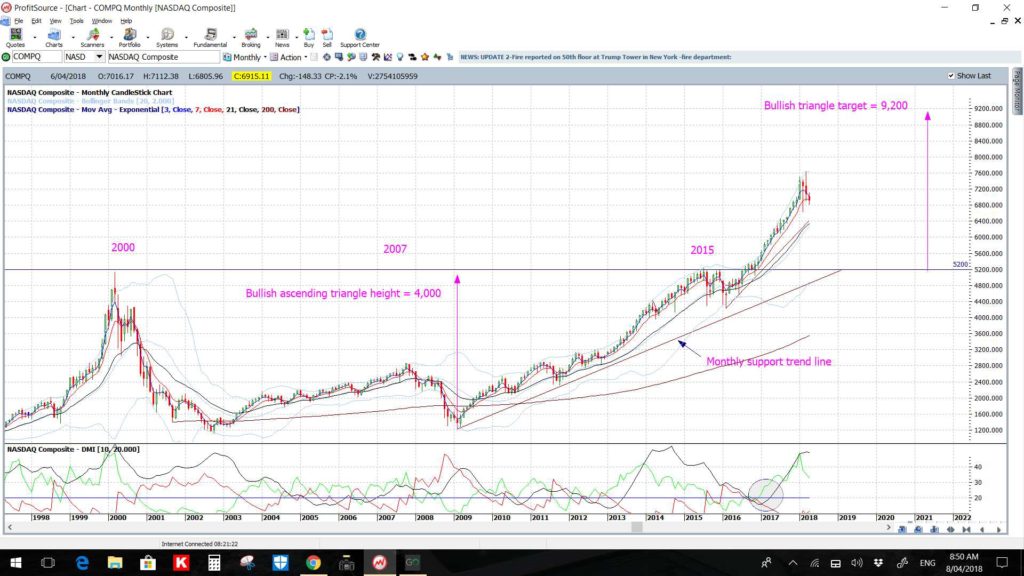
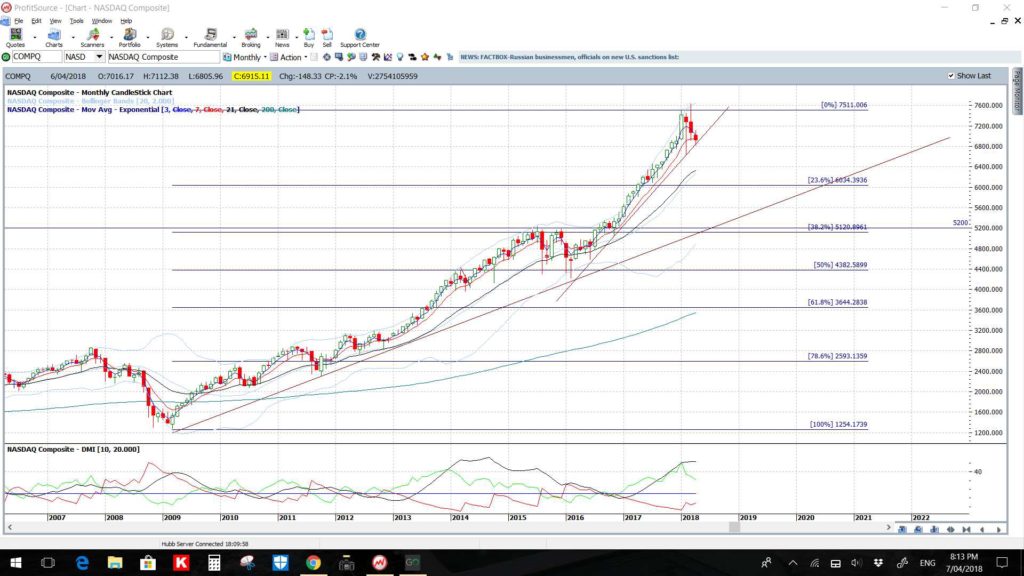
NASDAQ monthly: Unlike the S$P500 and DJIA, the NASDAQ has yet to complete its ascending triangle breakout but looks to have paused for the time being:
NASDAQ monthly: Placing Fibonacci retracement on the swing high since the 2008 GFC shows that the 61.8% fib level is down near 3,600 which is below the ascending triangle breakout level but near the monthly 200 EMA:
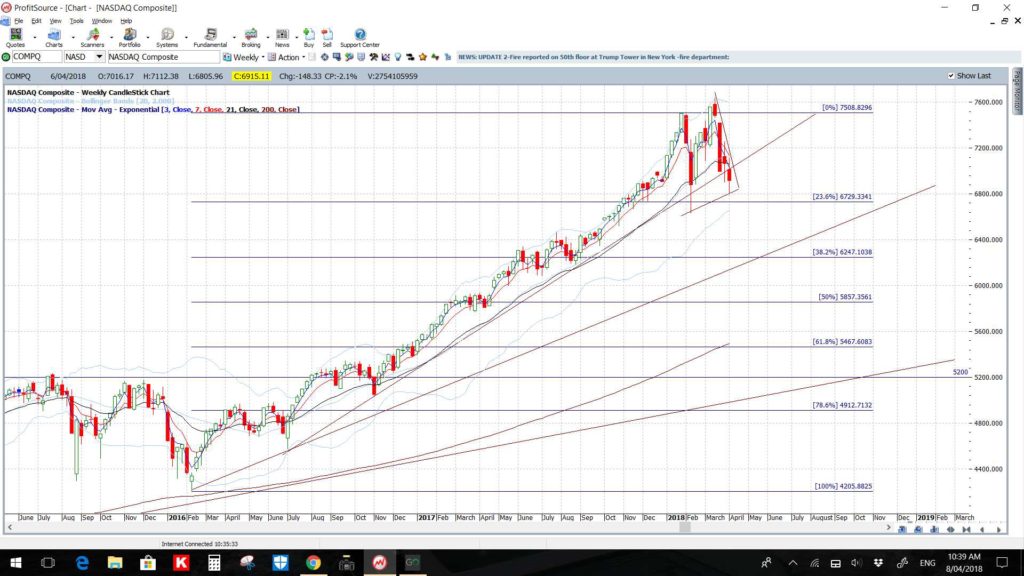
NASDAQ weekly: Note how the weekly support trend line has been broken here but traders need to make sure that this does not form up into a Bull Flag. Placing Fibonacci retracement on the last swing high move since 2016 shows that the 61.8% fib level is down near the ascending triangle breakout level of 5,200 and is also near the weekly 200 EMA. This would be the major region to watch if bearish momentum continues and price breaks below the current Flag:
Russell-2000:
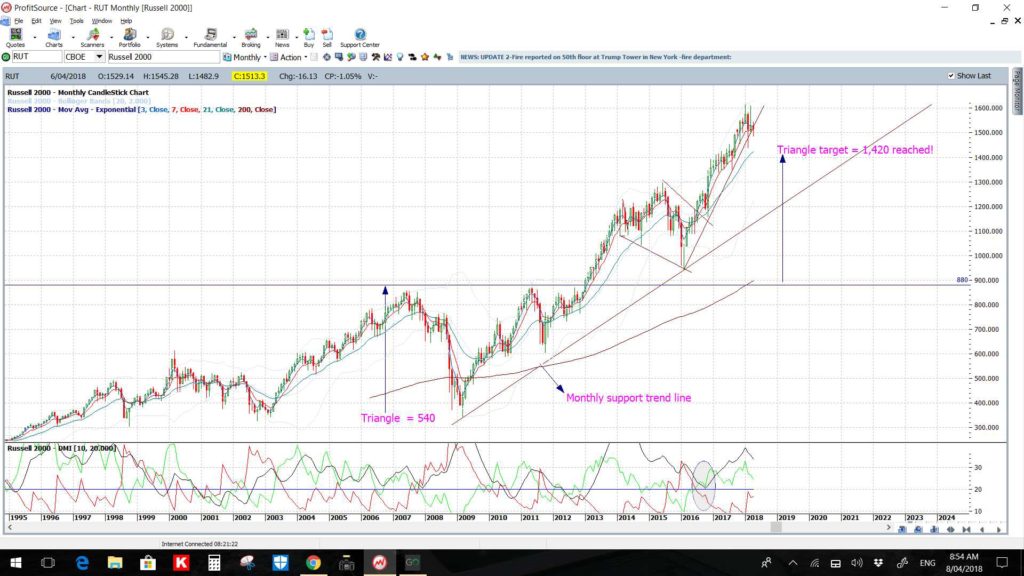
Russell-2000 monthly: Like with the S&P500, the ascending triangle breakout move completed some months ago so a pause could be in order.
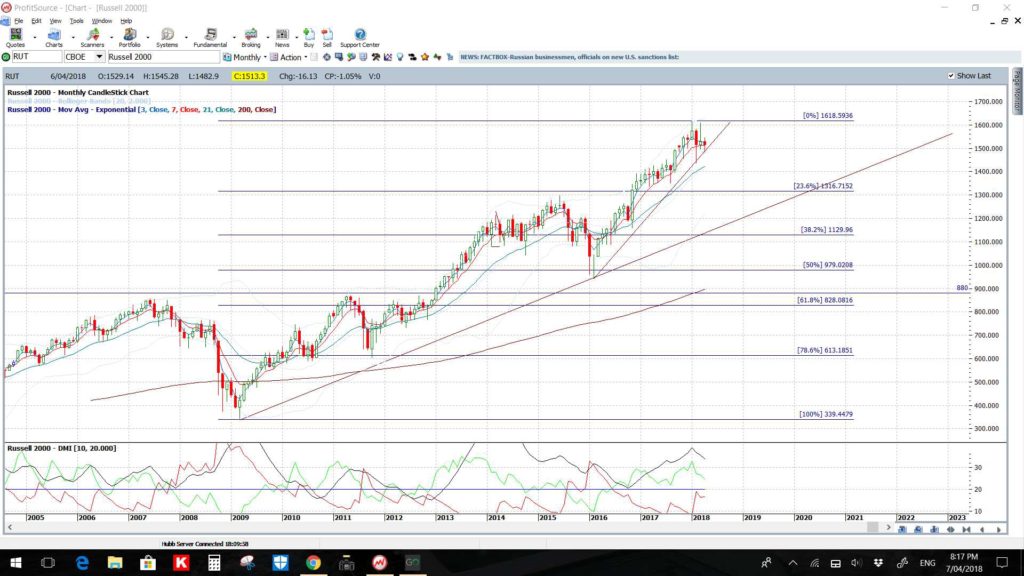
Russell-2000 monthly: Again, like the S&P500, placing Fibonacci retracement on the swing high since the 2008 GFC shows that the 61.8% fib level is down near 880 and this is a very significant level. The 880 level was the previous High and ascending triangle breakout level and would be in focus on any deeper pullback:
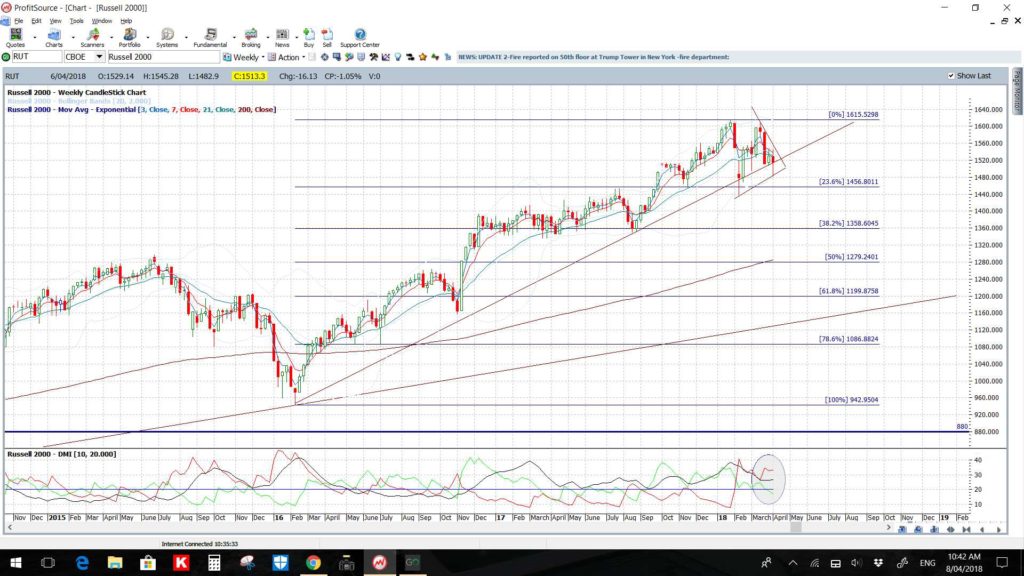
Russell-2000 weekly: Placing Fibonacci retracement on the last swing high move since 2016 shows that the 61.8% fib level is down near 1,200 and this is also not too far from the weekly 200 EMA. This would be the region to watch if bearish momentum develops and the upper support trend line is broken. This support has been tested but there has not been a candle close below as yet. As with the other charts, traders need to watch that price action does not form up into a Bull Flag:
Summary: The four major US stock indices of the S&P500, DJIA, NASDAQ and Russell-2000 have enjoyed a significant rally since bouncing off their 2009 GFC Lows. Recent price action has been volatile but, as the charts above show, most indices continue to hold above key support trend lines and ugly, if it is to come, is not here yet!
I have long wondered what could trigger a technical pullback to test key support levels on these indices given that the current market economic fundamentals don’t seem to support such a move. However, any developing US-China tariff related Trade War could be a trigger to generate such a move and I’ll be watching relevant trend lines, momentum and key support levels to monitor any such development.
Now, I urge…’anyone…..anyone….anyone’ to go and listen to that podcast!


