Facebook has been mired in controversy over recent months and this has finally taking its toll on the stock price. The stock price plunged following the recent miss with earnings and projected slowdown and there is talk of this being the end to their cycle of easy growth.
Interestingly, I listened to an interview of Mark Zuckerberg last week, prior to this stock collapse, recorded on July 18th, and in this Zuckerberg noted that he expects it will take the company about two years to re-group and recover from the Cambridge Analyitica incident.
The chart below shows the impact on FB cash flow that all the recent compliance activity has consumed and this contributed to the overall negative picture for the company. Investors are not the only ones dumping the stock though as Mark Zuckerberg himself has been selling quite a bit too. In fact, he has sold $3.9 Billion worth of stock since the Cambridge Analytica scandal.
Whilst there has been a sharp drop in share price, it is currently holding above a recent and long term support trend line and in the rest of this post I look at technical levels that hold my interest on the price chart for Facebook. The stock price has essentially traded in vertical fashion since mid-2013 and trends do not run in straight lines forever. Some pullback would have had to evolved here eventually, even if there is to be ultimate bullish continuation. I’ll be watching key levels to assess just how much of a pullback Facebook stock might experience.
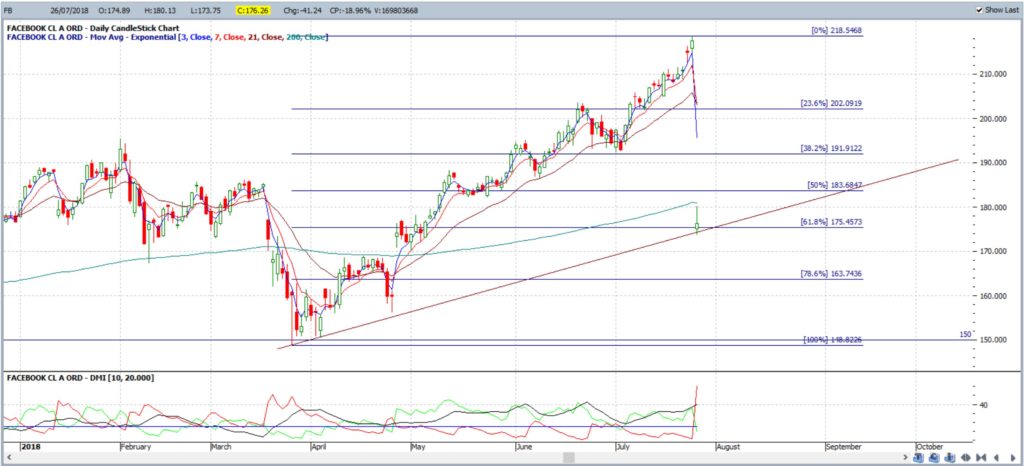
FB daily: the daily chart shows that the most recent swing-high move pivoted off the $150 whole-number level and price action is currently at the 61.8% fib and support trend line of this daily chart move. A weekly close below the $175 level, near the 61.8% fib and support trend line, would bring the $150 S/R level / recent Low into greater focus.
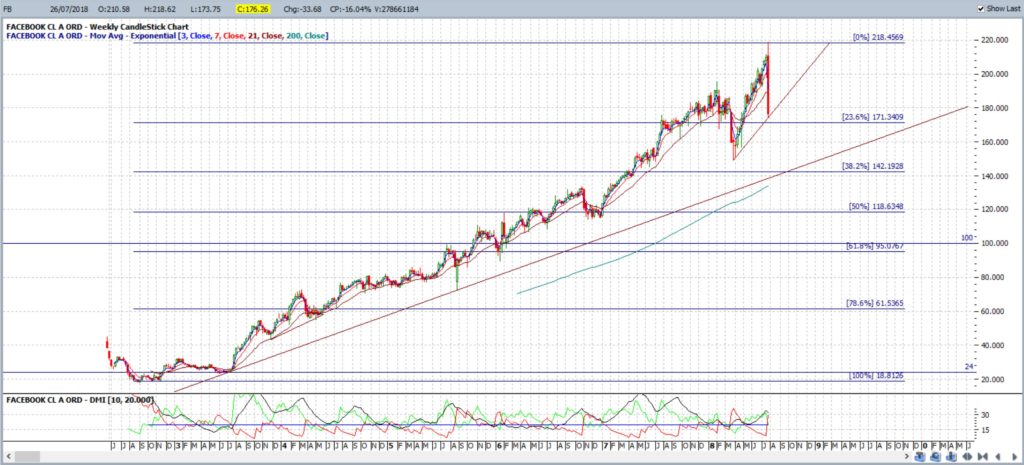
FB weekly: the weekly chart shows the current weekly candle as large and bearish but holding above the recent support trend line; for the time being that is. There is a longer-term support trend line in play here too and this is some way off for now. Note how the 61.8% fib of this longer, weekly chart swing-high move is down near the whole number and psychological level of $100. Any break and hold below $150 would bring the weekly support trend line followed by the $100 level into greater focus:
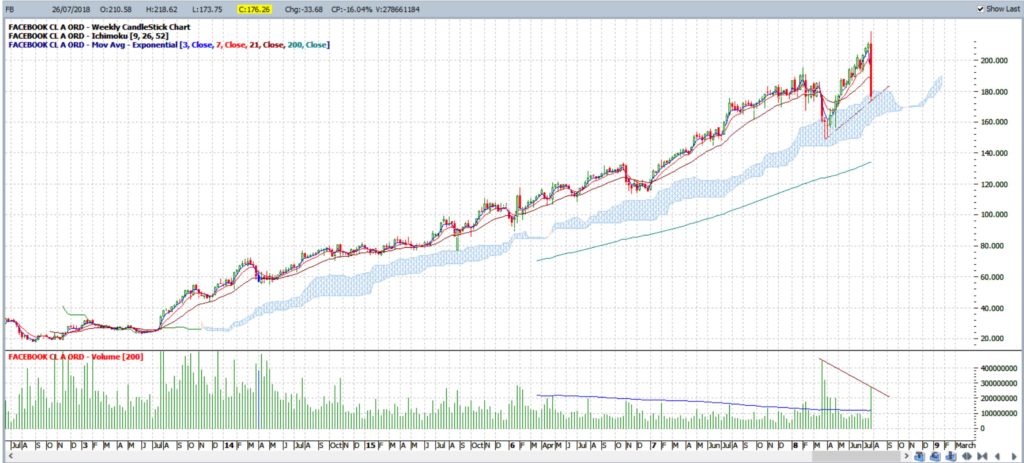
FB weekly Ichimoku Cloud: Price action is currently holding above the weekly Cloud and I will be watching for any dip below this support zone. Any break of this support would have me wary of a potential Bull Flag though but I will attend to those trend lines should the need arise:
Summary: Facebook stock is experiencing a technical pullback following years of almost unabated growth. Whether the company can re-group to recover from recent scandal is not yet clear but the CEO, Mark Zuckerberg, has clearly stated that this is his intention. The stock price might continue to suffer during this period though and there are key technical levels I will be watching as clues to any next movement. In summary, these levels are:
- the bottom of the Ichimoku Cloud (currently circa $160)
- $175: the daily chart’s 61.8% fib and region of support trend line.
- $150: the daily chart’s 100% fib and recent Low.
- $100: the weekly chart’s 61.8% fib.
My husband has been keen to buy some FB stock and so we’ll be watching the $100 rather closely; should price get down that far!


