The TC Trigger for Trading View was developed in late 2018 and is proving to be a valuable trading tool. In this article I review some recent price action across the S&P500 E-mini chart to show how TC can be helpful with identifying trade opportunities. I also explore options that traders can use to identify trade exit signals as this is a critical part of trading and a traders trading plan.
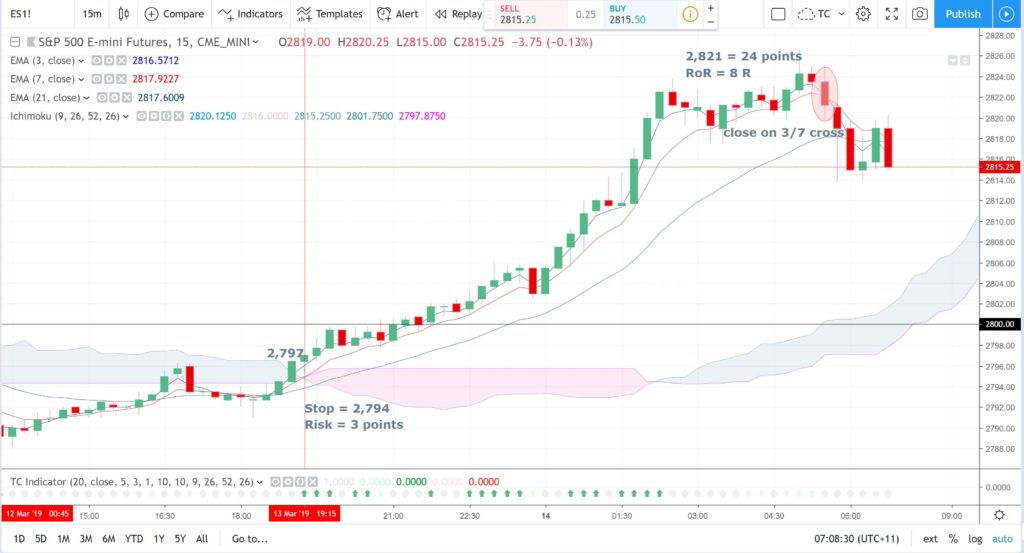
ES 15 min 13/03/19: A low risk TC signal triggered on the Emini here giving a good run for an 8 R trade potential. The exit here would have been best taken on the cross of the 3/7 EMAs where the close was at 2,821 giving a 24 point run.
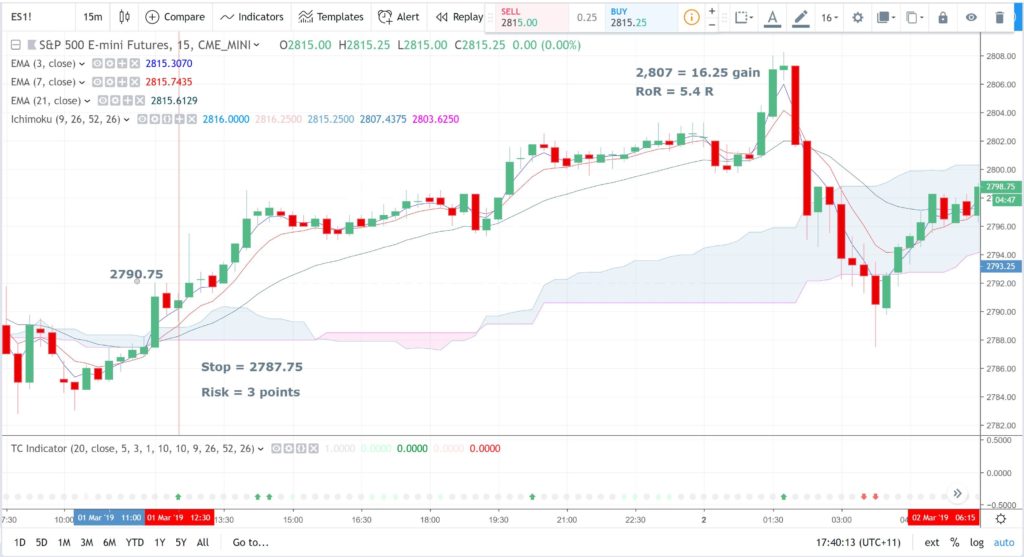
ES 15 min 28/02/19: There was a low-risk trade entry TC signal that triggered on the 28th February 2019 (date stamp is Sydney time) and this gave a maximum move of 16.25 points for 5.4 Return on Risk (R). Traders need to determine their own exit strategy but exit signals could include a close below the 21 EMA, and close of the 3 EMA below the 7 EMA or a close back in the Cloud. The large bearish candle after the bullish coloured Spinning Top may also have been a warning to exit. All of these would render a much lower profit:
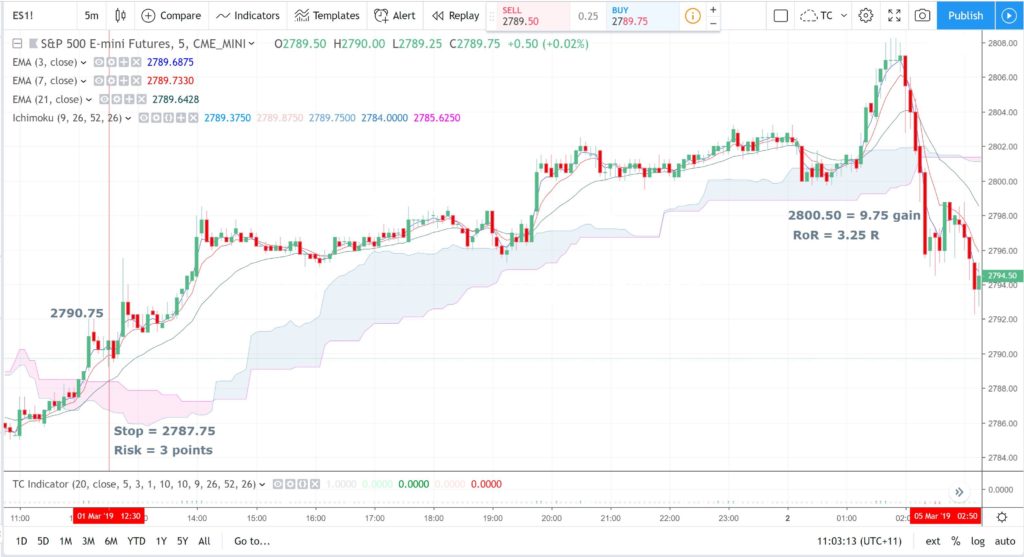
ES 5 min 28/02/19: Dropping down to the 5 min chart may be a more useful way to help identify a trade EXIT signal. As an example, using a candle close back below the Ichimoku Cloud would have yielded a trade result here of 9.75 points for a 3.25 Return on Risk (R). This is obviously much lower than the maximum move and it is frustrating to give up so much of the potential gain but developing a systematic EXIT strategy is very important.
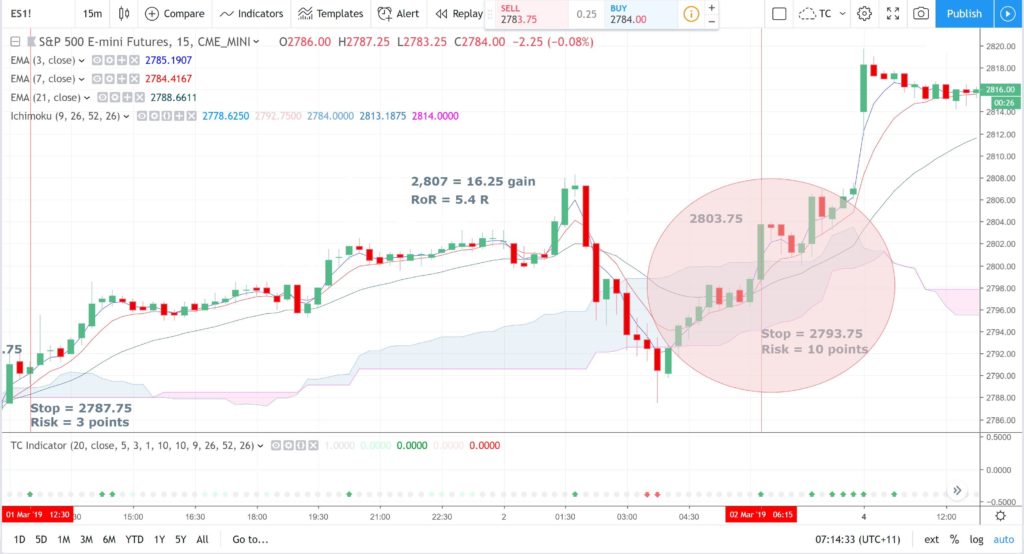
ES 15 min 01/03/19: There was a new TC signal that triggered late on Friday 1st March (date stamp is Sydney time). This signal would have been better left given the time of the week and due to the large Stop that was required.
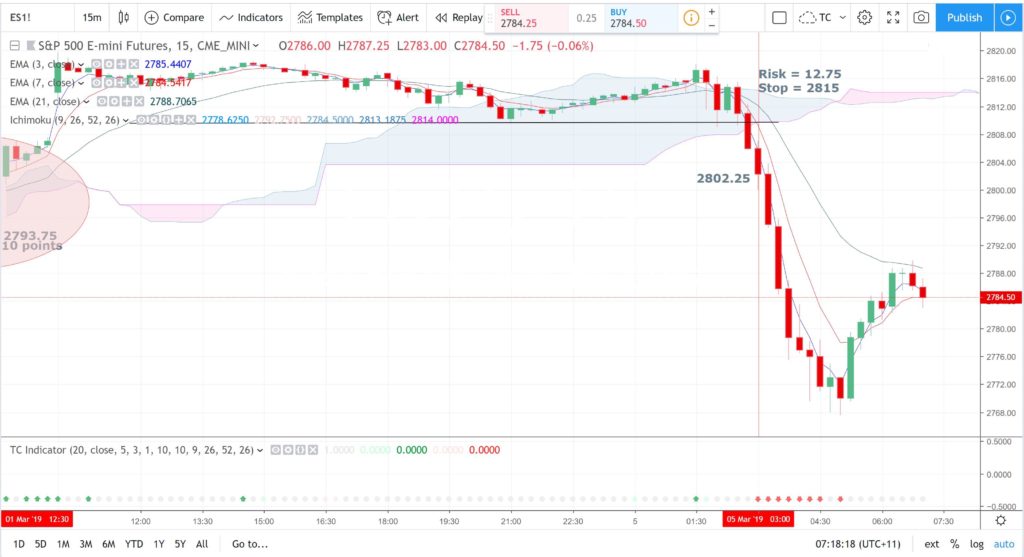
ES 15 min 04/03/19: There was a great TC signal that triggered on Monday 4th March (recall date stamp is Sydney time). This was a new TC signal that came with a trading range breakout and these are generally higher probability trade signals. The problem with the signal off the 15 min chart was that the initial Stop, at 12.75 points, was again too large. Traders should then drop down to the 5 min chart to try to catch a complimentary signal that triggers with the range breakout:
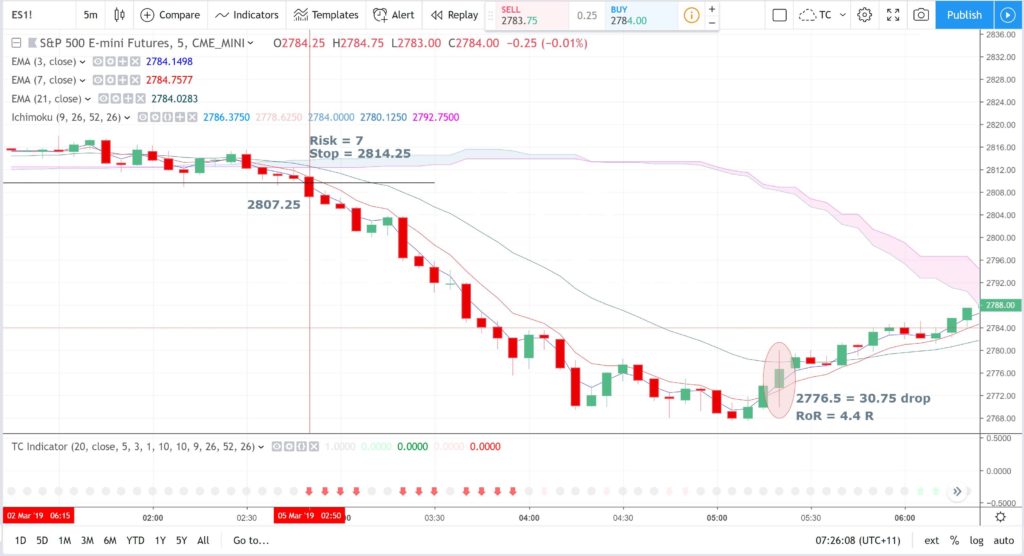
ES 5 min 04/03/19: Dropping down to the 5 min chart offered up a TC signal that needed a smaller initial Stop of 7 points. This gave a great momentum move lower as evidenced by the width between the 3 and 7 EMAs during the trade. Thus, using a trade exit of a 3/7 EMA cross here would have preserved more of the gain and doing so here gave a trade result of 30.75 points for 4.4 Return on Risk.
Summary: The TC Trigger is a useful guide for determine trade entry signals but determining trade exit is a most critical part of a traders trading plan. Trade exit signals can include any of the follow and might be dictated by the particular price action of the move:
- a candle close back in the Cloud.
- a candle close back below the Cloud
- a 3 / 7 EMA crossover.


