I am not a crypto trader but listened to a very interesting podcast over the weekend that focused on Dogecoin. The link to this 37 minute NY Times podcast is here and is well worth a listen. This podcast piqued my interest and got me checking the chart of DOGE/USD and my findings are below.
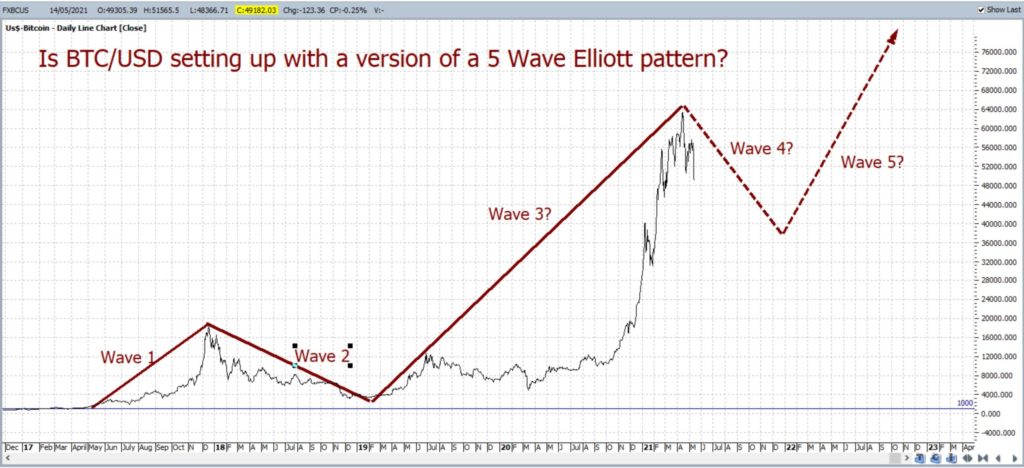
I have long wondered whether conventional Technical Analysis tools can be applied to the crypto space and have mapped BTC/USD over recent years, since February 2018, to see whether it might conform to a 5 wave Elliott pattern. Links to previous articles can be found here, here and here. The crypto space operates under a different paradigm to the conventional trading and investing with stocks and, hence, my questioning of the relevance of traditional Technical Analysis tools to this new space, However, after tracking BTC/USD for three years, it does seem that the 5 wave Elliott pattern might loosely be applied to the crypto, as the chart below reveals. It is not a text-book style fit but seems to capturing the start of the 5 wave thrust.
BTC/USD daily: note the loose fit of a 5 wave Elliott pattern to BTC/USD thus far:
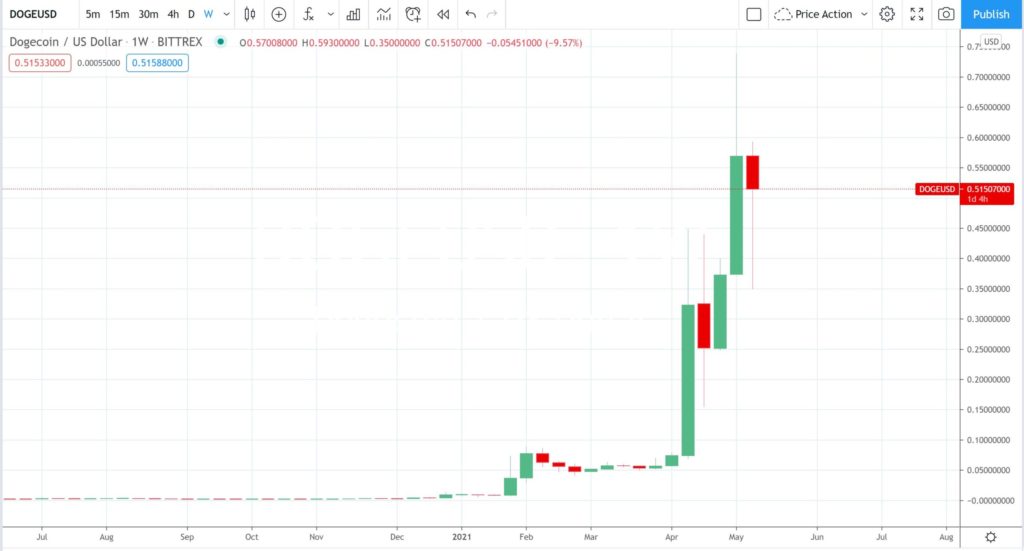
So,what about the meme crytpo DOGE/USD? This is a much newer crypto and so it may take some time for a decent technical picture to evolve but I am making a start.
DOGE/USD weekly: the weekly chart shows that this crypto traveled sideways until January this year, at which time price started to rise. The current weekly candle is shaping up as a bearish-reversal Hanging Man weekly candle so it might be worth watch for any pause following this recent and sharp rally:
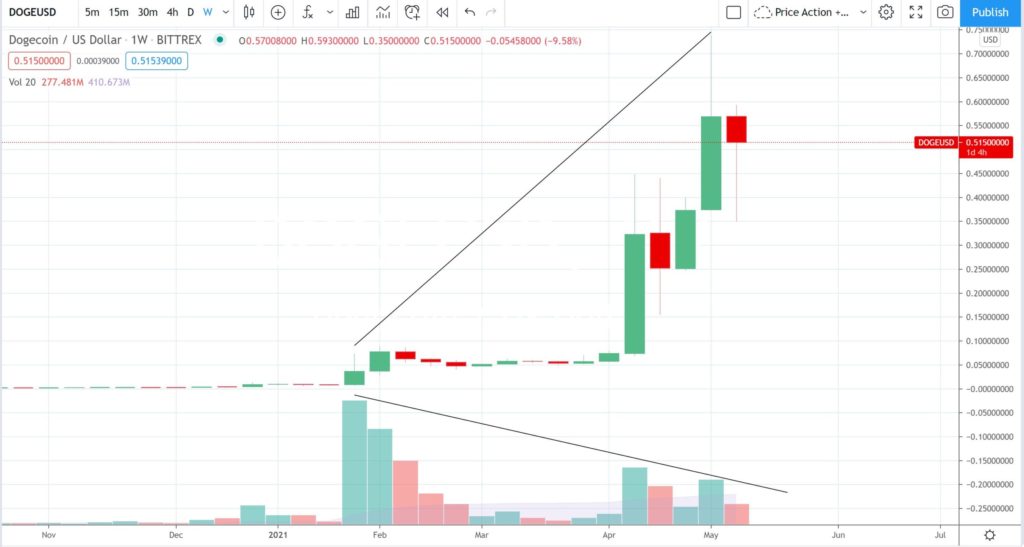
DOGE/USD weekly + Volume: note how trading Volume has declined along with this increase in price. This divergence between price and volume is worth noting and traders would be wise to watch for any shift in price action that comes with a volume trend line breakout:
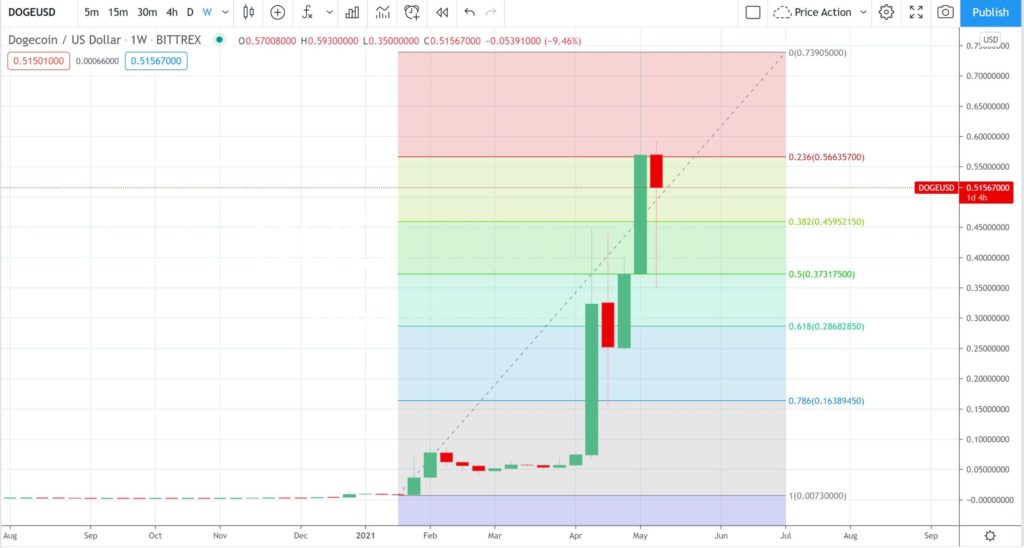
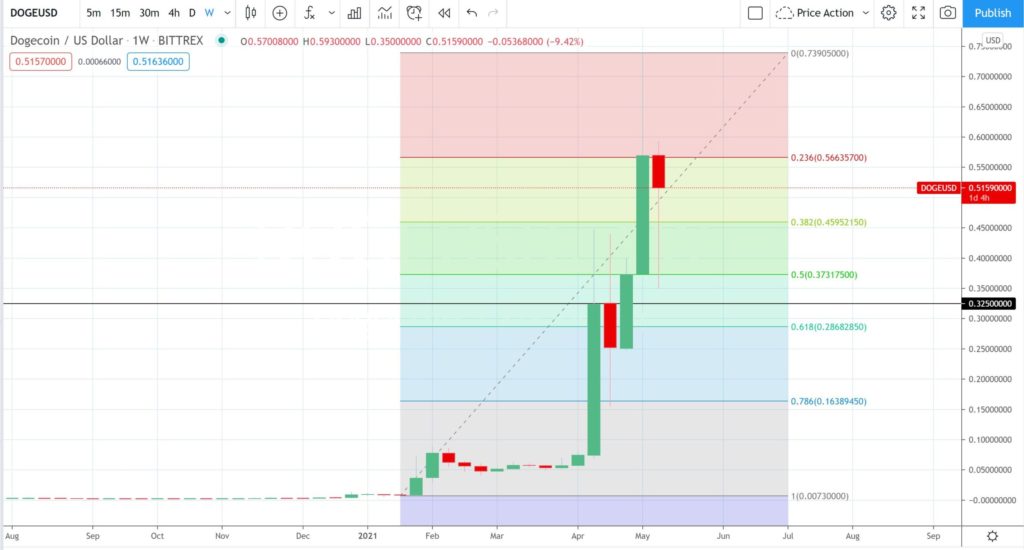
DOGE/USD weekly + Fibonacci: Applying a Fibonacci retracement tool to price action renders the chart below. Fibonacci retracement is helpful for identifying pullback targets and is a fairly widely used charting tool:
DOGE/USD weekly + Fibonacci: One popular Fibonacci retracement level is the 61.8% level and I have numerous examples where this popularity can be identified. I note that the 61.8% Fibonacci of the Jan-May 2021 swing High move on DOGE/USD is down near 0.325 and this is a recent reaction zone. This will be the level I will monitor for any new reaction if price action does continue to weaken.
Concluding comments: I do not trade cryptocurrencies and my interest is more in the technical analysis of their charts. BTC/USD seems to be conforming to an Elliott wave pattern so I will be watching to see if DOGE/USD might conform to the technical signal of a bearish-reversal Hanging Man weekly candle. If so, I will then look to see if the 61.8% Fibonacci level, circa 0.325, offers any potential support.


