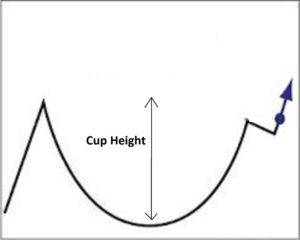
The Cup and Cup’n’Handle pattern are bullish continuation patterns and a Cup breakout pattern is explained below with the use of two examples one of the GBP/USD and the other on an Aussie ASX stock, PET.
The theory behind these patterns is that the height of the Cup pattern is used to project the distance of movement for any bullish breakout.
There are two examples of such breakout patterns shown below.
GBP/USD
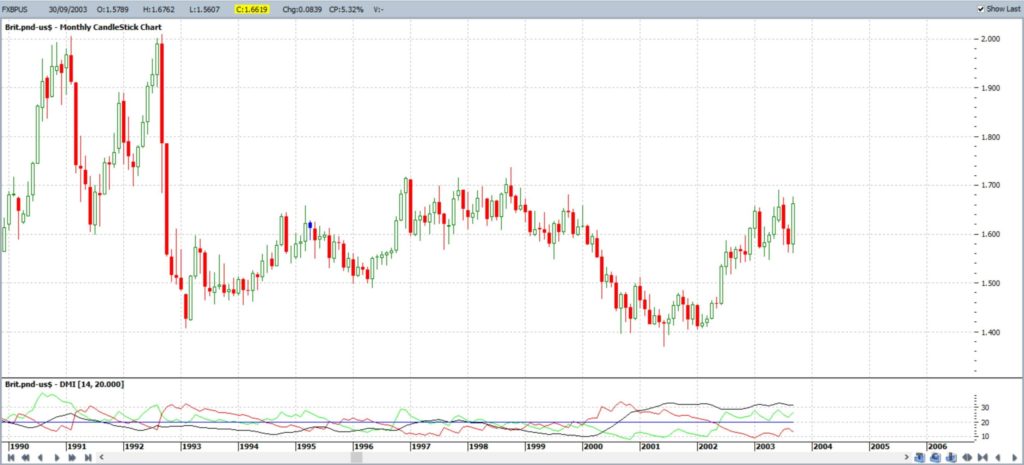
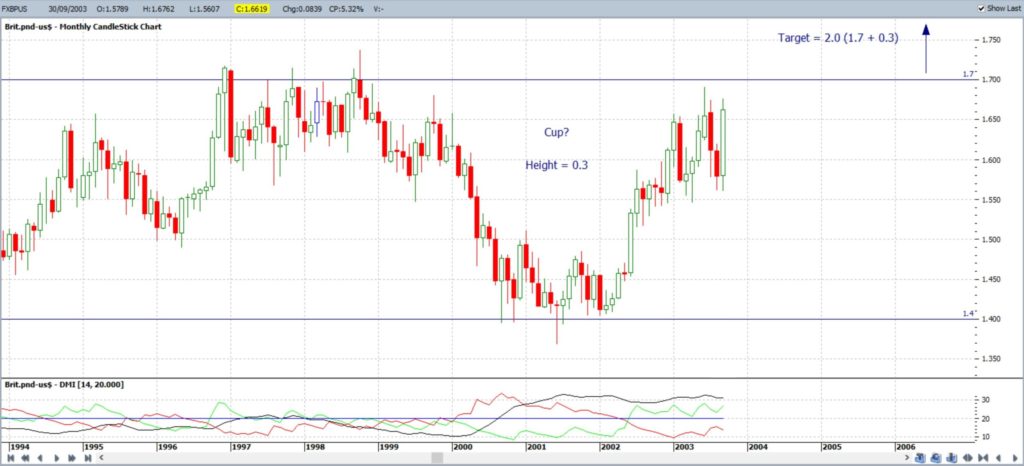
GBP/USD monthly: price action was consolidating under the 1.70 level for much of 2003 and had begun to look like a bit of a Cup pattern:
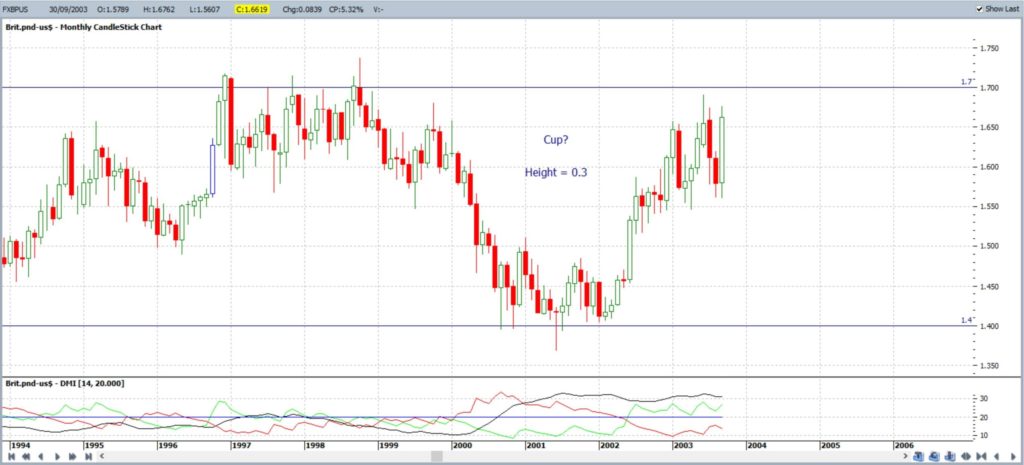
GBP/USD monthly: The Height of this Cup pattern extended from 1.70 down to 1.40 = 0.30:
GBP/USD monthly: Technical Theory with Cup patterns suggests that the breakout might extend by the same amount as the Height of the Cup. That is, price action might rally up towards the 2.0 region (1.70 + 0.30):
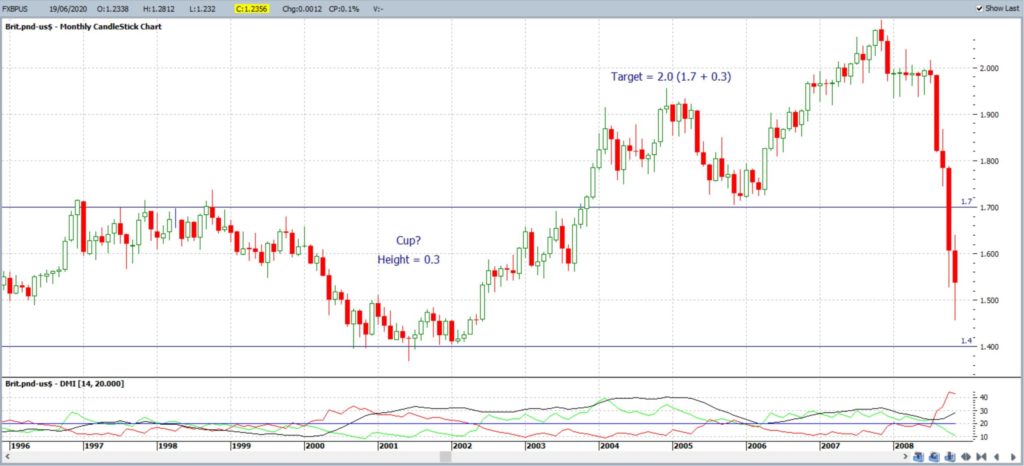
GBP/USD monthly: There did end up being a bullish breakout and the first move made it to just under the 2.0 region. That is why it always a good idea to be a bit conservative with any ‘Take Profit’ targets if trading technical pattern breakouts. Price action did eventually reach the 2.0 level BUT not before a decent pullback to near the 1.70 breakout region:
PET
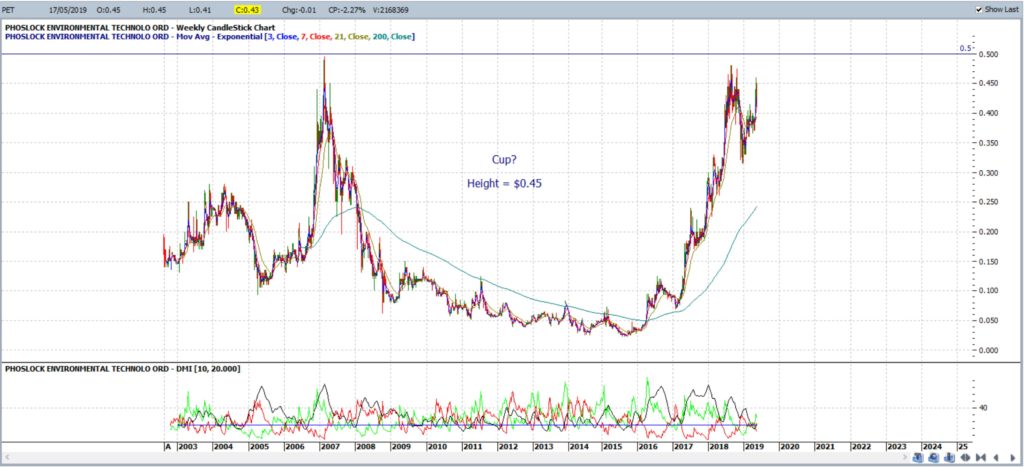
PET weekly: May 2019: Price action had been setting up in a Cup style pattern under the horizontal resistance level of $0.50. There was a bit of congestion under the $0.50 that could be likened to a Handle forming. The Height of the Cup was about $0.45 cents and so the target for any breakout above the $0.50 might be placed at $0.95 cents. That is derived from $0.50 + $0.45:
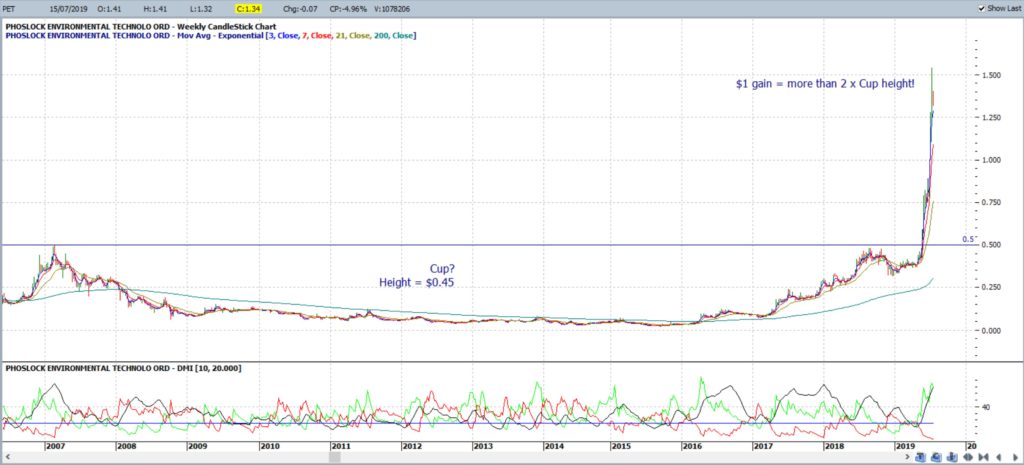
PET weekly: July 2019: the bullish breakout did trigger but it actually went on much further than the initial target of a $0.45 cent gain; it actually gave almost double that!


