Last week: There was a risk-on shift last week in the lead up to the 4th July US holiday weekend. US Stocks and Oil closed higher, as did the AUD/USD and NZD/USD, with Bonds and the VIX closing lower signalling a decline in fear. Gold was also marginally lower for the week, as the $1,800 resistance looms just above but, once again, the US$ did not receive much Flight to Safety flow and closed lower for the week. President Trump has been cheering the recent NFP jobs report but, as this 4-minute update interview with Economist Douglas Holtz-Eakin reveals, the data was collected in mid-June prior to the renewed US closures AND, in Holtz-Eakin’s opinion, Covid-19 will continue to pose challenges for the US economy. The S&P500 recovery move continues on declining volume and declining momentum so, at the very least, an element of caution is required, especially as global Covid infections continue to rise.
Technical Analysis: As noted over recent months, it is important to keep in mind that this analysis is Technical and chart-based but that any major Fundamental news items, as recently seen with Coronavirus, have the potential to quickly undermine identified chart patterns. This is why it is critical that traders appropriately manage their trade exposure and risk per trade during these volatile market conditions.
Trend line breakouts and TC signals: Articles published during the week can be found here, here, here and here:
- USD/JPY: a TL b/o for 70 pips.
- GBP/USD: a TL b/o for 130 pips.
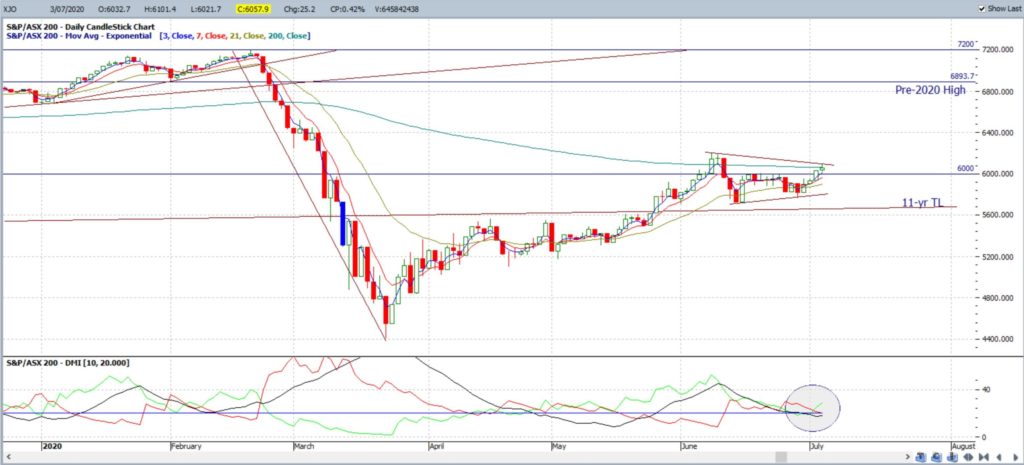
- ASX-200: a TL b/o for 160 points.
- S&P500: a TL b/o for 40 points.
- This Week: (click on images to enlarge):
-
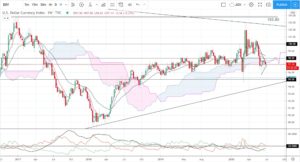
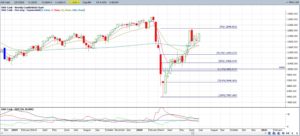
- DXY: US$ Index: The US$ index closed with another bearish-coloured Spinning Top style weekly candle, reflecting indecision, and remains range-bound on low momentum. However, watch for any developing Flight to Safety flow:
DXY weekly:
-
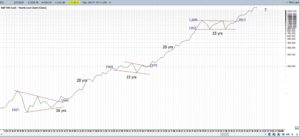
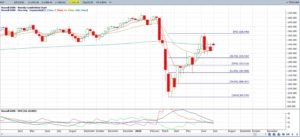
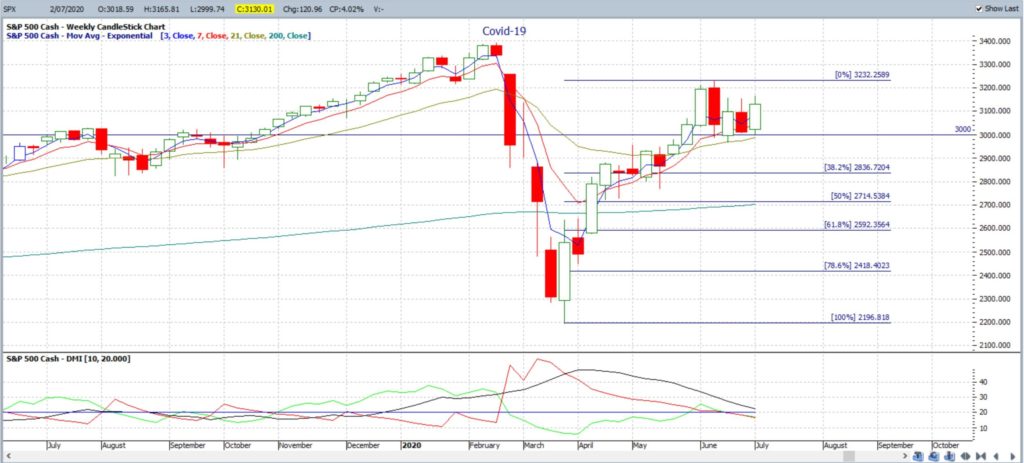
- S&P500: Keep the bigger picture in perspective with the recent moves:
S&P500 yearly: keep this latest move in perspective:
-
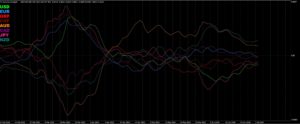
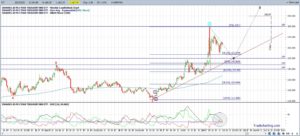
- Currency Strength Indicator: note how the currencies continue converging on the daily time frame. Is a big breakout move brewing?
Currency Strength Indicator (daily):
-
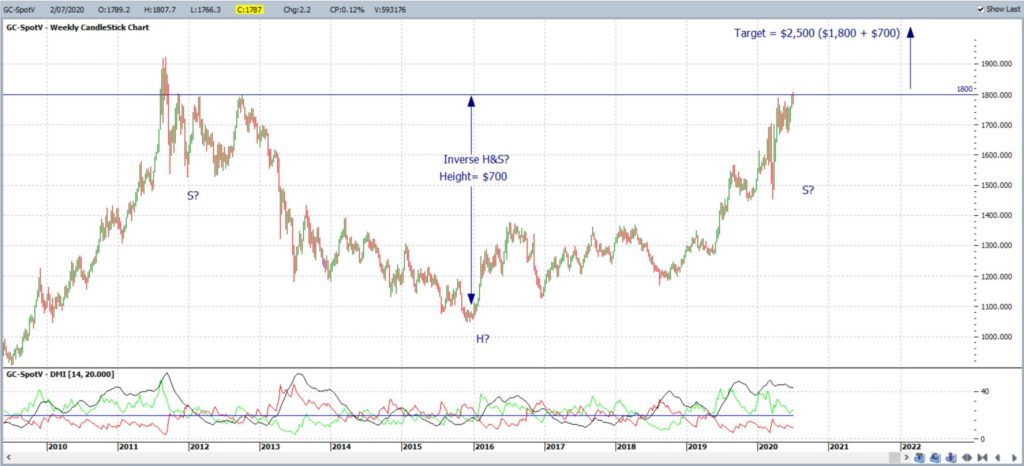
- Gold: I have been warning about the bigger picture chart pattern shaping up on the weekly chart of an Inverse H&S. The choppiness I had anticipated continues playing out BUT watch carefully as the precious metal now trades up near the $1,800 ‘neck line’ breakout level of this pattern.
-
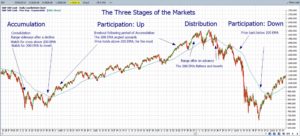
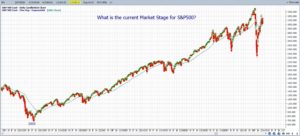
- Market Phases: It is important to recall the three main types of market phases: Accumulation, Participation (Up and Down) and Distribution. Traders should monitor the chart of the S&P500 chart for any Distribution type activity that might eventually lead to Participation Down; even if the S&P500 heads back to testing its all time High: The chart below shows how the S&P500 evolved in the years leading up to, and during, the Global Financial Crisis (GFC). Note how the Distribution phase evolved over a period of many months and there was a double test of the all-time High region. Keep this in mind with the current market action on the S&P500.
S&P500 market phases: Global Financial Crisis 2007-2009:
S&P500: keep watch for any Distribution type of activity:
-
- ASX stocks and cyber-security opportunities: I prepared this article for our recent ATAA online catch up and it is available through this link.
-
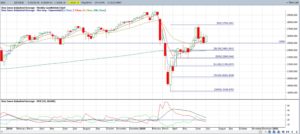
- DJIA weekly: The DJIA closed with a bullish weekly candle as the index holds above the key 25,000 S/R region:
DJIA weekly:
-
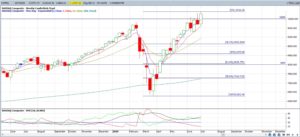
- NASDAQ composite: The NASDAQ Composite Index closed with a bullish, essentially ‘Engulfing’, weekly candle above the 10,000 level for the first time ever!
NASDAQ weekly:
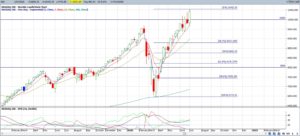
- NDX weekly: The NDX Index is made up of the top 100 or so NASDAQ non-financial stocks and it also closed with a bullish, essentially ‘Engulfing’, weekly candle and above the 10,000 level:
NDX weekly:
-
- DAX weekly: The DAX closed with a bullish weekly candle so watch for any push to the recent High:
DAX weekly:
-
- Russell-2000: The Russell-2000 is often viewed as the ‘Canary in the Coal Mine’ for US stocks and is bucking the weekly trend on US stocks The index closed with a small bearish-coloured Spinning Top weekly candle reflecting indecision:
RUT weekly:
-
- Bonds / TLT: The Bond ETF, TLT, closed with a bearish-coloured Spinning Top weekly candle reflecting indecision with this latest risk-on shift. Note the pullback that is still being suggested by the Elliott Wave indicator:
TLT weekly:
-
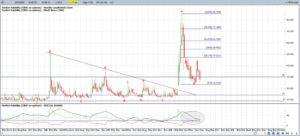
- VIX: the Fear index closed with a large bearish weekly candle and back below the 30 level so watch this region for any new momentum based make or break:
VIX weekly: watch the key 30 level for any new momentum based make or break:
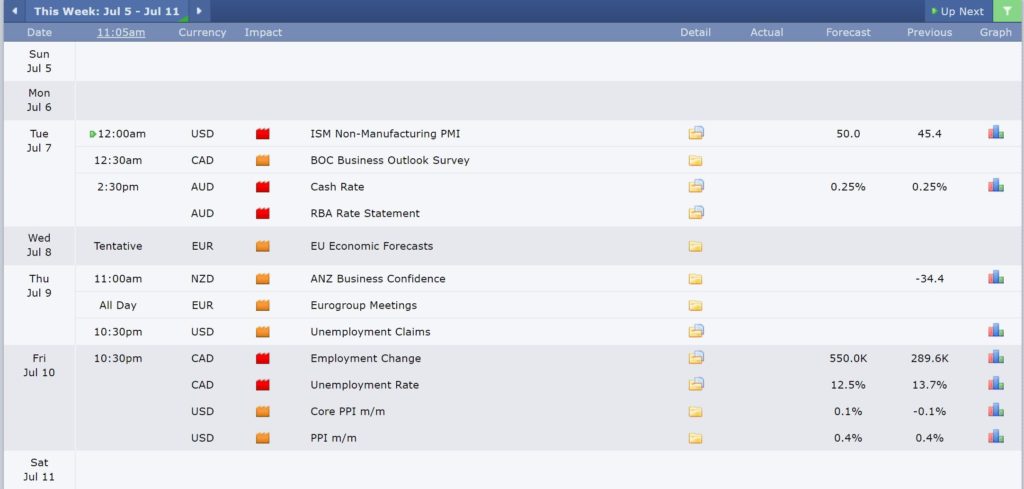
Calendar: Courtesy of Forex Factory:
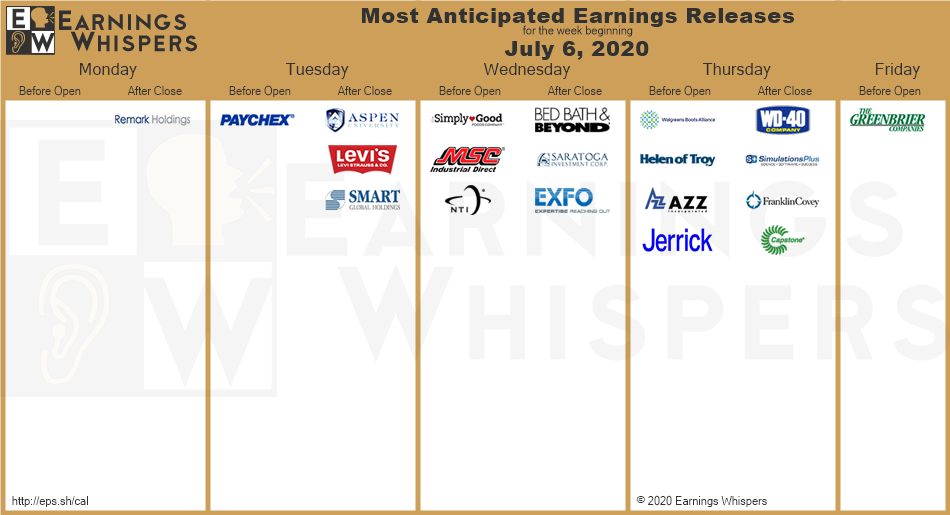
Earnings: Courtesy of Earnings Whispers:
Market Analysis:
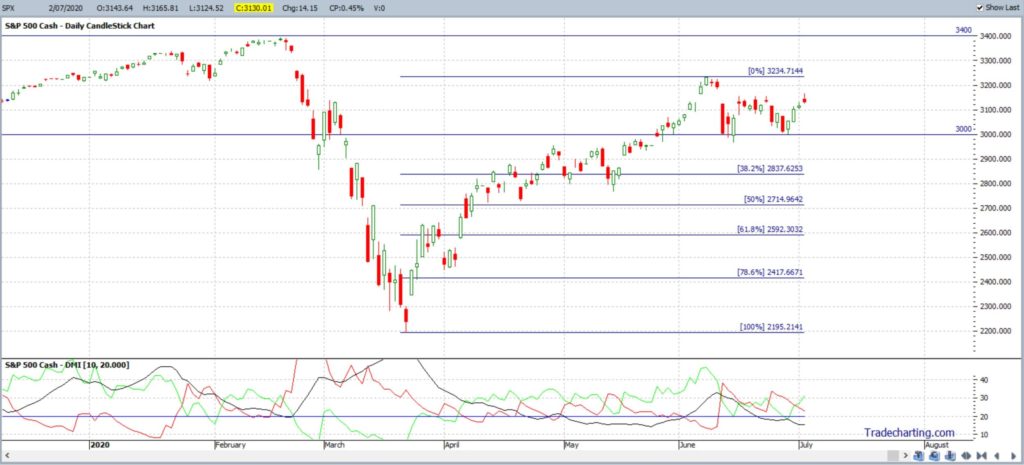
S&P500: The S&P500 closed with a bullish, almost ‘Engulfing’, weekly candle and still above 3,000 S/R, a level which proved to be effective support last week. The monthly close above this psychological barrier was impressive too, considering the Covid situation gripping the USA.
Note how average weekly Volume was lower yet again last week, as revealed on the S&P500 ETF chart: SPY. There is clear divergence here with price action higher, with this latest bounce, but Volume lower. Traders should keep watch for any new Volume breakout here:
S&P500 ETF: SPY weekly: watch the Volume trend line for any new breakout:
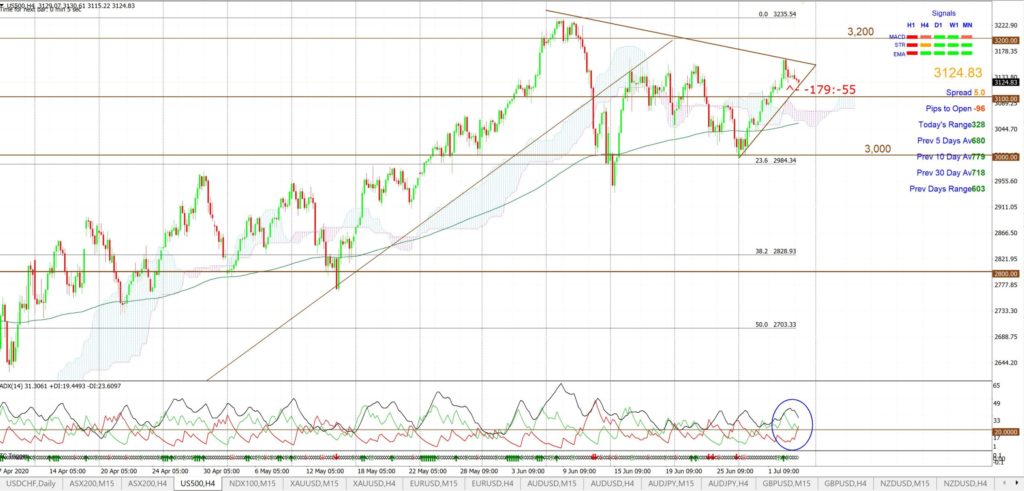
The index closed just above 3,100 making this the whole-number level to watch for any new make or break. There are also revised 4hr chart trend lines to monitor for any new breakout.
Bullish targets: any bullish 4hr chart triangle breakout would bring whole-numbers on the way back to the previous High, near 3,400, into focus.
Bearish targets: any bearish 4hr chart triangle breakdown below 3,100 would bring 3,000 into focus followed whole-number levels on the way down to the recently broken 11-yr support TL.
- Watch 3,100 and the 4hr chart triangle trend lines for any new breakout:
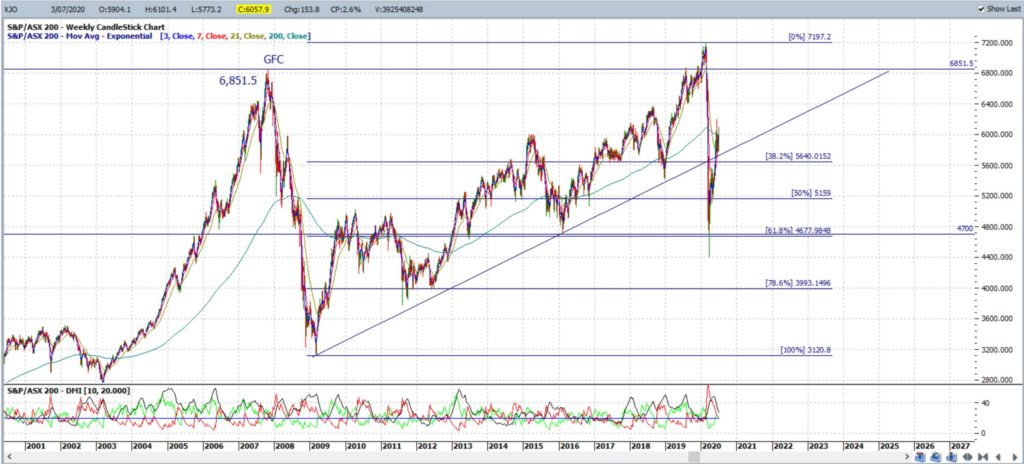
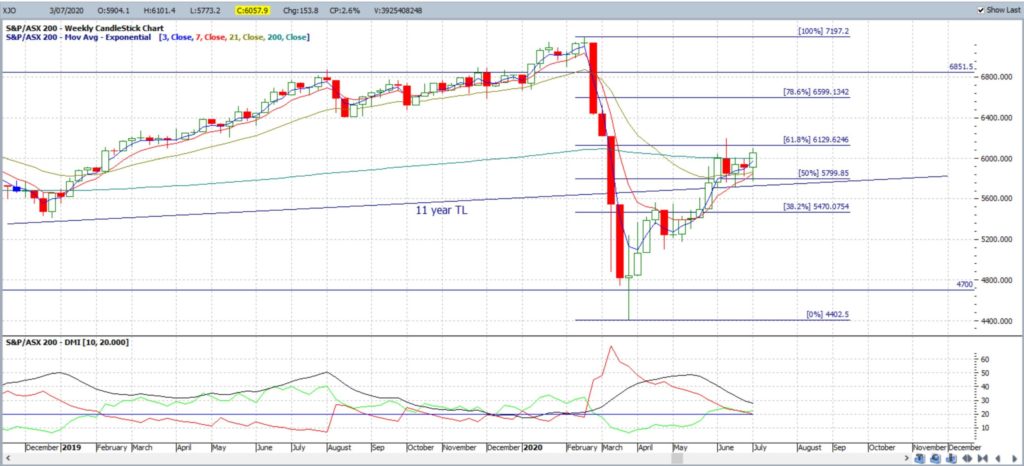
ASX-200: XJO: The ASX-200 closed with a bullish weekly candle and above the psychological 6,000 level. However, trading Volume was lower again last week, as the chart below reveals, so watch for any new Volume trend line breakout.
XJO weekly: trading Volume even lower again this week:
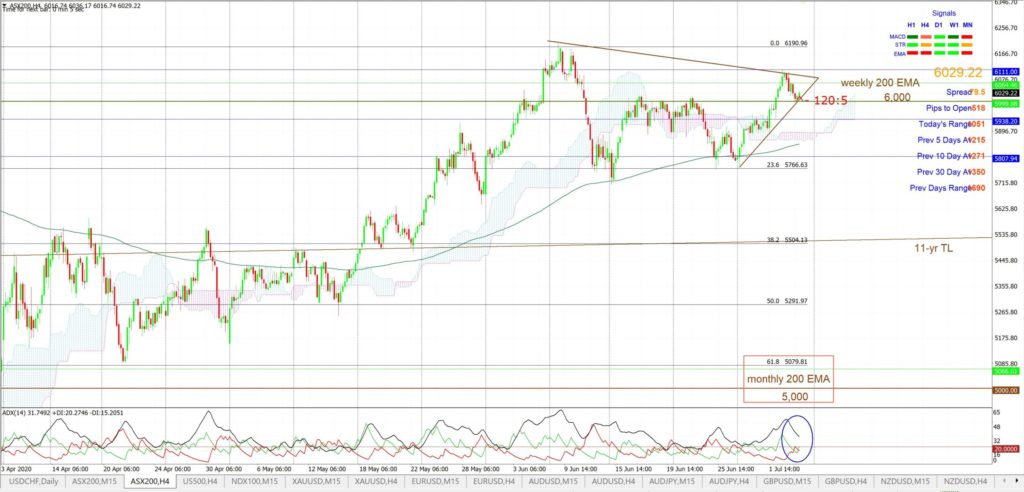
The 6,000 level remains the S/R level to watch for any new make or break although there are revised 4hr chart trend lines to monitor as well.
Bullish targets: Any bullish 4hr chart triangle breakout would bring the recent High, near 6,190, into focus followed by whole number levels on the way back to the previous all time High, circa 7,200.
Bearish targets: Any bearish 4hr chart triangle breakout below 6,000 would bring the 11-yr trend line support into focus followed by the 5,000 level as this is still near the 4hr chat’s 61.8% fib level.
- Watch for any new 4hr chart triangle breakout:
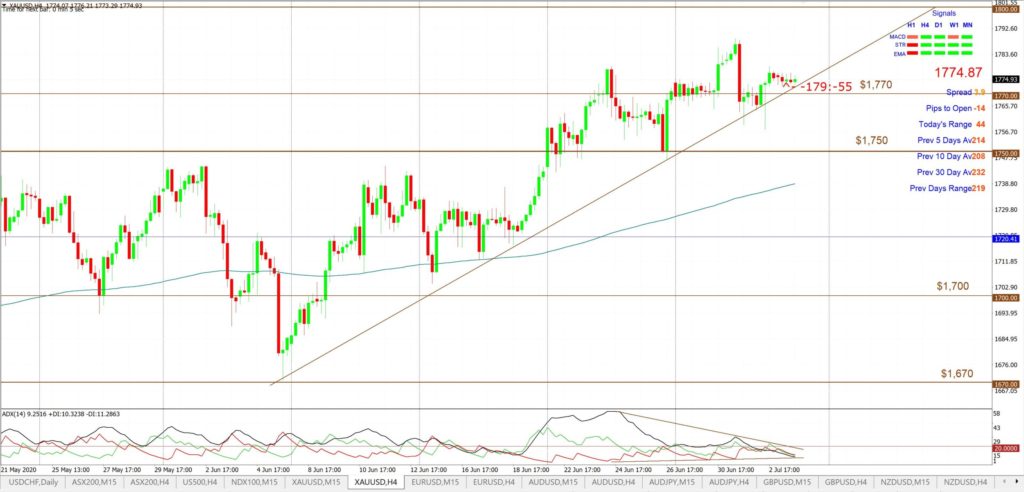
Gold: Gold closed with a bearish-coloured Spinning Top style weekly candle under the key $1,800 level and was not able to break this resistance to close out the month of June. The precious metal closed near $1,770 S/R again making this the level to keep watching for any new make or break in coming sessions.
Weekly chart: As mentioned over recent weeks, the weekly chart has the look of a broad Inverse H&S pattern or some may see this as a broad Cupping style pattern. Both are rather similar though as they are bullish patterns and suggest follow-through to the order of magnitude of the depth of the Cup / height of Head. In this case, that move is of around $700 so it is a longer-term pattern worth monitoring. The upper breakout region for this pattern is $1,800 which is still a way off yet.
Bullish targets: any bullish move up from $1,770 and the 4hr chart support trend line would bring $1,800 S/R into focus.
Bearish targets: any bearish break below $1,770 and the support trend line would bring $1,750 into focus followed by $1,700 and, then, $1670.
- Watch $1,770 for any new make or break:
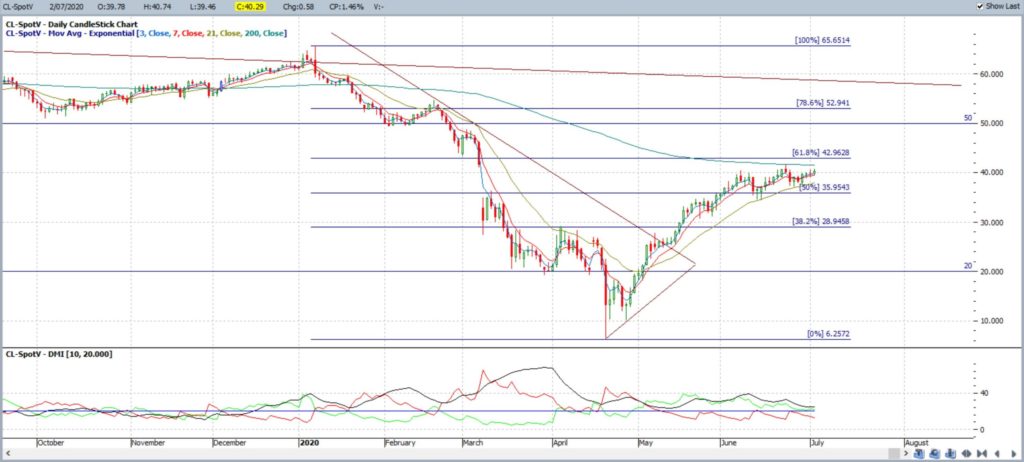
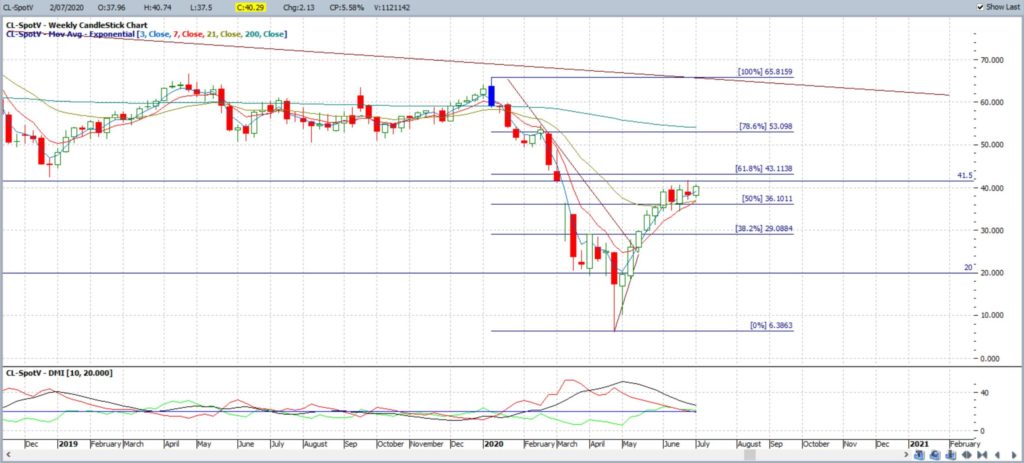
Oil: Oil closed with a small bullish weekly candle AND just above the $40 level, after having struggled at this resistance for the last four weeks, but keep watching this level for any new make or break.
Bullish targets: any continued bullish daily chart triangle breakout above $40 would bring the $41 / $43 region into focus as this represents a Gap Fill region and is near the 61.8% fib of the recent swing Low move.
Bearish targets: any bearish retreat from $40 would bring $35 followed by $30 and $20 and, then, the recent Low, near $6.50, into focus.
- Watch the $40 level and for any continued daily chart triangle breakout:
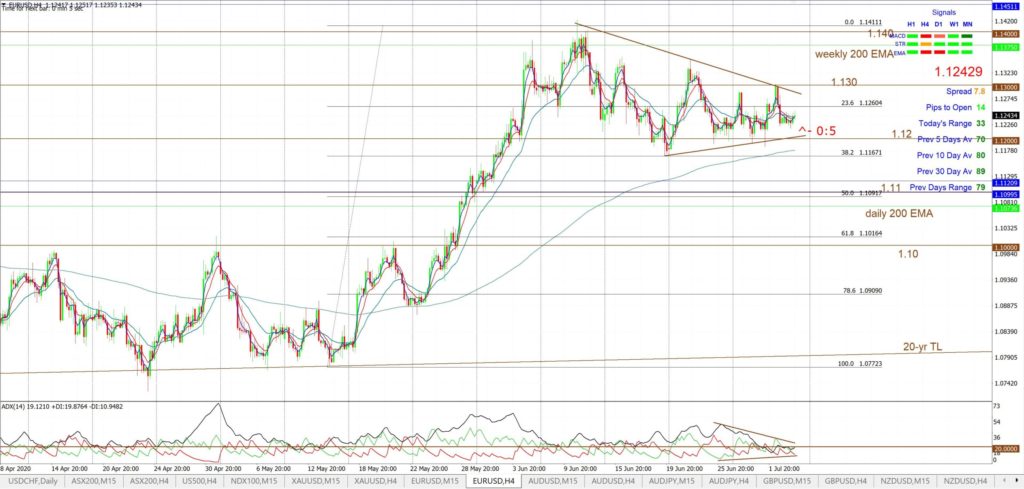
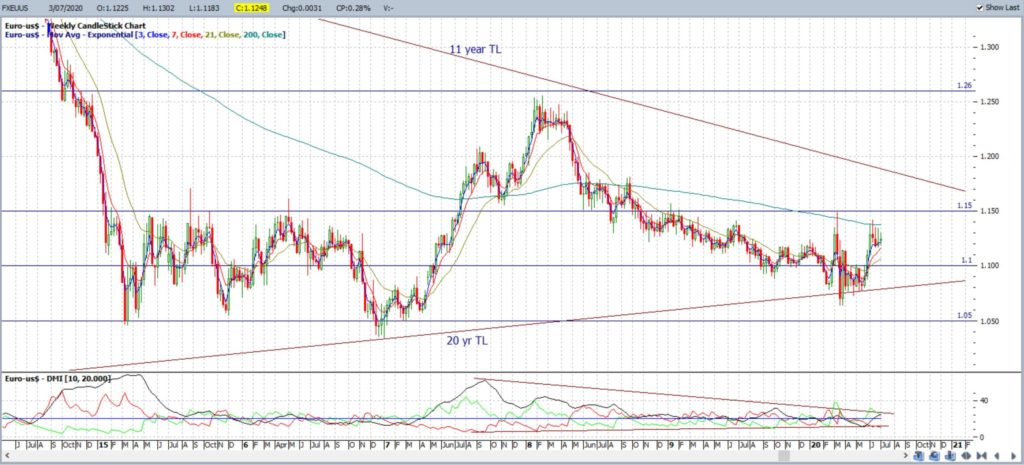
EUR/USD: The EUR/USD closed with another Spinning Top weekly candle making this the fourth consecutive such weekly candle.
Price action remains in a 4hr chart Flag bound by 1.13 above and 1.12 below making these the levels to watch for any new make or break.
Bullish targets: Any bullish 4hr chart Flag breakout would bring the weekly 200 EMA and 1.14 into focus followed by whole-number levels on the way up to a recent High, near 1.15.
Bearish targets: Any bearish 4hr chart triangle breakout would bring 1.11 into focus as this is near the 4hr chart’s 50% fib, followed by 1.10 , near the 4hr chart’s 61.8% fib and, then, the 20-yr support trend line.
- Watch the 4hr chart Flag trend lines for any new breakout:
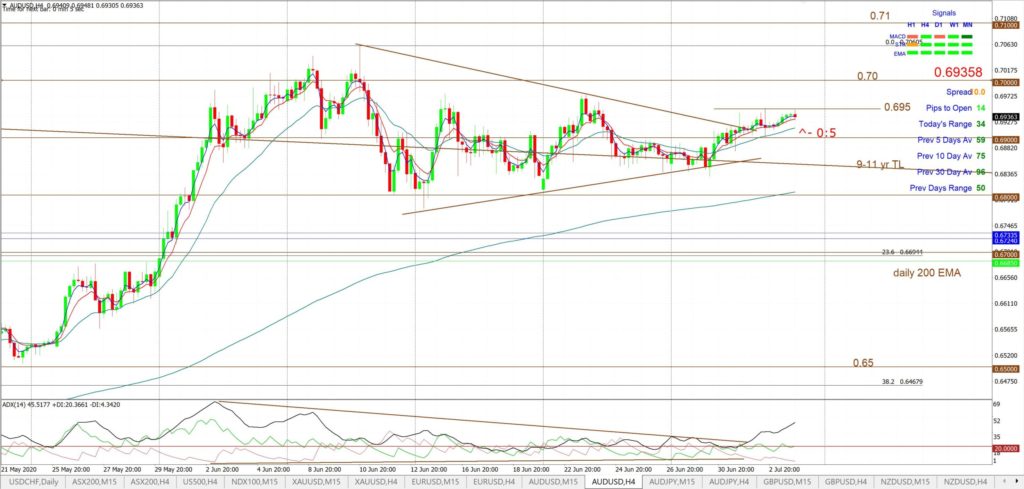
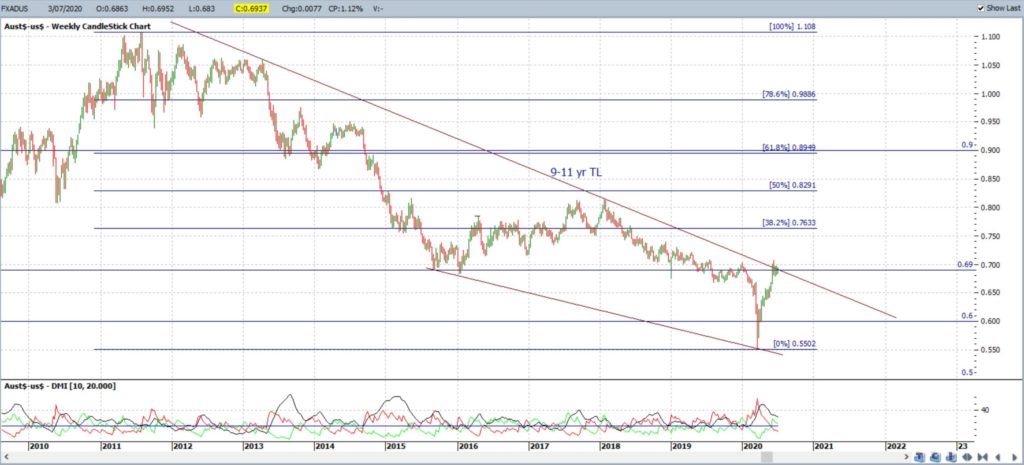
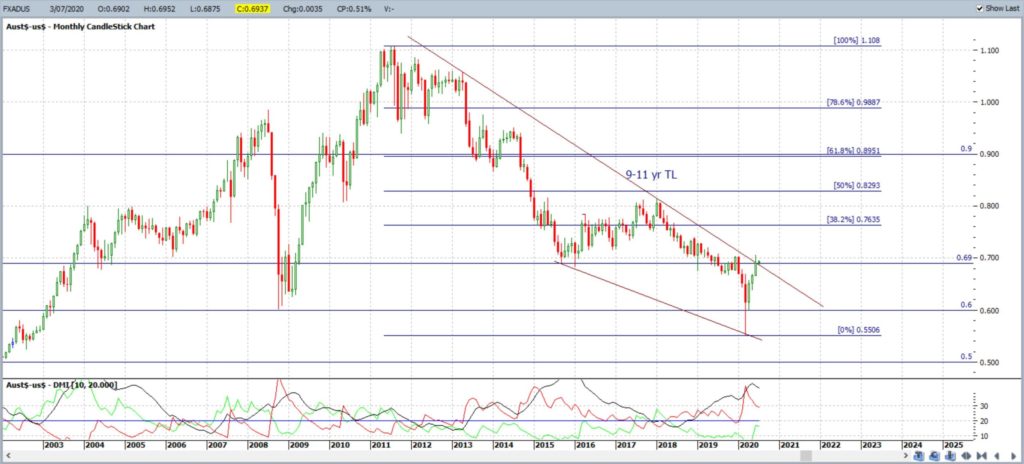
AUD/USD: The Aussie closed with a bullish weekly above 0.69 S/R and the 9-11 year bear trend line. Remember that this trend line is the upper trend line of the longer-term bullish-reversal Descending Wedge so traders should watch this region for any new new breakout. The monthly candle actually closed just under this wedge trend line so it will take another month before the next candle close could confirm a monthly wedge breakout. As I mentioned last week, a monthly candle close below the multi-year trend line would support the full range of trading possibilities: pullback, further consolidation and continuation so keep an open mind here.
As mentioned over recent weeks: A pullback, even if only temporary, could still well evolve here so watch the multi-year trend line here for clues. Remember, trends do not travel in straight lines unabated and so a pullback at this major wedge trend line resistance zone would not be at all unexpected.
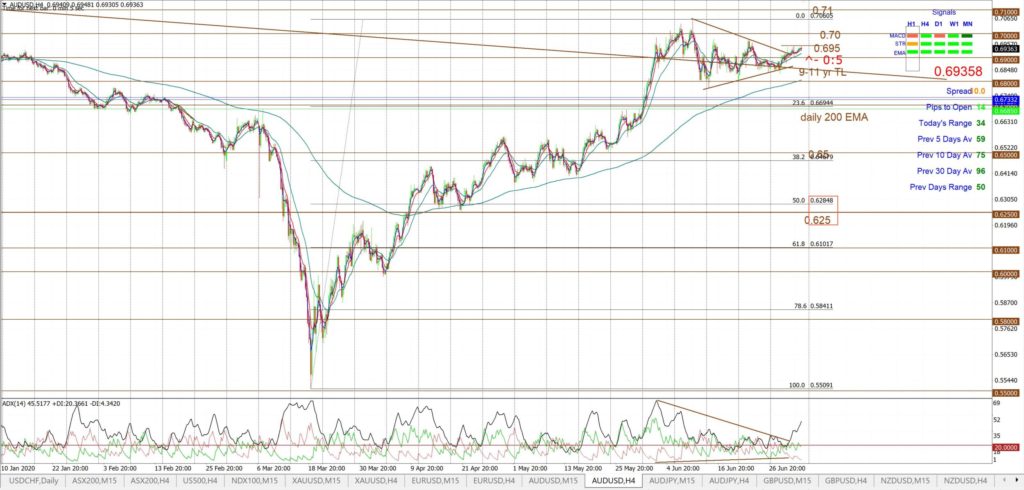
There looks to have been a new 4hr chart momentum trend line breakout so watch the 0.695 level for any new make or break.
Bullish targets: Any bullish 4hr chart breakout above 0.695 would bring 0.70 into focus followed by whole-number levels on the way up 0.90.
Bearish targets: Any bearish 4hr chart respect of 0.695 would bring 0.69 into focus followed by the 9-11 year bear trend line and, then, 0.67 S/R.
- Watch 0.695 for any new trend line breakout;
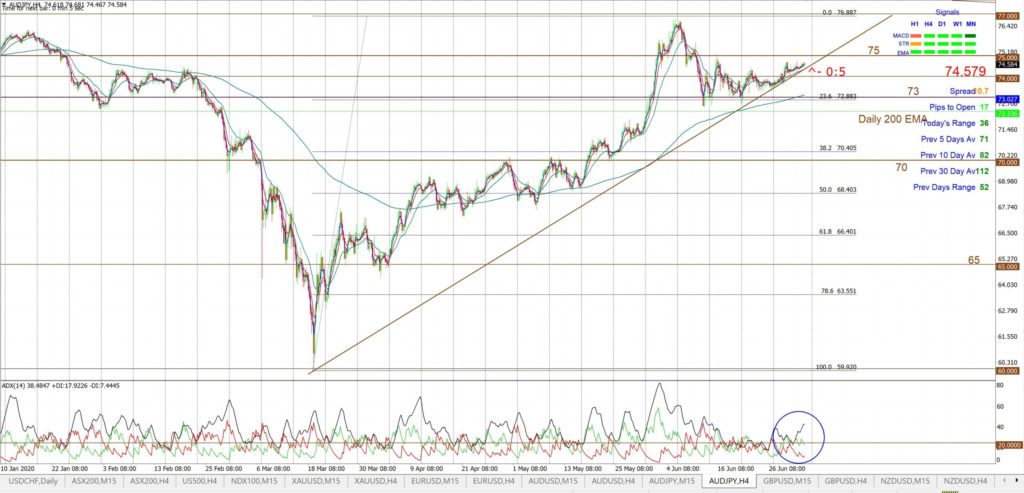
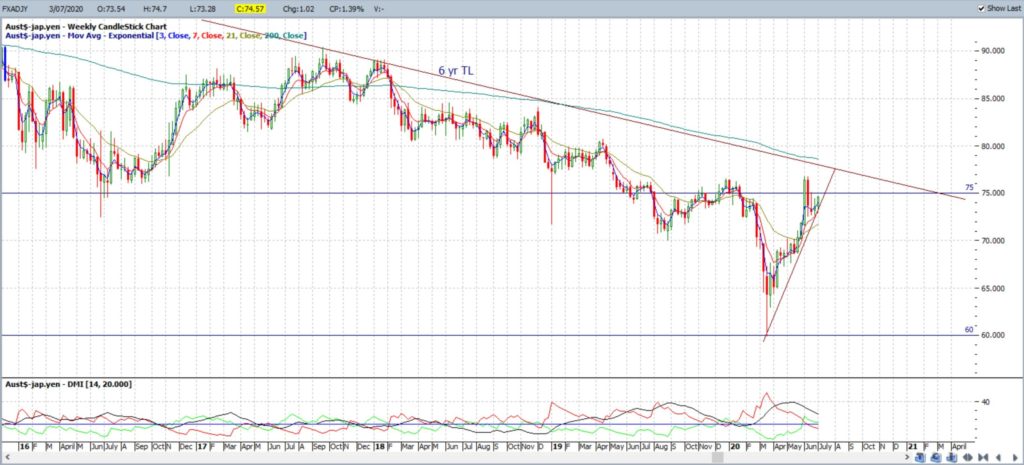
AUD/JPY: The AUD/JPY closed with a bullish weekly candle and just under the 75 S/R level making this the region to keep watch for any new make or break.
Note the hold above the support trend line and the uptick with bullish momentum on the 4hr chart.
Bullish targets: Any bullish 4hr breakout above 75 would bring 77 into focus followed by whole-number levels on the way up to 78 S/R.
Bearish targets: Any bearish 4hr chart break of the support trend line would bring 73 and 70 S/R back into focus followed by whole-number levels on the way down to 65 and 60 S/R as well as the longer-term support trend line.
- Watch 75 S/R and for any 4hr chart momentum-based support trend line breakout;
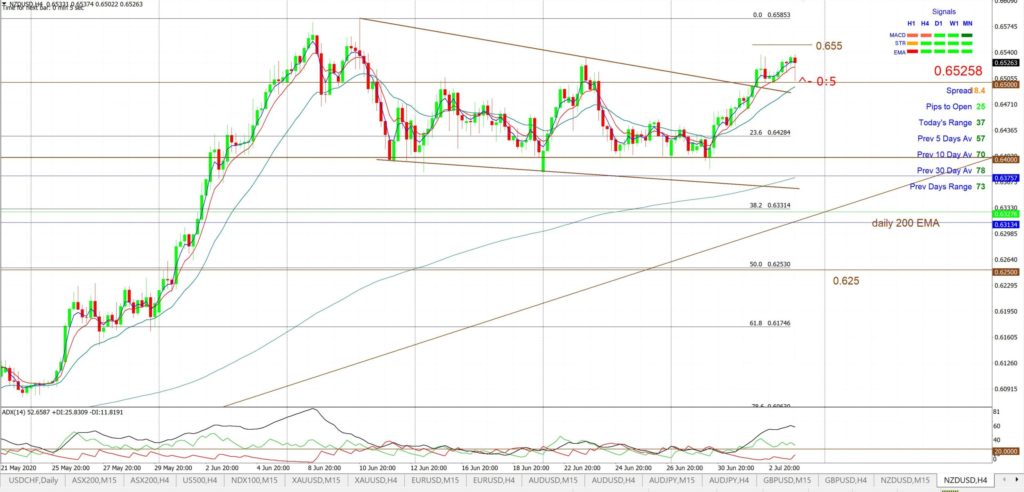
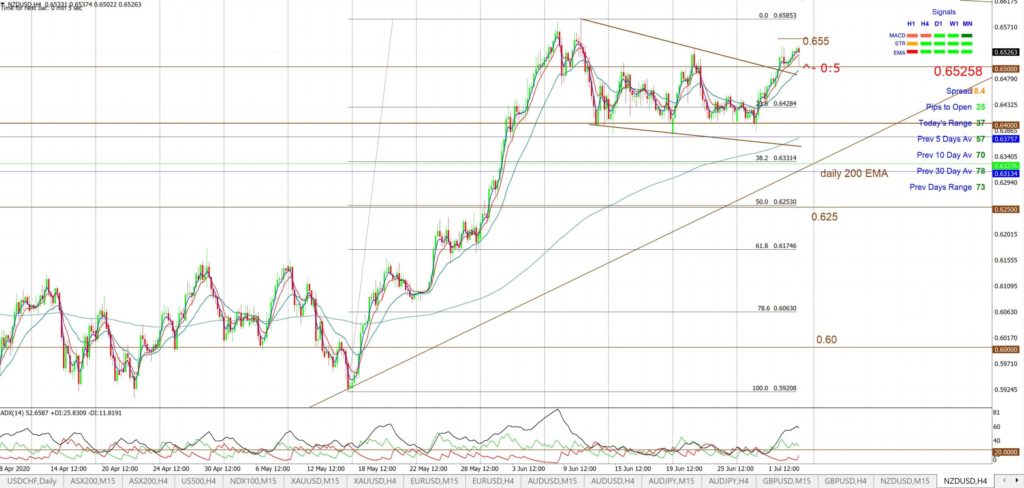
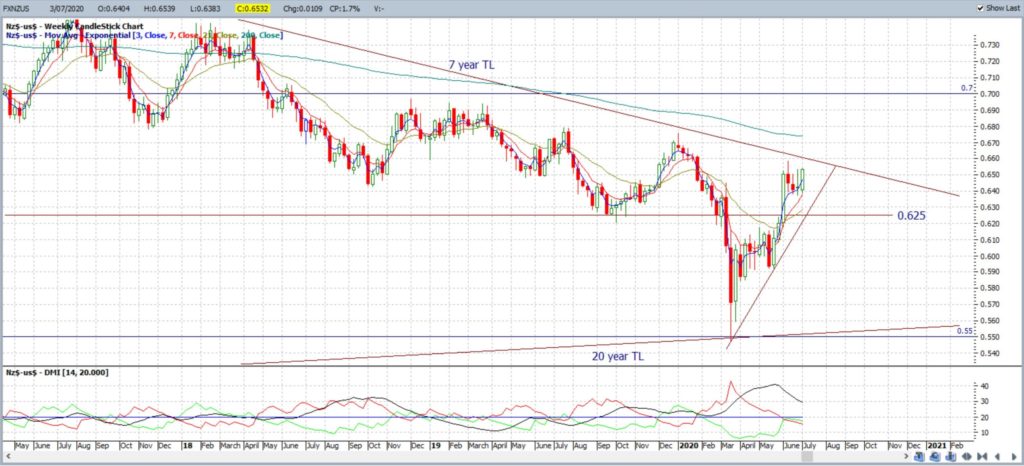
NZD/USD: The Kiwi closed with a bullish weekly candle and above 0.65 S/R.
There looks to have been a new 4hr channel breakout so watch 0.655 for any new momentum breakout; either up or down.
Bullish targets: Any bullish breakout above 0.655 would bring the recent High, near 0.66, followed by the 7-year bear TL into focus.
Bearish targets: Any bearish 4hr chart retreat from 0.655 would bring 0.65 followed by a support trend line and, then, 0.625 S/R into focus.
- Watch 0.655 for any new 4hr chart momentum-based breakout:
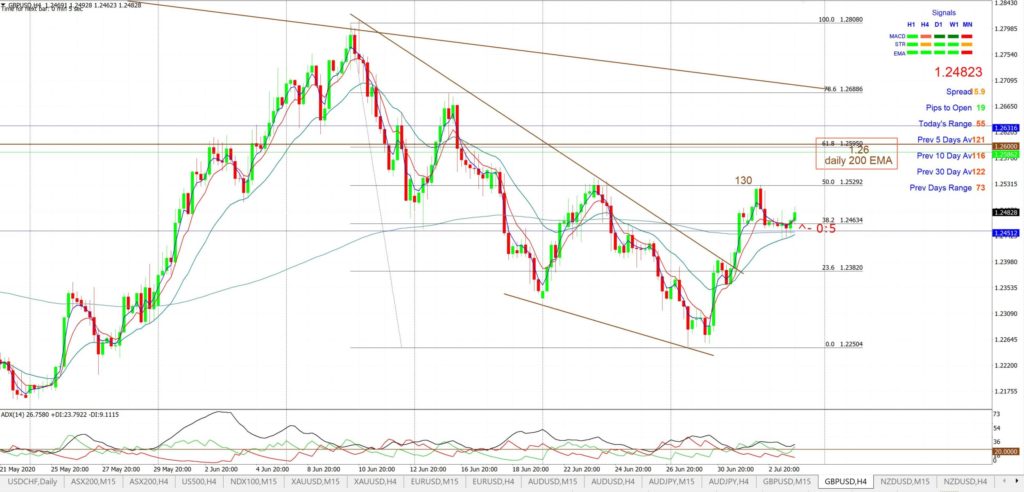
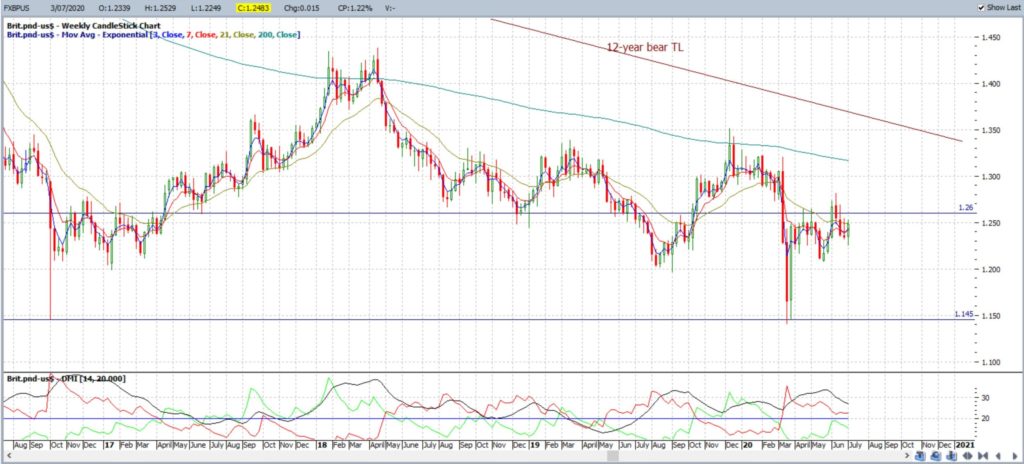
GBP/USD: The GBP/USD closed with a bullish weekly candle after making a bullish Descending Wedge breakout from last week’s 4hr chart pattern. This breakout still looks to be in progress so watch for any push to 1.26 S/R.
Bullish targets: Any continued bullish 4hr chart Wedge breakout would bring 1.26 into focus as this is near the daily 200 EMA and the 4hr chart’s 61.8% Fibonacci.
Bearish targets: Any bearish retreat below the 4hr chart’s 200 EMA would bring the recent Low, near 1.225, into focus.
- Watch for any continued 4hr chart Descending Wedge breakout:
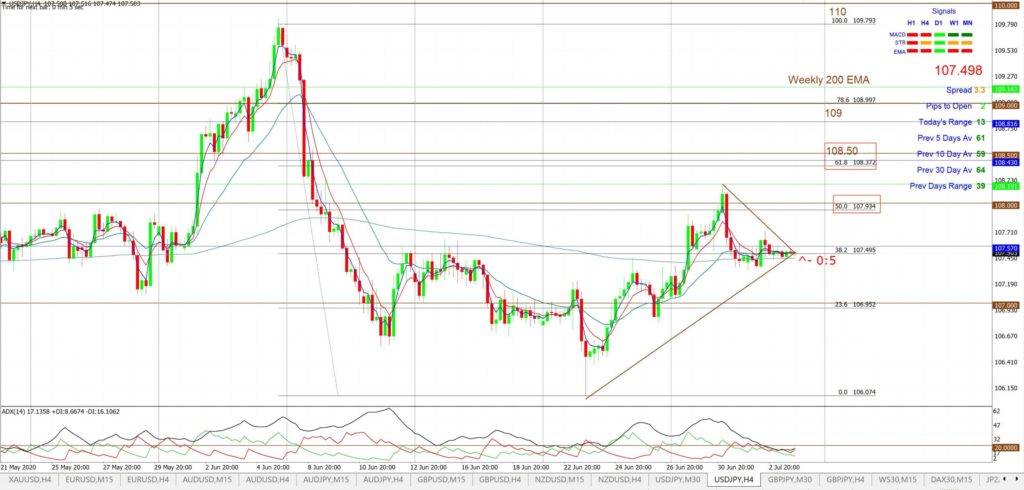
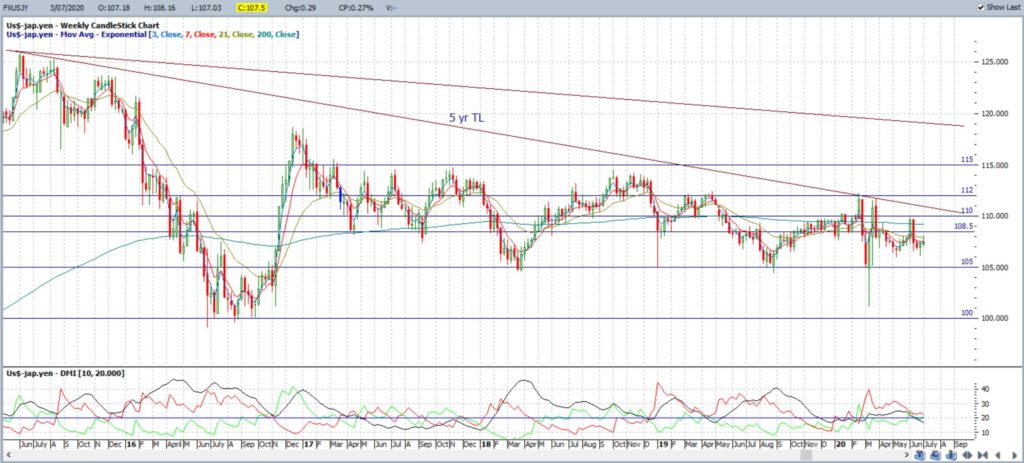
USD/JPY: The USD/JPY closed with another Spinning Top weekly candle, making this the third consecutive such weekly candle.
There are revised triangle trend lines on the 4hr chart giving traders trend lines to watch for any new momentum breakout.
Bullish targets: Any bullish 4hr chart triangle breakout would bring 108 and 108.5 into focus as the latter is still near the 4hr chart’s 61.8% Fibonacci level.
Bearish targets: Any bearish 4hr chart triangle breakout would bring the recent Low, near 106, into focus.
- Watch for any 4hr chart triangle breakout:


