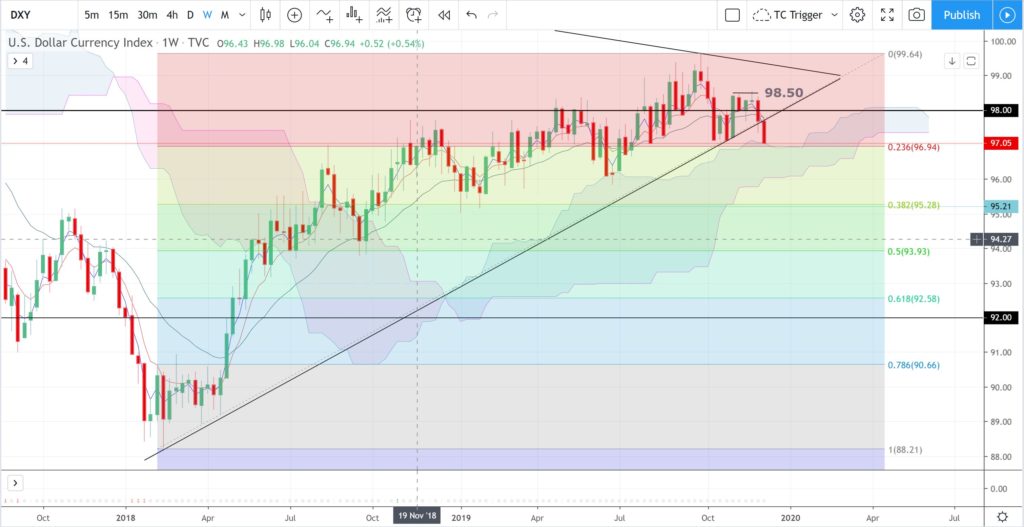
There are a number of commodities having charts with price action looking ripe for bullish breakout and some mean reversion. I’ve been pondering, for some time, about the type of event that could trigger a recovery in this space. The recent weakness in the US$ seems to be helping and, with the US$ index testing a 2-year support trend line, I’m wondering if continued US$ weakness might underpin a commodity come back? The charts in this post are just some commodity related ones that I think are worth watching but there would, no doubt, be plenty of others.
DXY weekly: watch to see where the weekly candle closes and, if this falls below trend line support, watch for any Bull Flag but further weakness would bring the 92 region into focus as this is the whole-number level near the weekly 61.8% Fibonacci level. then
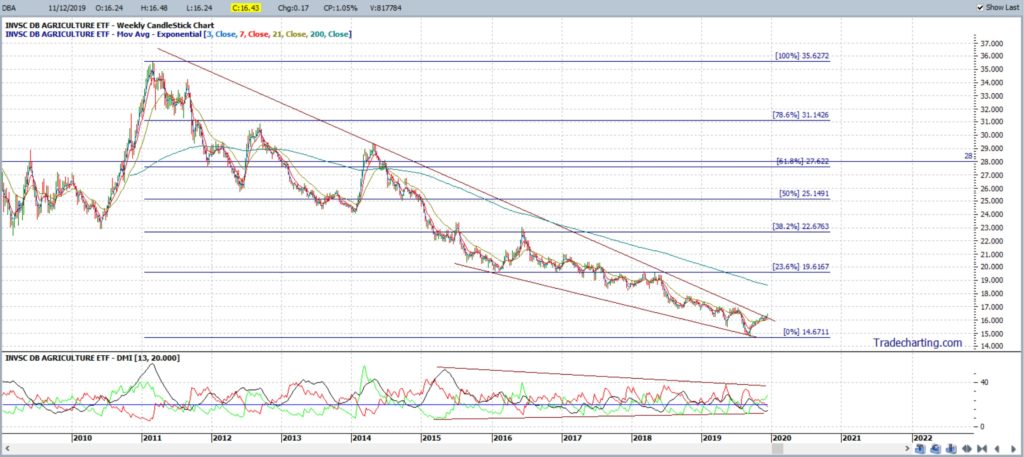
DBA weekly: Agriculture ETF: this has made a new breakout so watch for any push up to the region of the weekly 61.8% Fibonacci, circa $28:
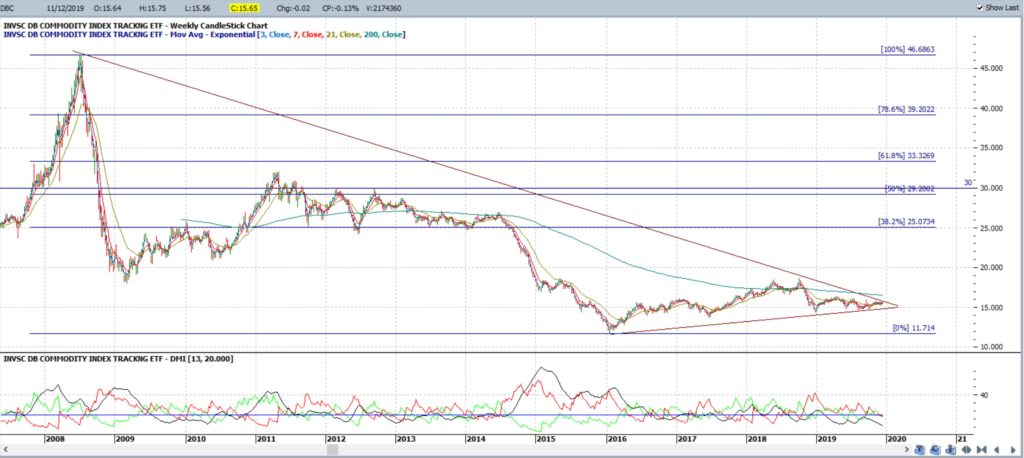
DBC weekly: Commodity ETF: watch for any new breakout and, if so, this would bring the region of the weekly 61.8% Fibonacci, circa $30, into focus:
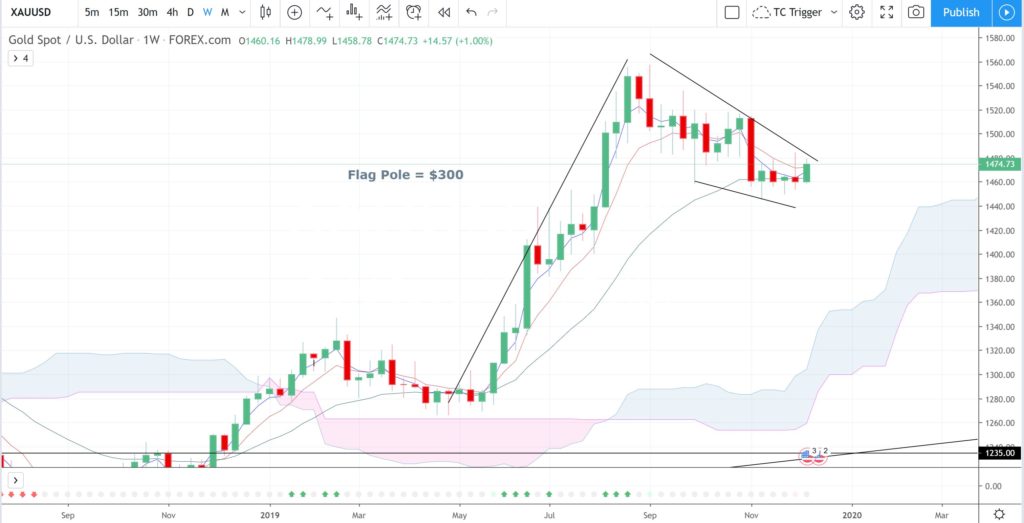
Gold weekly: watch for any Bull Flag breakout and, if so, this would bring the $1,800 region into focus as this is $300 above the $1,500 Flag upper trend line level:
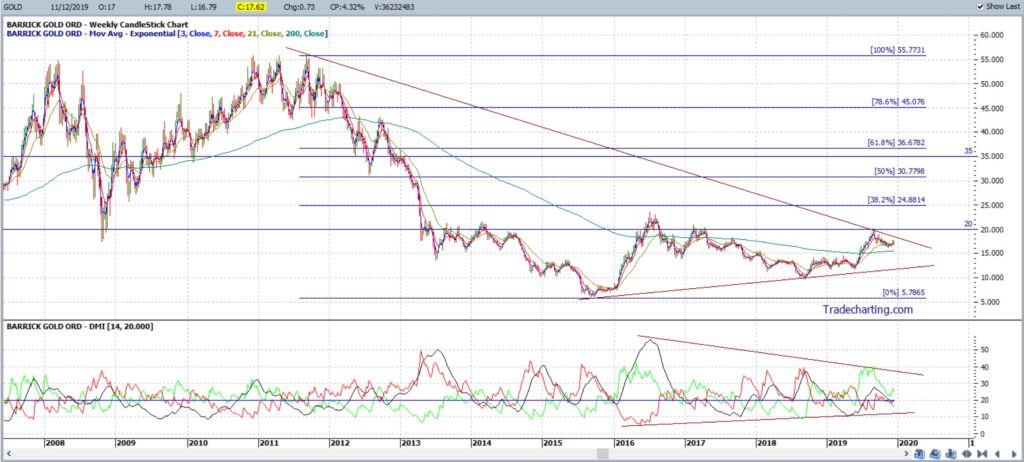
Gold (Barrick Gold) weekly: it might be best to wait for any break above $20 for a potential push to previous S/R near the 61.8% fib, circa $35:
CENX weekly: this has made a new breakout, and momentum is ticking higher, so watch for any push up to the region of the weekly 61.8% Fibonacci, circa $17:
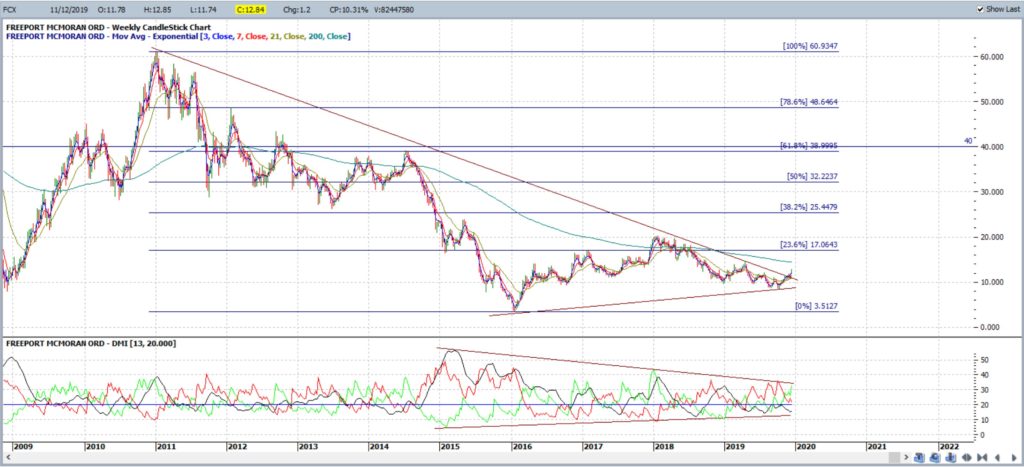
FCX weekly: this has made a new breakout so watch for any push up to the region of the weekly 61.8% Fibonacci, circa $40:
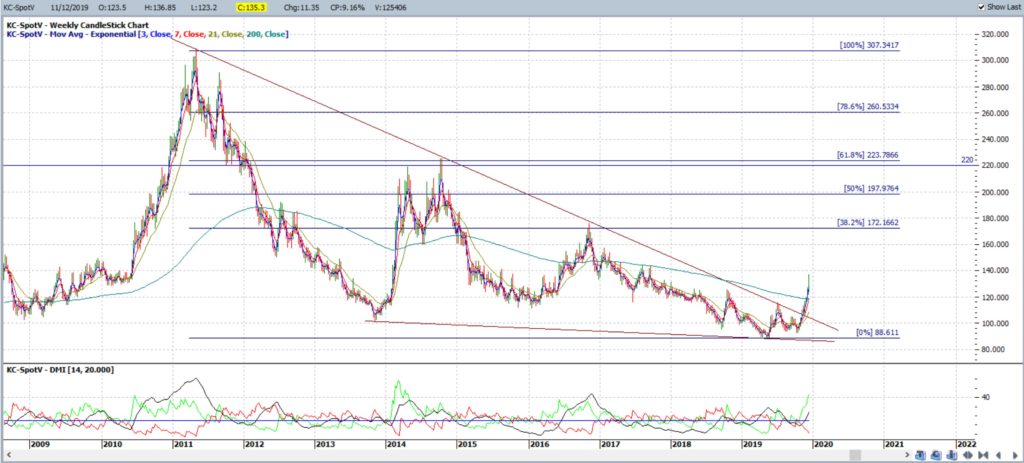
Coffee weekly: this has made a new breakout, and momentum is ticking higher, so watch for any push up to the region of the weekly 61.8% Fibonacci, circa $220:
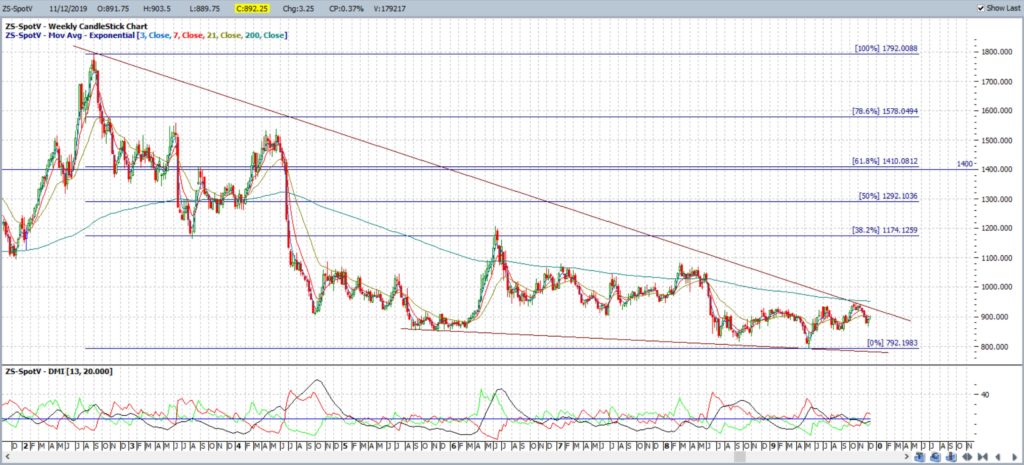
Soybeans weekly: watch for any new breakout and, if so, this would bring the region of the weekly 61.8% Fibonacci, circa $1,400, into focus:
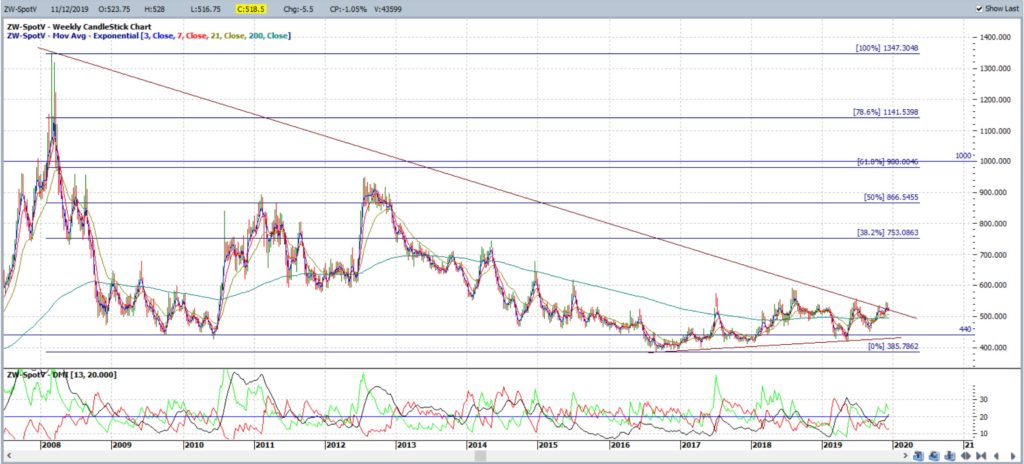
Wheat weekly: this has made a very new breakout, and momentum is ticking higher, so watch for any push up to the region of the weekly 61.8% Fibonacci, circa $1,000:
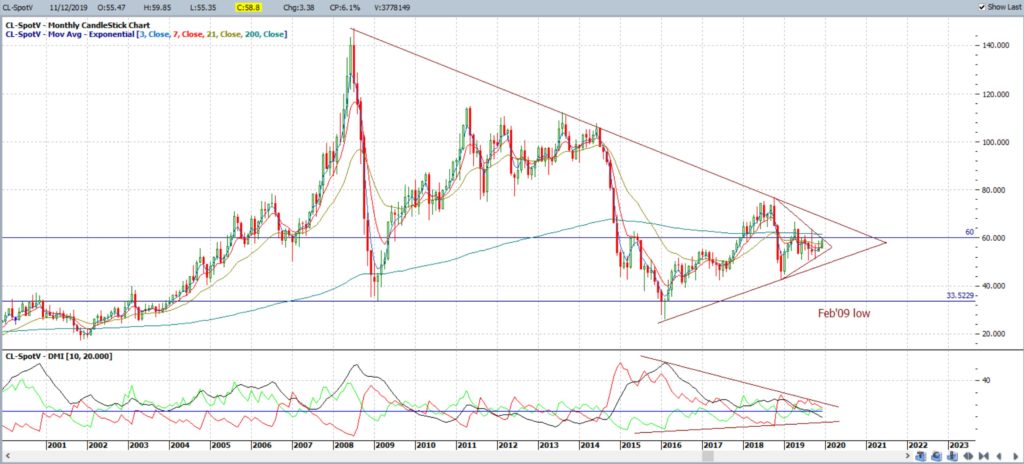
Oil monthly: watch for any breakout above $60 and from the smaller triangle:
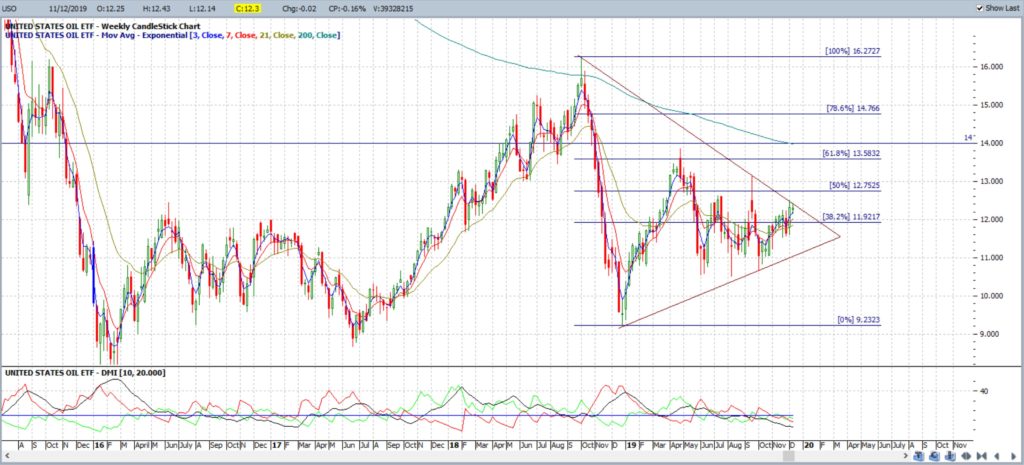
USO weekly: US Oil ETF: watch for any new breakout and, if so, this would bring the region of the weekly 61.8% Fibonacci, circa $14, into focus:


