This post was prompted following my chat with another trader at today’s Sydney ATAA meeting. This guy was keen to LONG Sugar given its current Low near support so I thought I’d check in on a few other commodity Futures charts to see how they’re shaping up against the backdrop of recent Trade War rhetoric. The charts below are of the few that most caught my attention given their current chart patterns. It is worth noting that many Commodities are trading down near major support levels. Just sayin’! FYI: Trading View has Futures charts of every commodity one could hope to chart and here are just a few.
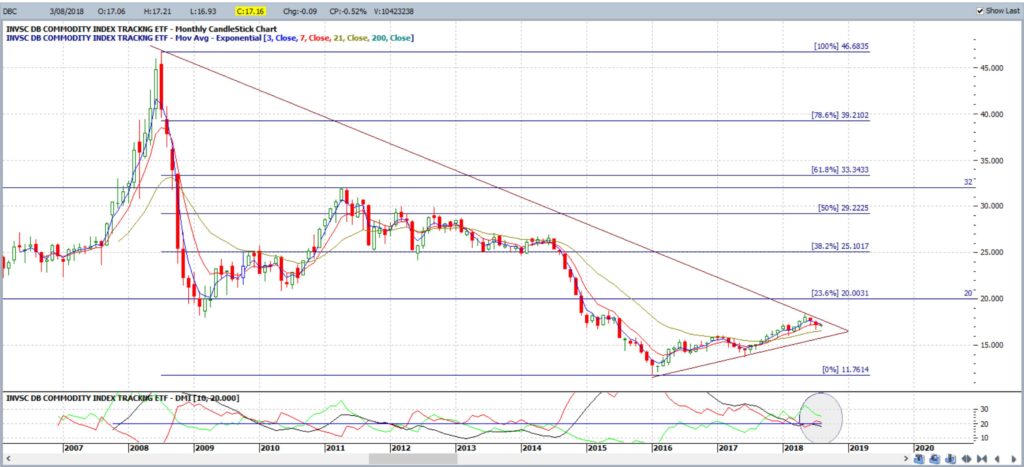
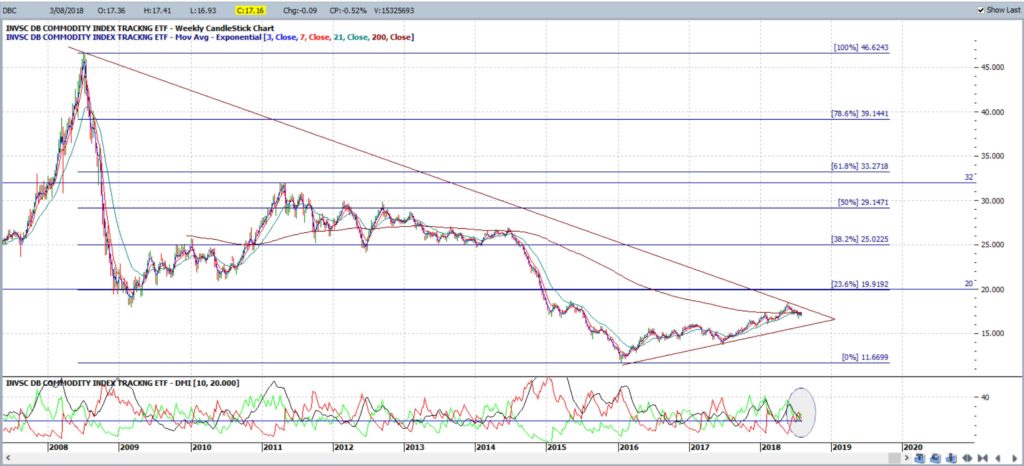
Commodity ETF: DBC:
DBC monthly: Commodity ETF: not a lot of momentum as price action trades below the key 20 level. Any breakout on this Commodity ETF chart would help to guide movement on individual commodity charts:
DBC weekly: Commodity ETF: not much momentum here either:
Individual Commodity Charts: Source: Trading View:
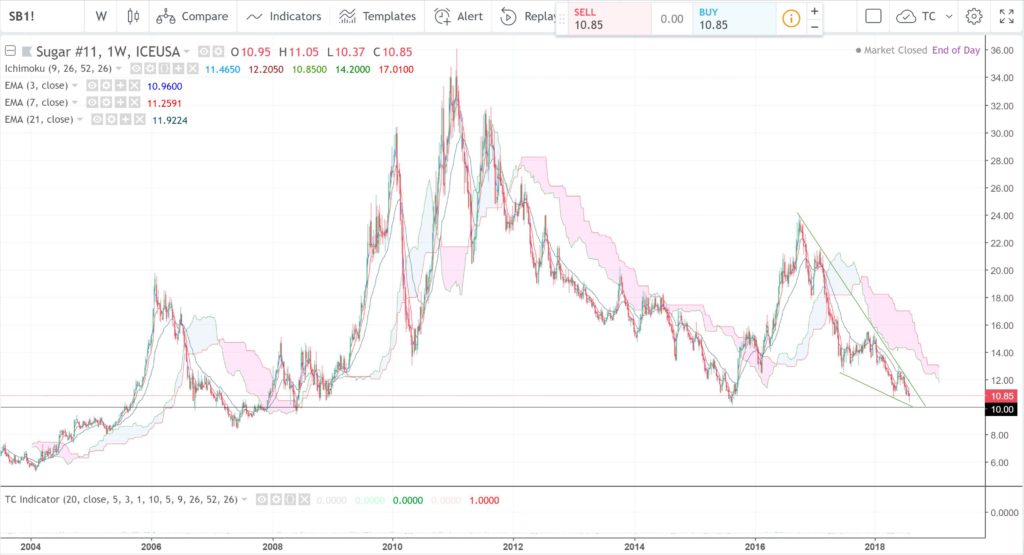
Sugar weekly: the weekly chart of Sugar Futures show price action in a bullish-reversal descending wedge above the support of the whole-number 10 level. Despite sugar taxes being implemented around the globe, this chart looks bullish:
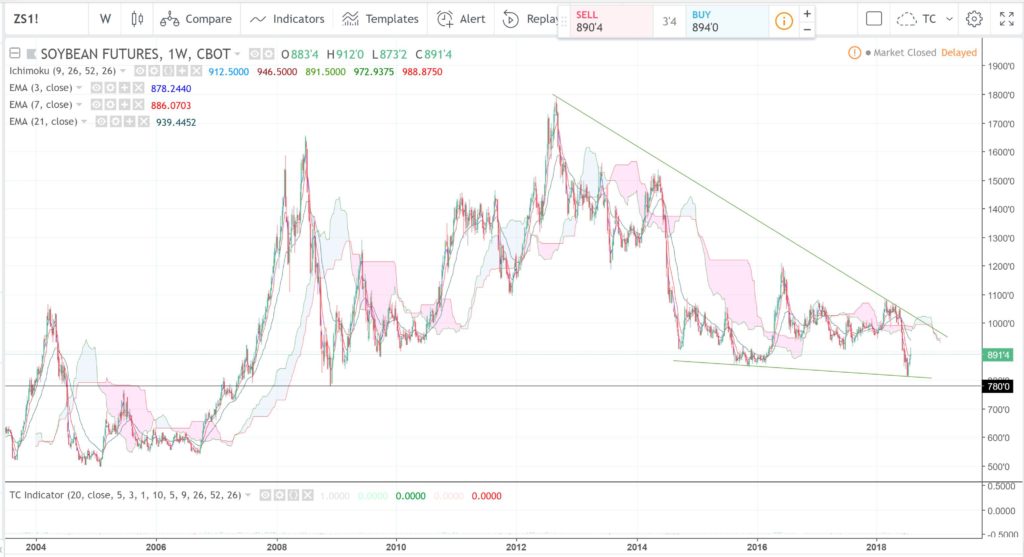
Soybeans weekly: Soybeans has been a victim of the recent Trade War debate but is a commodity I would prefer over Sugar. Price action is within a bullish-reversal descending wedge here too and hovering above 780 S/R:
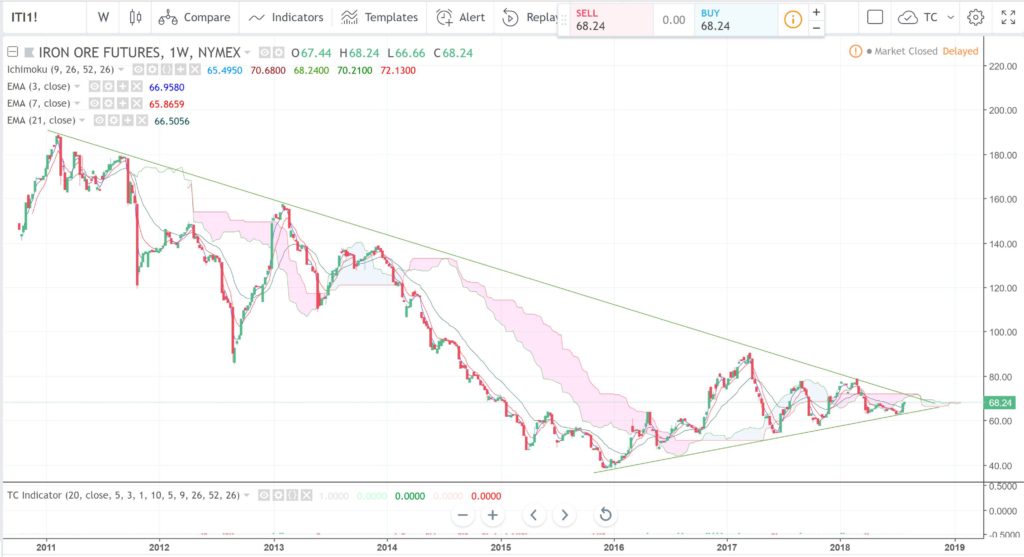
Iron Ore weekly: this is looking ripe for a breakout as price action is squeezed into the apex of this weekly triangle:
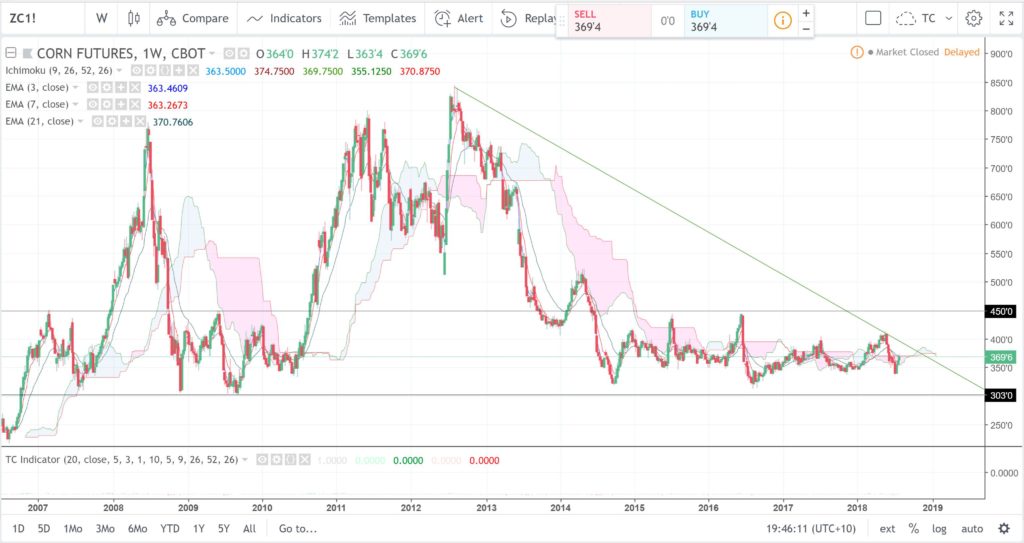
Corn weekly: Corn is also down near decent support from the 303 level and getting squeezed under a bear trend line:
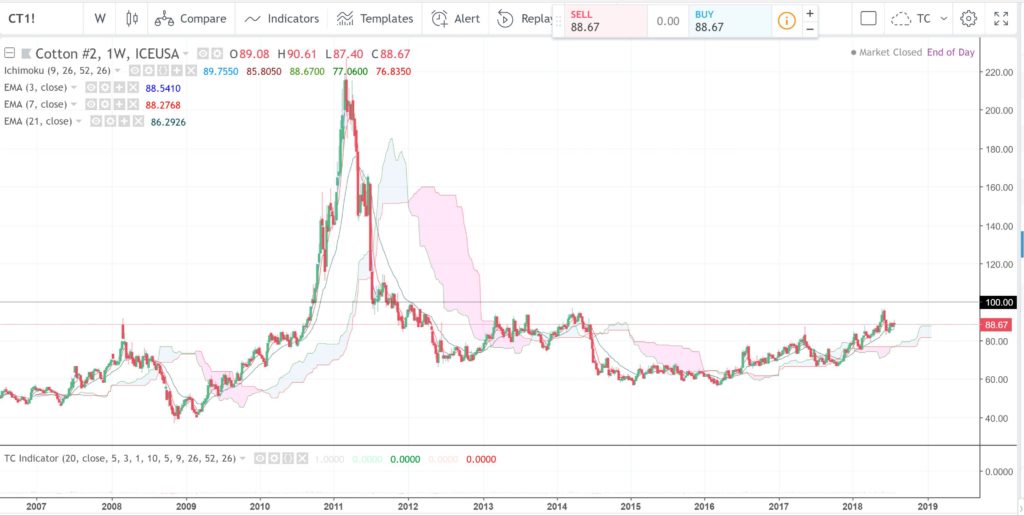
Cotton weekly: any break and hold above 100 would have to be read as bullish!
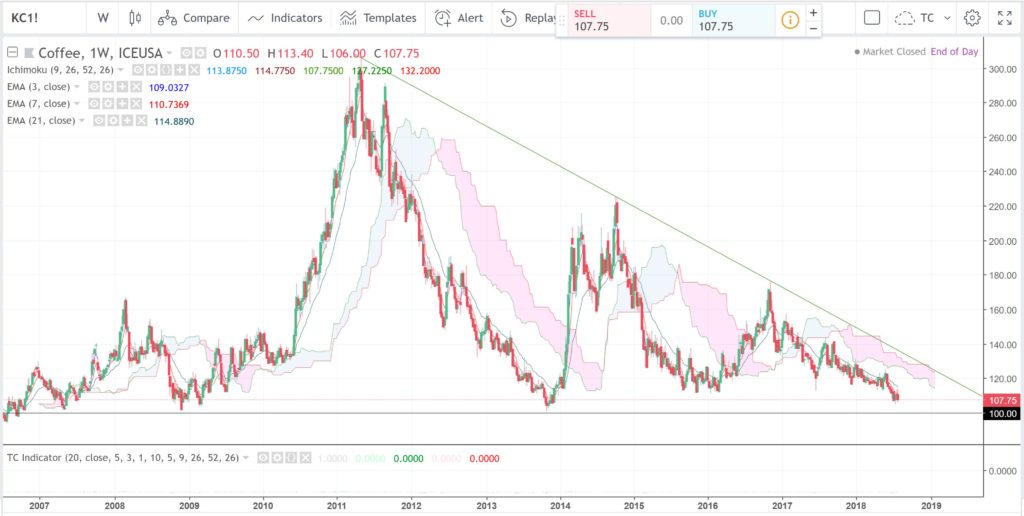
Coffee Weekly: this is one interesting chart too as price hovers above 100 S/R
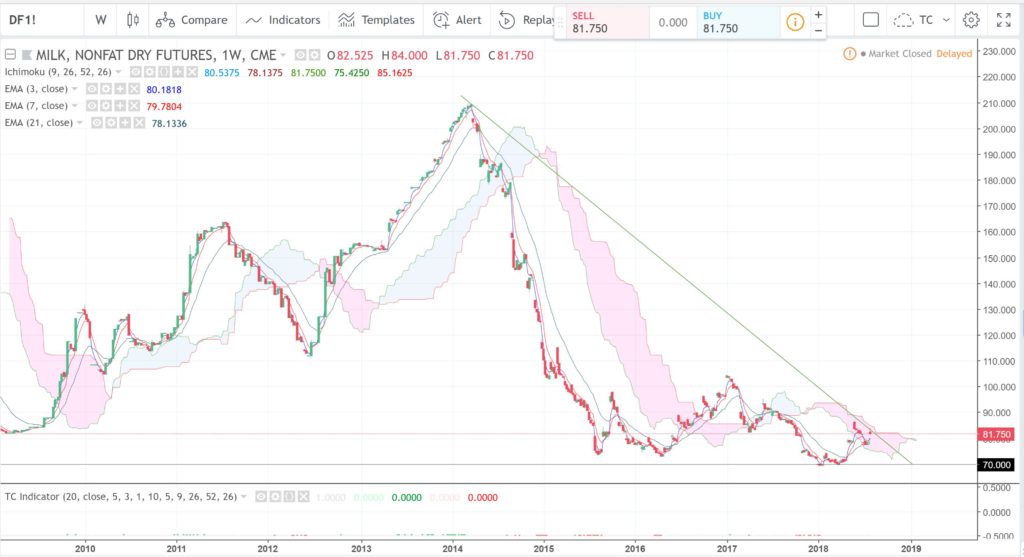
Milk weekly: another one being squeezed under a bear trend line so worth watching for any trend line breakout:


