One of the main take-aways from Dow Theory is that trends do not travel in straight lines unabated. With Gold popping its head above $1,400 I’m wondering, should the metal hold this level into the month end, whether this could underpin some mean-reversion activity with other commodities? Numerous commodities and commodity ETF are well down from their Highs which raises the potential for some eventual recovery activity, even if only temporary. In this post I chart some commodities and commodity ETFs and suggest traders keep an open mind about the possibility of some potential for basing activity and mean-reversion.
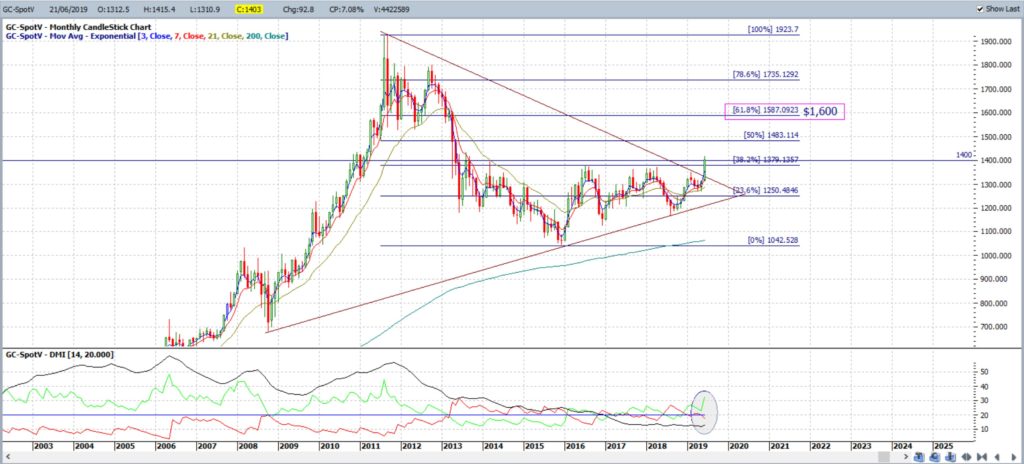
Gold monthly: Gold is shaping up for a potentially big week given the weekly close above $1,400; a close above this level at the end of next week would mark the first monthly close above $1,400 since April 2013! The long-term target here is $1,600, being near the monthly 61.8% fib.
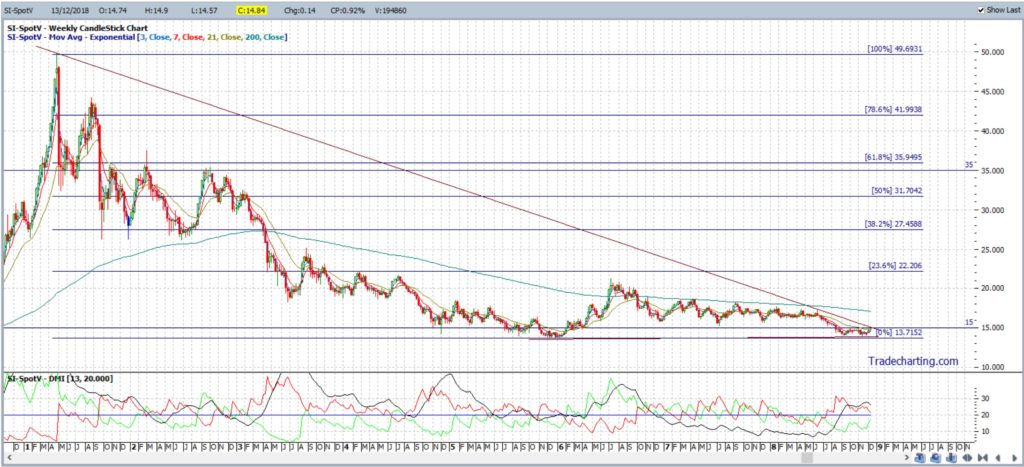
Silver weekly: Keep an eye out for any trend line and $15 breakout here by month end. I published a separate article about Silver yesterday that can be found through this link.
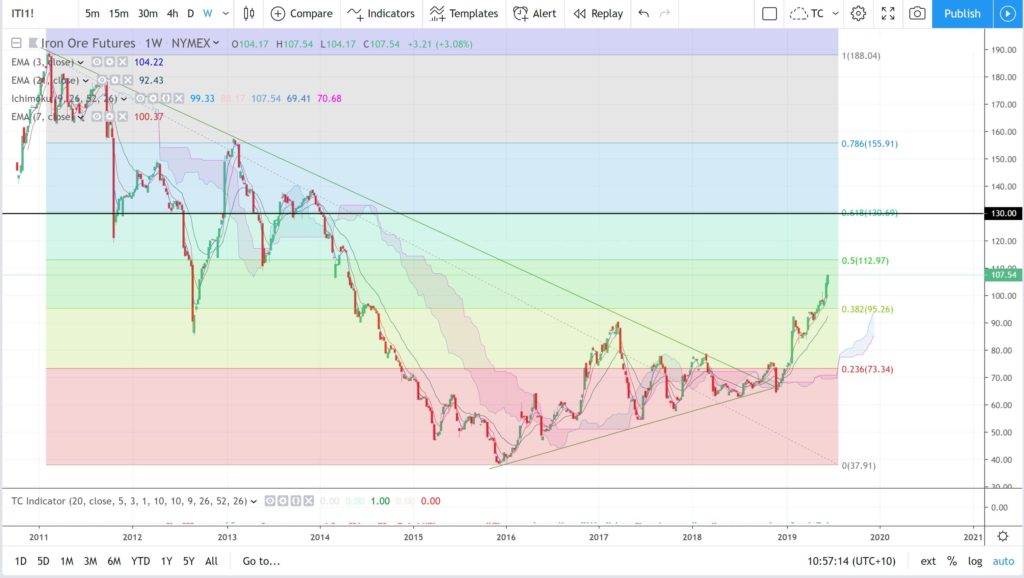
Iron-Ore weekly: this has already broken up and out of its chart pattern and the target remains as 130, near the weekly 61.8% fib and previous S/R:
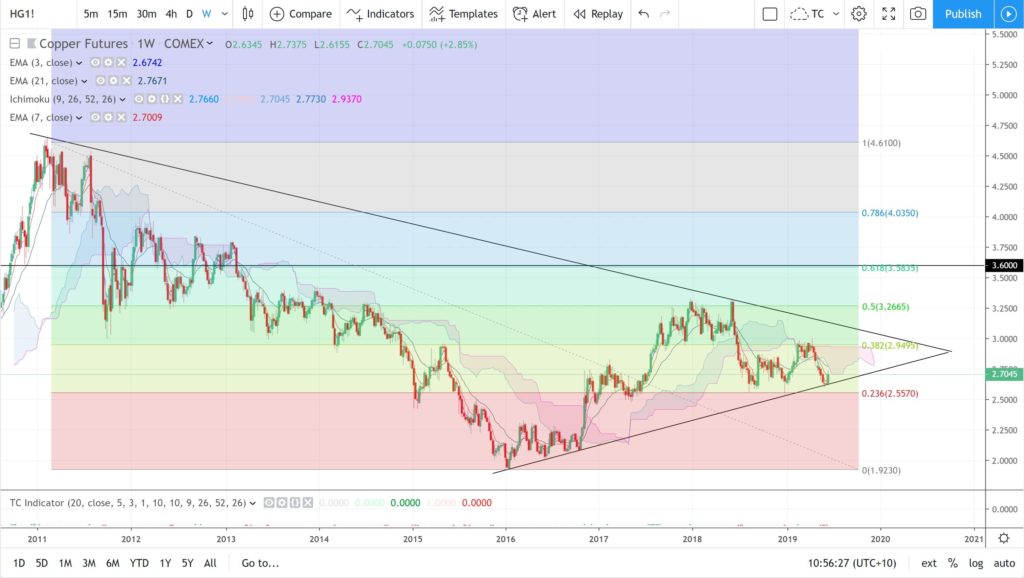
Copper weekly: watch for any bounce off this bottom trend line. A triangle breakout would bring the 1.6 level into focus as it’s near previous S/R and the weekly 61.8% fib:
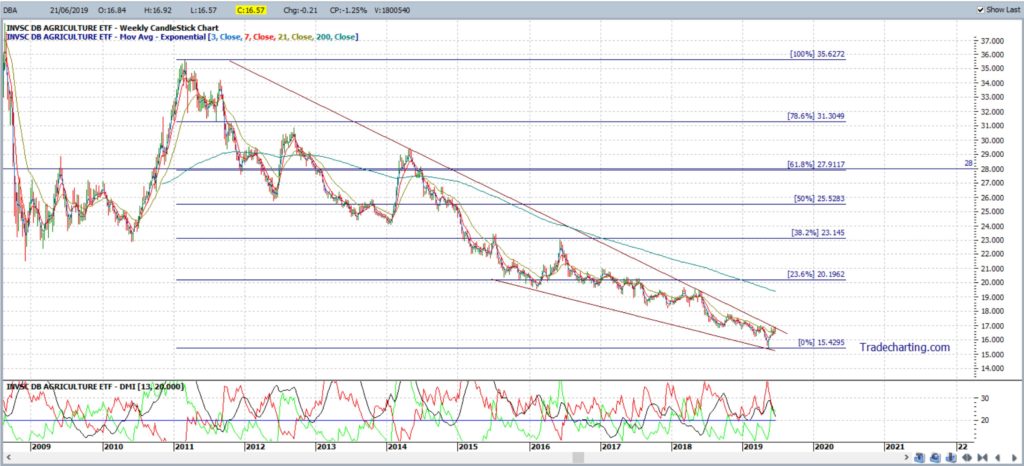
DBA weekly: watch for any wedge breakout on this Agricultural ETF as this would bring the 28 level into focus given it’s near previous S/R and the weekly 61.8% fib:
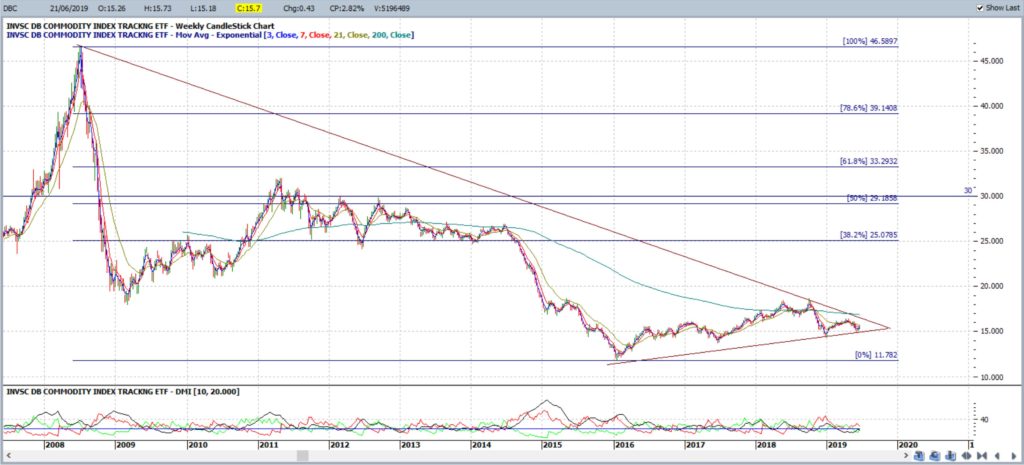
DBC weekly: watch for any triangle breakout on this broad-based Commodity ETF as this would bring the 30 level into focus given it’s near previous S/R and the weekly 50% fib:
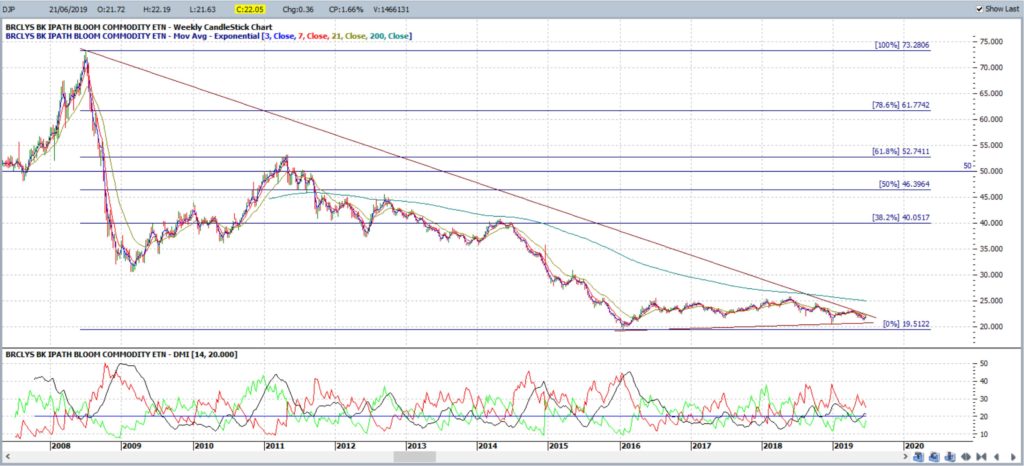
DJPW weekly: watch for any triangle breakout on this Commodity ETF as this would bring the 50 level into focus given it’s near previous S/R and the weekly 50% fib:
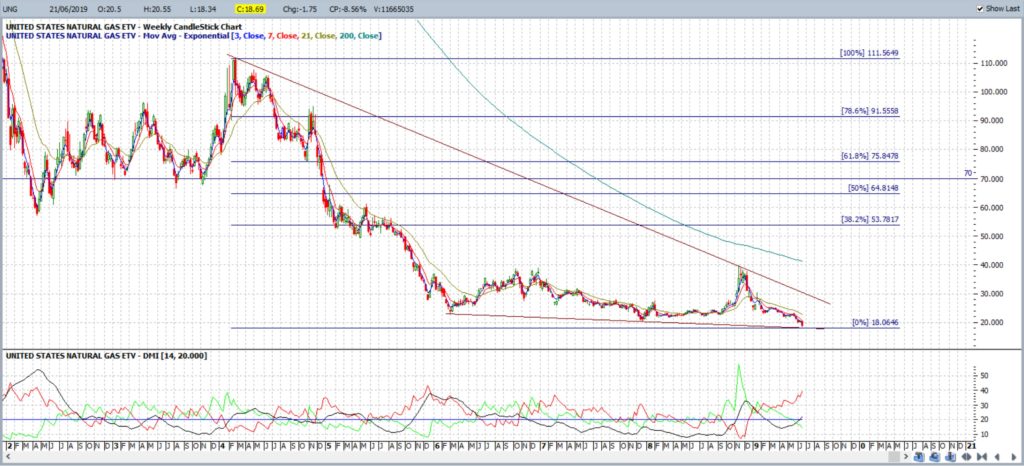
UNG weekly: watch for any bounce for the Natural Gas ETF off the bottom wedge trend line and, then wedge breakout. A wedge breakout would bring the 70 level into focus given it’s near previous S/R and the weekly 50% fib:
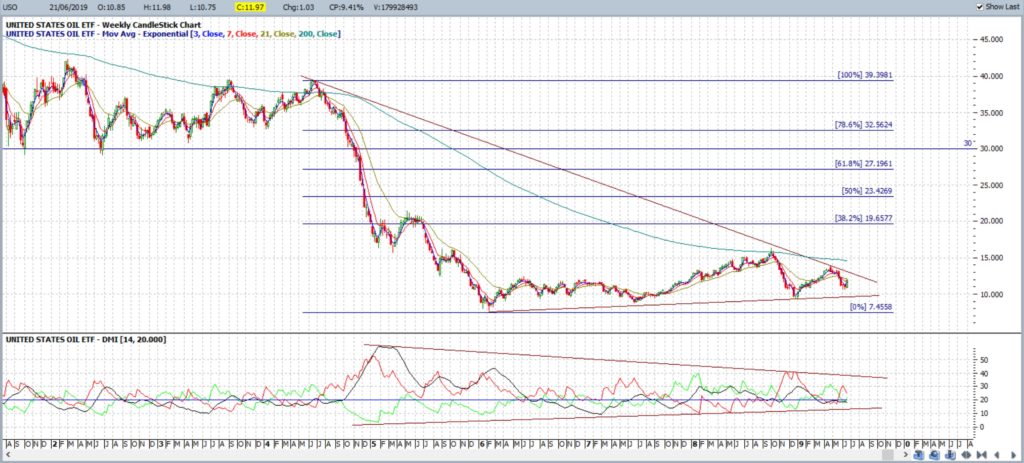
USO weekly: watch for any triangle breakout with the Oil ETF as this would bring the 30 level into focus given it’s near previous S/R and the weekly 61.8% fib:
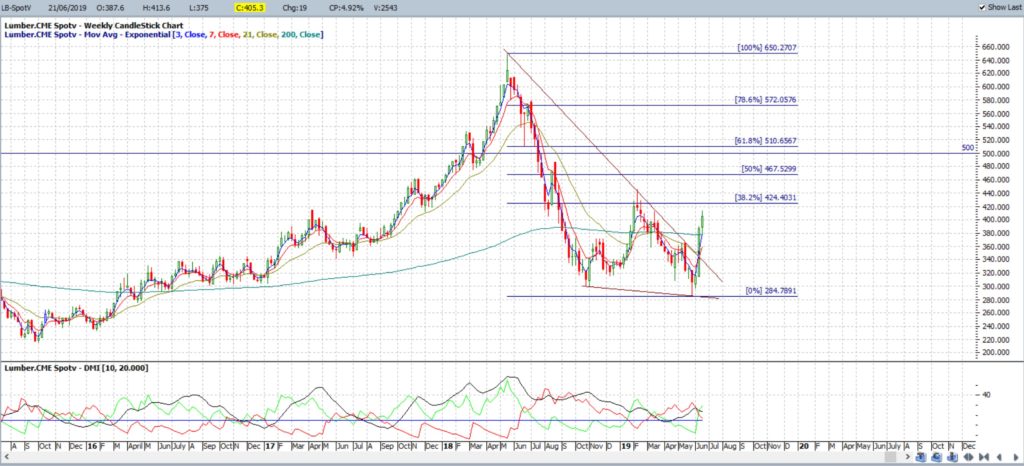
LB weekly: Lumber looks like it has already made a wedge breakout so watch for any push to the 500 level into focus given it’s near previous S/R and the weekly 61.8% fib:


