Thurs 21st Aug
I was discussing the recent bullish Tenkan/Kijun cross on the S&P500 with a fellow trader this morning and they raised similar bullish thoughts for the German DAX index. The DAX is a stock index representing the top 30 German companies trading on the Frankfurt Stock Exchange. So I thought I’d check out some charts of the DAX to see how they’re setting up.
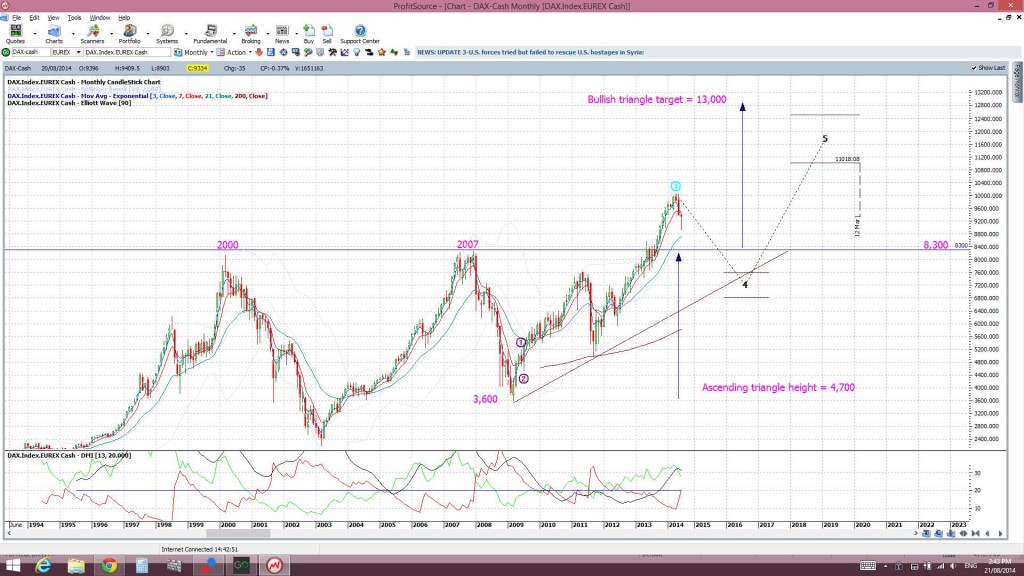
The monthly chart of the DAX shares a bit in common with that of the S&P500. Both indices peaked in 2000 and 2007 and both then made bullish ascending triangle breakouts in 2013. Blog traders will be familiar with my bullish target calculations for the S&P500 and I have carried out a similar calculation for the DAX.
DAX monthly: the height of the bullish ascending triangle was 4,700 ( 8,300 – 3,600).The technical theory for these patterns predicts that any potential bullish follow through would extend by the same order of magnitude up from the breakout level. That is, up 4,700 from the 8,300 level. This suggests a bullish target of 13,000. I do note that my Elliott Wave indicator is not quite as bullish as this:
S&P500 monthly: note the similar pattern on the S&P500 chart.
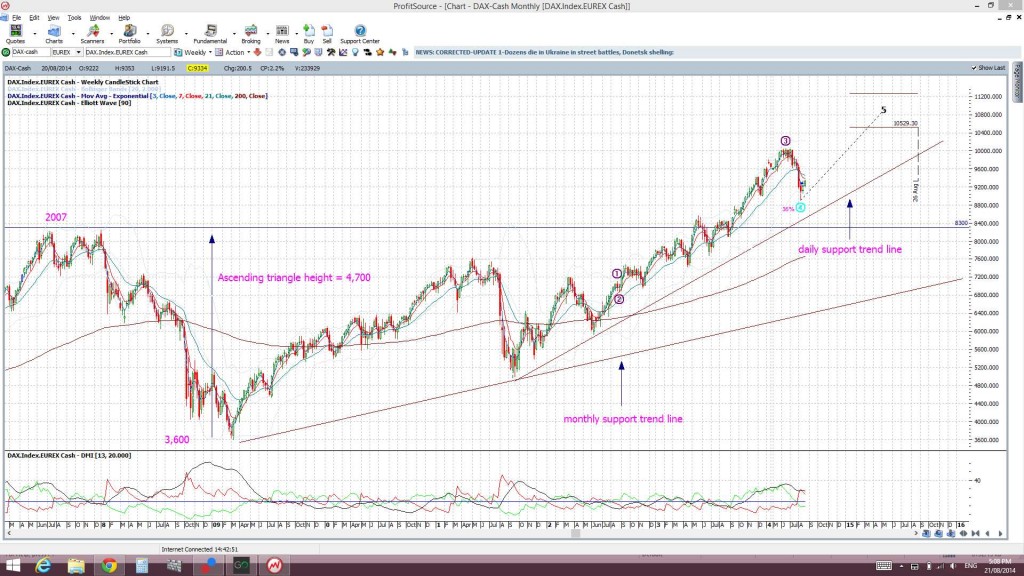
DAX weekly: price has pulled back a bit to test the previous breakout level. Note the daily and monthly support trend lines:
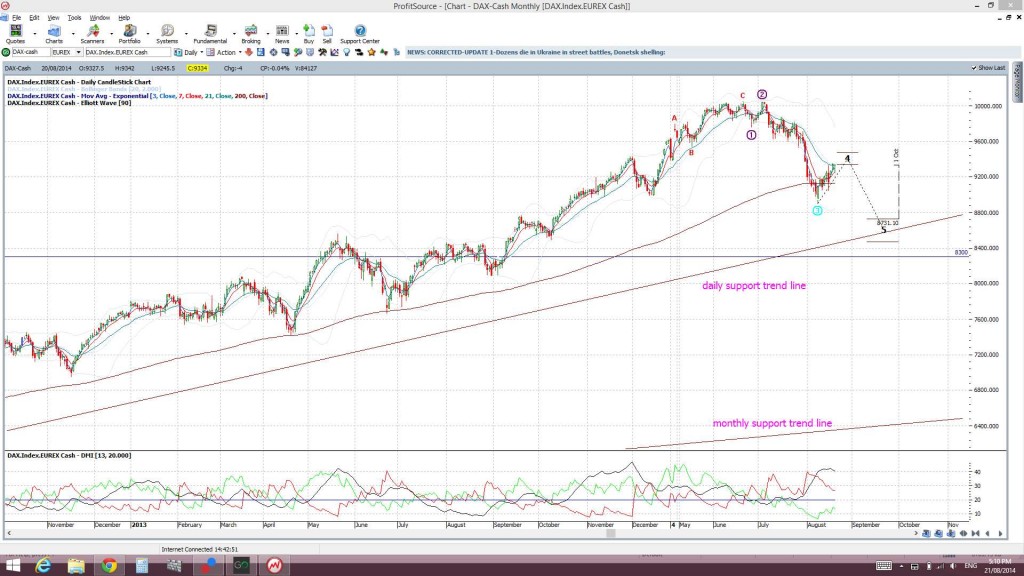
DAX daily: a daily support trend line is still in place despite the recent pull back:
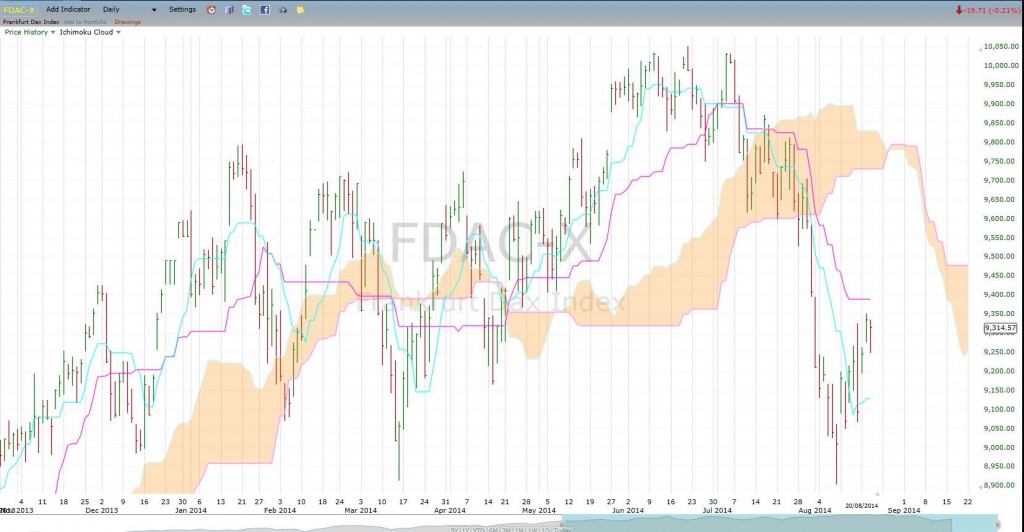
Unlike the S&P500 though the DAX index is still well below the daily Ichimoku Cloud:
DAX daily Cloud:
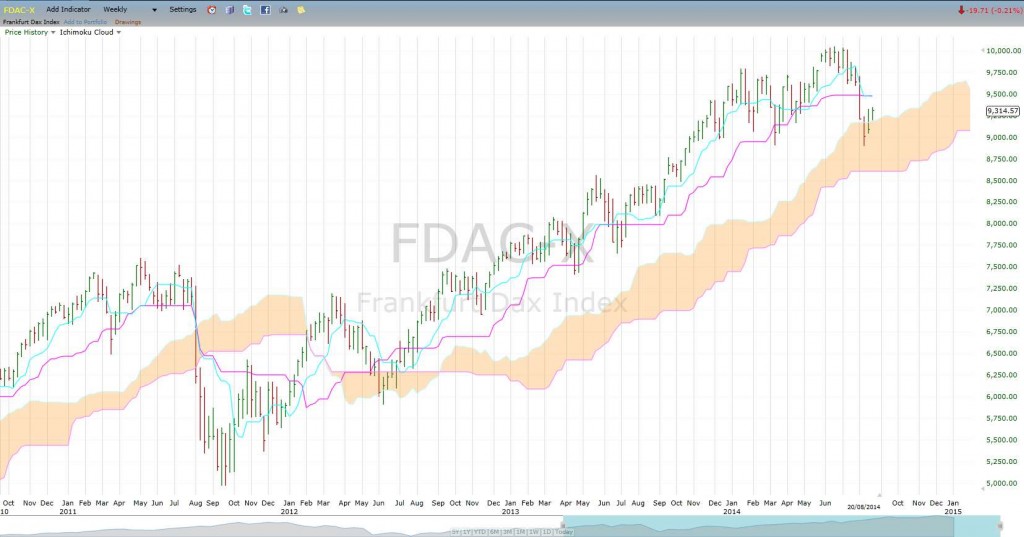
DAX weekly Cloud: the weekly Cloud chart is interesting though as price can be seen to have bounced up off the weekly Cloud:
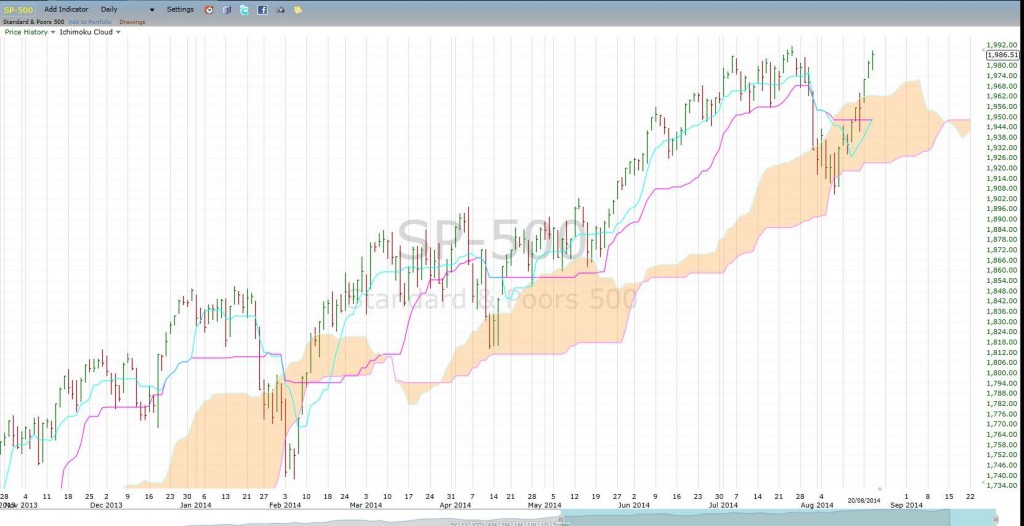
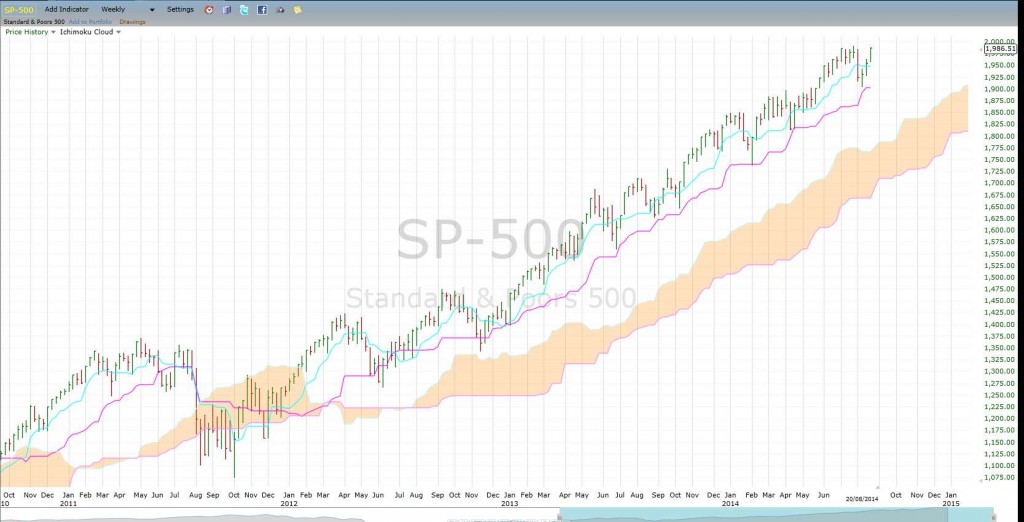
The S&P500 daily and weekly Cloud charts are shown below for comparison sake:
S&P500 daily Cloud: I note that the bullish Tenkan/Kijun cross is not completed on this particular charting software:
S&P500 weekly Cloud: pretty impressive!
The trader I was chatting with was predicting that the DAX would hit 10,000 in the next few sessions. My technical perspective suggests an ultimate target of up at 13,000 but, like with the situation on the S&P500 index, I have no idea when this target might be reached.


