This page contains examples of Bull Flag chart patterns following on from the explanation offered here.
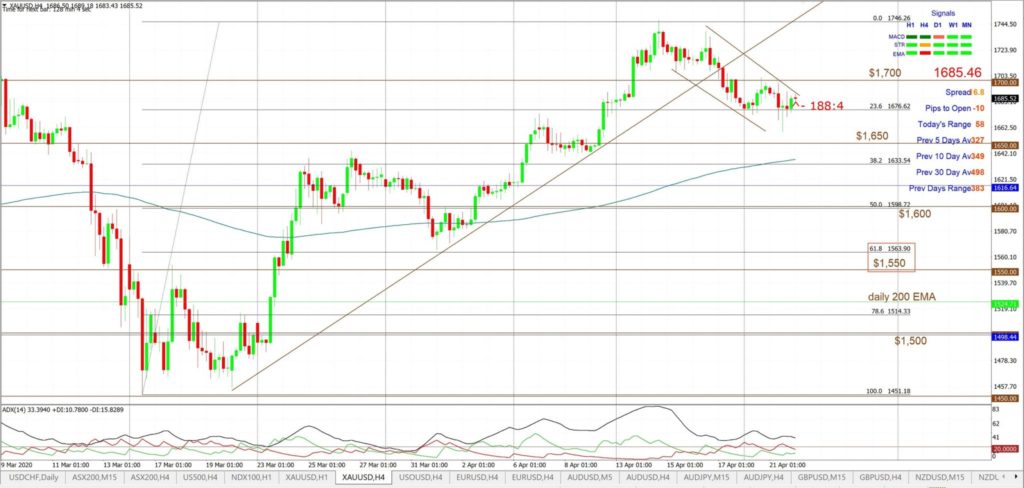
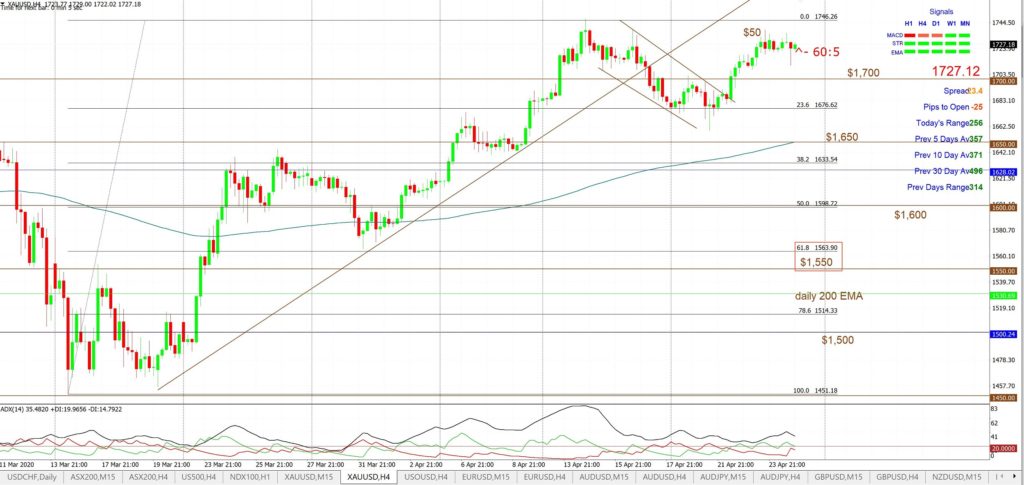
Gold April 2020: This Bull Flag only tracks the initial breakout but does reveal how reliable this pattern can be. This Bull Flag breakout generated a move worth up to $50 in just a few days:
Gold 4hr: Bull Flag highlighted April 22nd 2020:
Gold 4hr: Bull Flag gave up to $50:
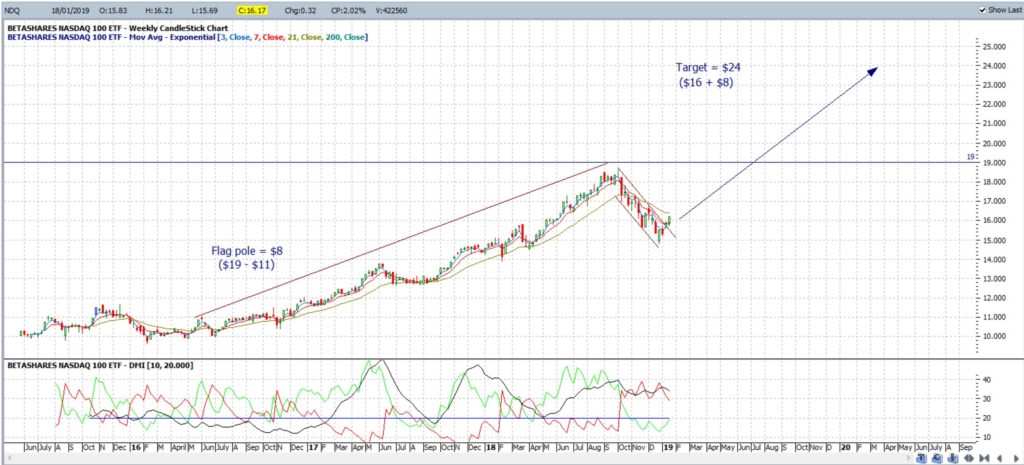
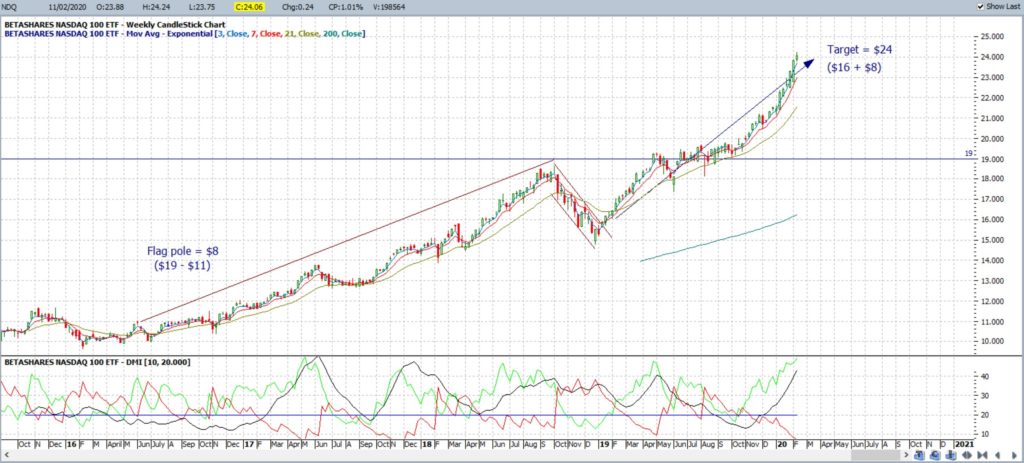
NDQ Feb 2020: This Bull Flag on the NASDAQ ETF, NDQ, was Tweeted on January 27th 2019. It took 12 months to complete but delivered a 50% RoI; a gain of $8 from the $16 breakout:
NDQ weekly: new Bull Flag b/o on Jan 27th 2019:
NDQ weekly: Bull Flag completed by February 2020.
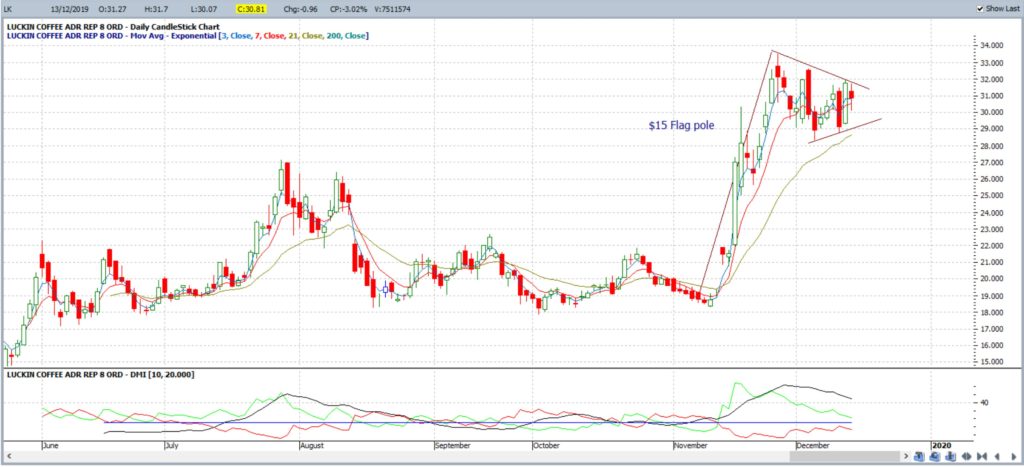
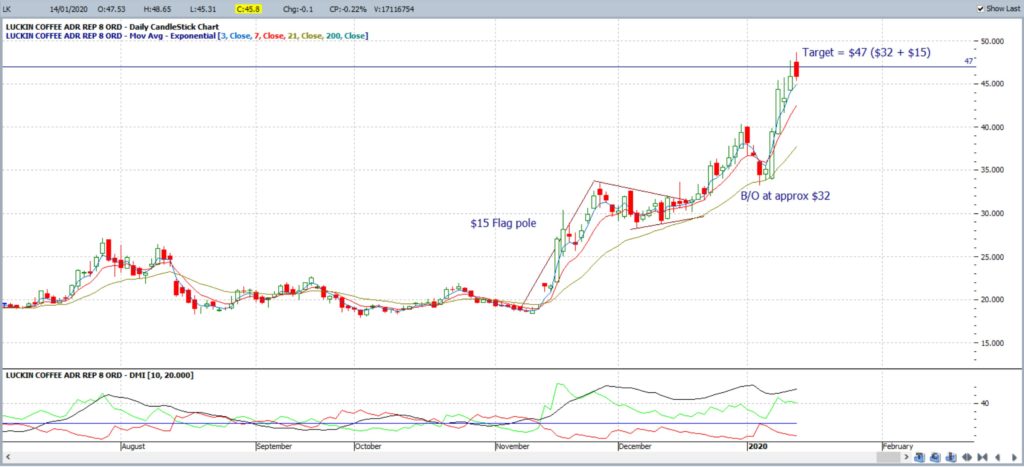
LK daily: This $15 Bull Flag didn’t take long to play out!
LK daily: Bull Flag noted December 2019:
LK daily: Bull Flag completed January 2020:
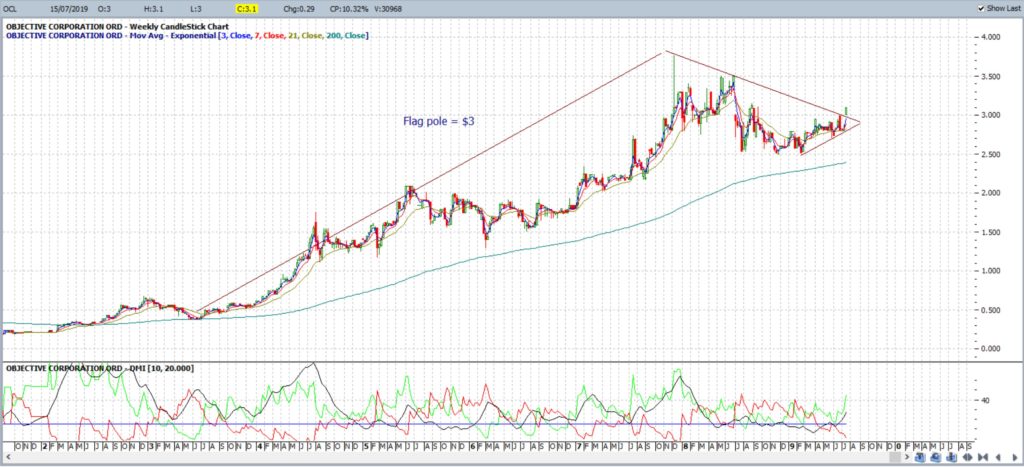
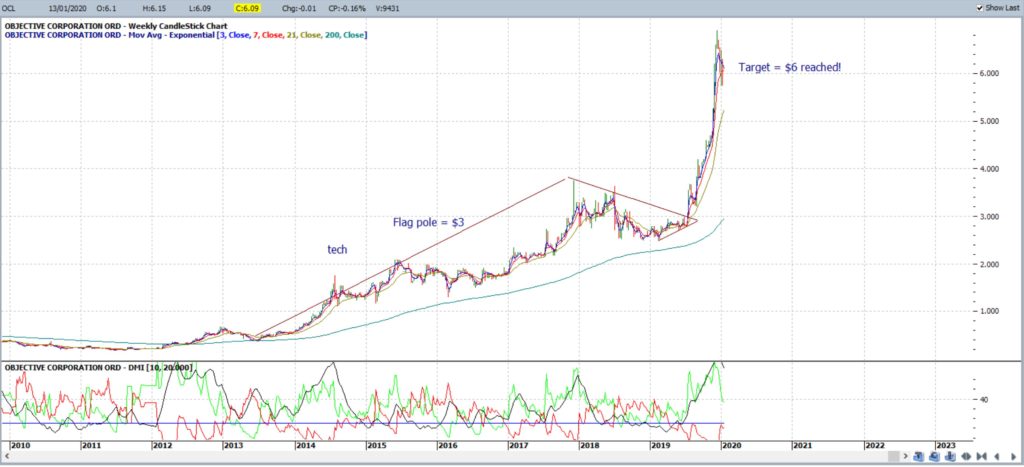
OCL weekly: This Bull Flag, posted in an article July 2019, has now completed as of January 2020:
OCL weekly: posted in July 2019:
OCL weekly: Bull Flag b/o target of $6 reached January 2020:
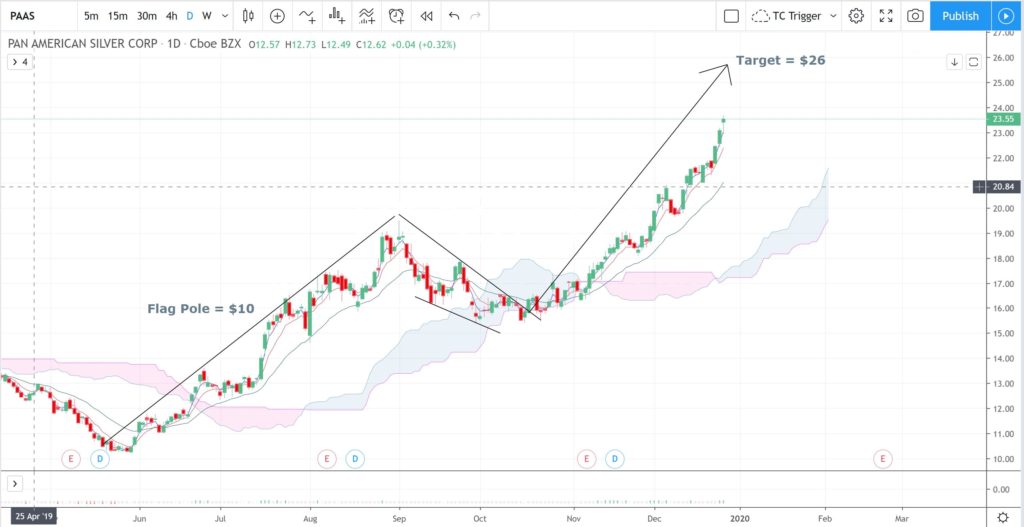
PAAS daily: Dec 2019: this Bull Flag is well underway and getting close to its target:
PAAS daily: Bull Flag completed:


