Bitcoin chat has been rather quiet of late as the currency continues to decline. However, recent price action is conforming to a bullish-reversal descending wedge. This post offers chart updates of BTC/USD following my recent article published in the December issue of Your Trading Edge.
My article in Your Trading Edge: profiled at the lower margin in this screen shot of the magazine:
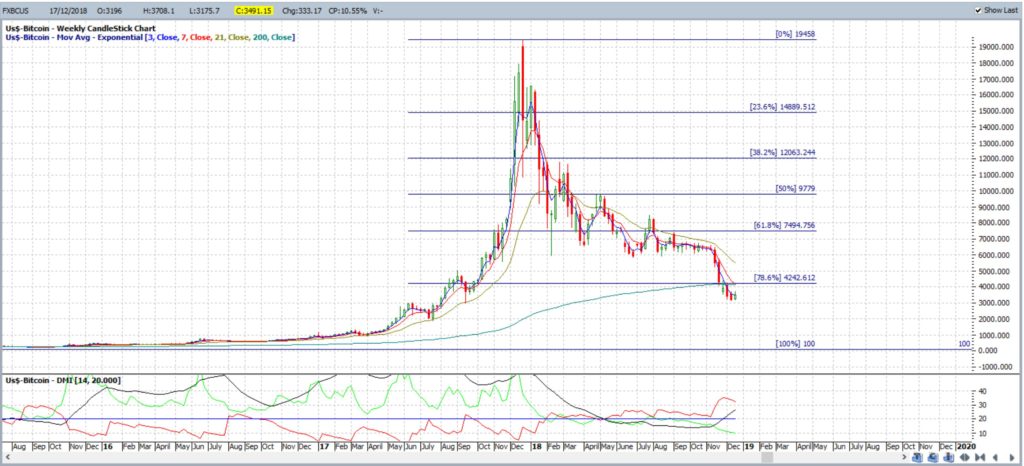
BTC/USD weekly: price has pulled back past all of the major Fibonacci retracement levels. Any continued bearish follow-through would have me looking down to the longer-term Low, near $100:
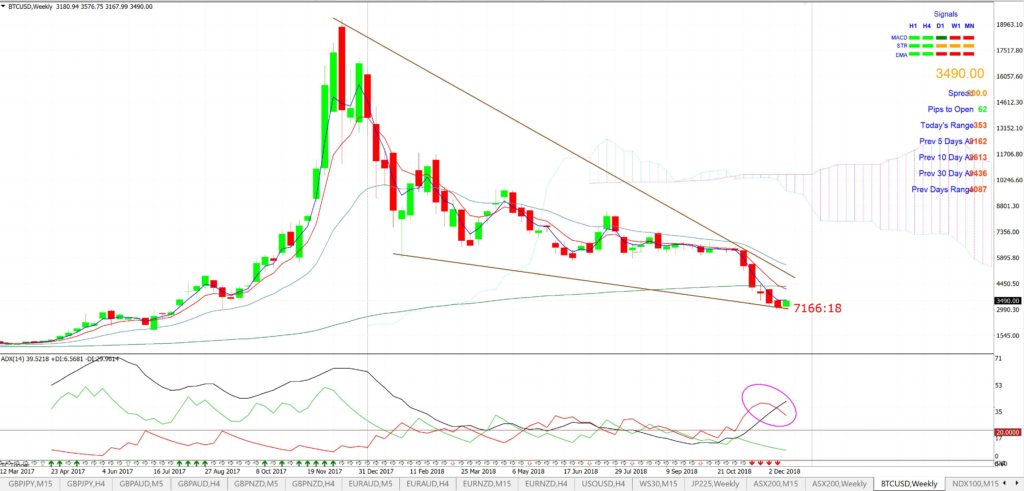
BTC/USD weekly: a close-up of recent price action shows a bearish-reversal Descending Wedge forming up so I’m watching to see if that delivers at all. Note how the crypto is trying to print a bullish weekly candle after 8 bearish weeks. Note, also, how bearish momentum is declining and this is a type of divergence against recent falling price so some caution is needed here; at a minimum.
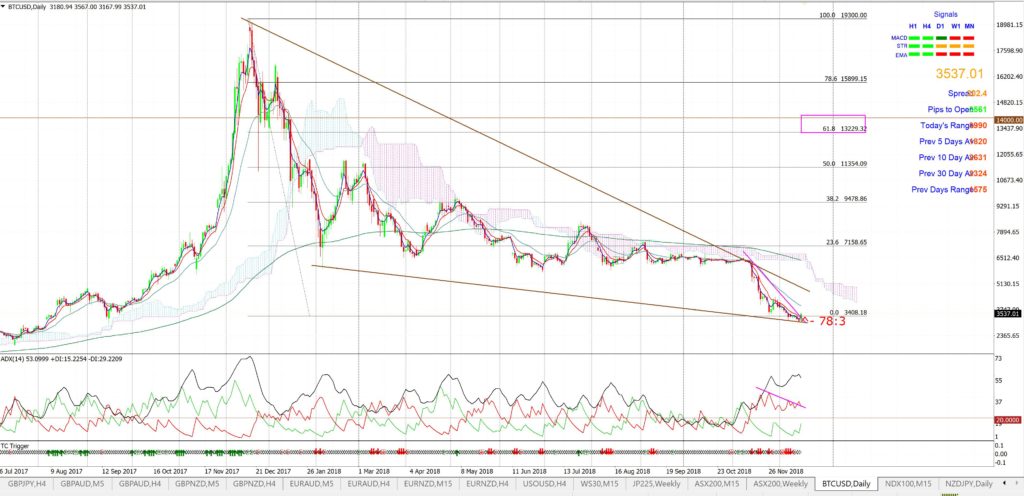
BTC/USD daily: There is divergence on this daily time frame as well. Any bullish wedge breakout would have me looking up to the daily chart’s 61.8% fib, near $13,000:
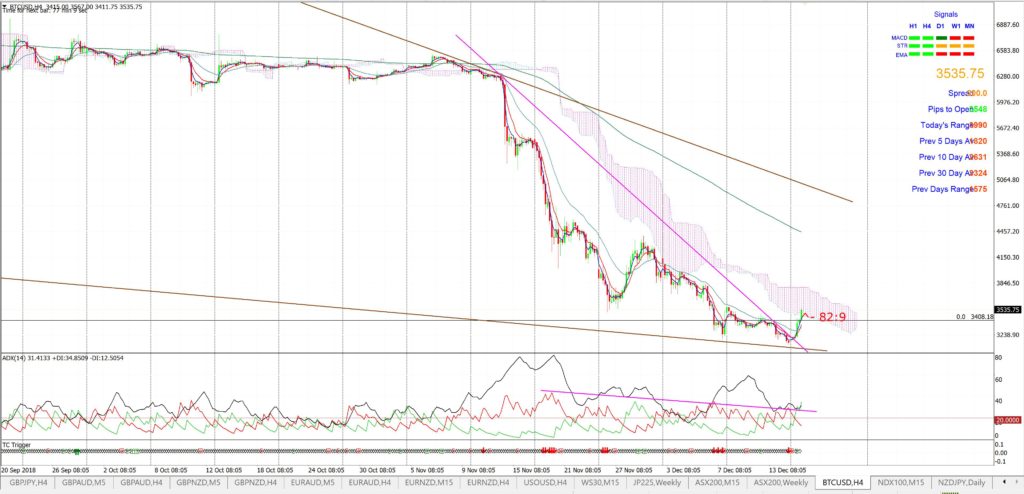
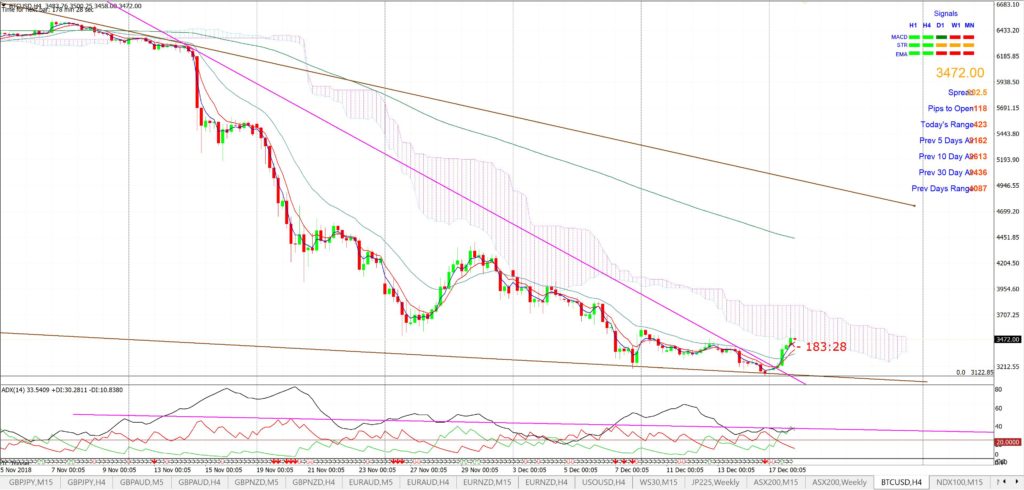
BTC/USD 4hr: Price action has been below the 4hr Cloud for the last 5 weeks but watch for any new close above this resistance zone:
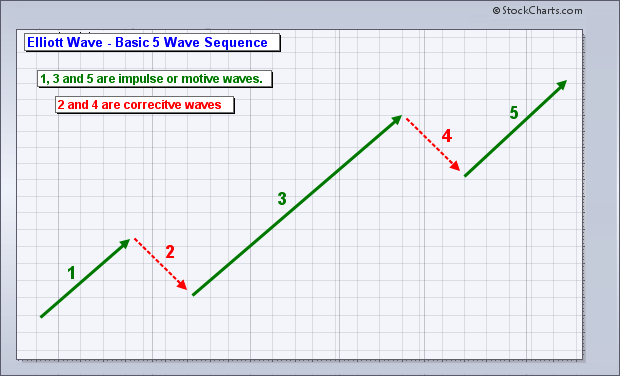
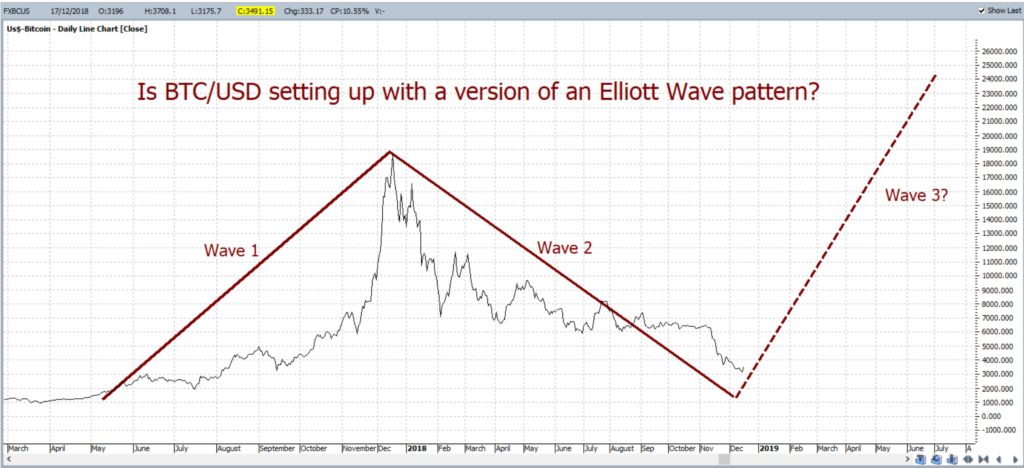
BTC/USD daily: Elliott Wave? I’m still mapping price action to see if BTC/USD is conforming to any type of Elliott Wave pattern here. I agree it looking like a long stretch at the moment but, if so, watch out for Wave 3 as it is usually the longest and most powerful move!
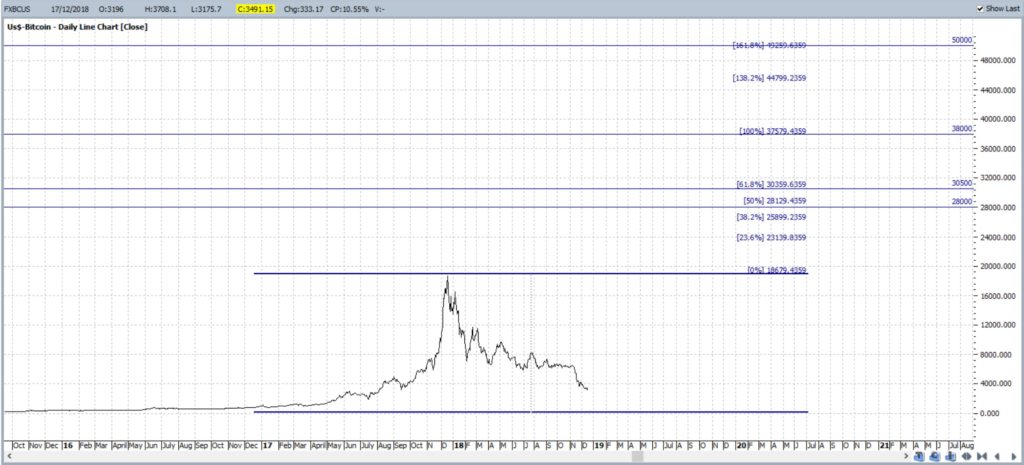
BTC/USD targets: any recovery of price action and close above the previous High would have me looking to Fibonacci targets as clues for the next major move.
Any bullish breakout and continuation beyond the $20,000 region would bring the following levels into focus as potential targets for Bitcoin price action (see levels on the chart below):
- The 50% extension: near $28,000.
- The 61.8% extension: near $30,500.
- The 100% extension: near $38,000 – $40,000.
- The 161.8% extension: near $50,000.
Summary:
I make no prediction about the next move for Bitcoin but simply watch, with interest, to see how price action might eventually breakout from this recent wedge pattern. I use momentum, by way of the ADX, and trend lines to help gauge and assess any new breakout from this current consolidation pattern. I use Fibonacci analysis to help identify potential target levels for any breakout move. Throughout this article I have identified key levels to monitor on Bitcoin and these include both bearish and bullish targets for any potential trend line breakout movement. These levels are summarised below:
Bearish Target:
- $100 as near the Low from the 2014-2017 swing High.
Bullish targets:
- $13,000: from the 61.8% fib retracement on the daily chart.
- $19,000 – 20,000: the previous High and 100% fib retracement on the daily chart’s 2017-2018 swing Low move.
- $28,000: the 50% Fibonacci Extension on the daily chart.
- $30,500: the 61.8% Fibonacci Extension on the daily chart.
- $38,000- $40,000: from the 100% Fibonacci Extension on the daily chart.
- $50,000: from the 161.8% Fibonacci Extension on the daily chart.
Disclaimer: I hold no position in Bitcoin or any cryptocurrency.


