I post updates on Bitcoin every now and then and this is another check up detailing how I’m seeing the charts of this cryptocurrency. My last detailed post was in April where I noted key levels to watch and the longer-term levels noted there are still valid. In this update I fine-tune some of the nearer term levels based on recent price action.
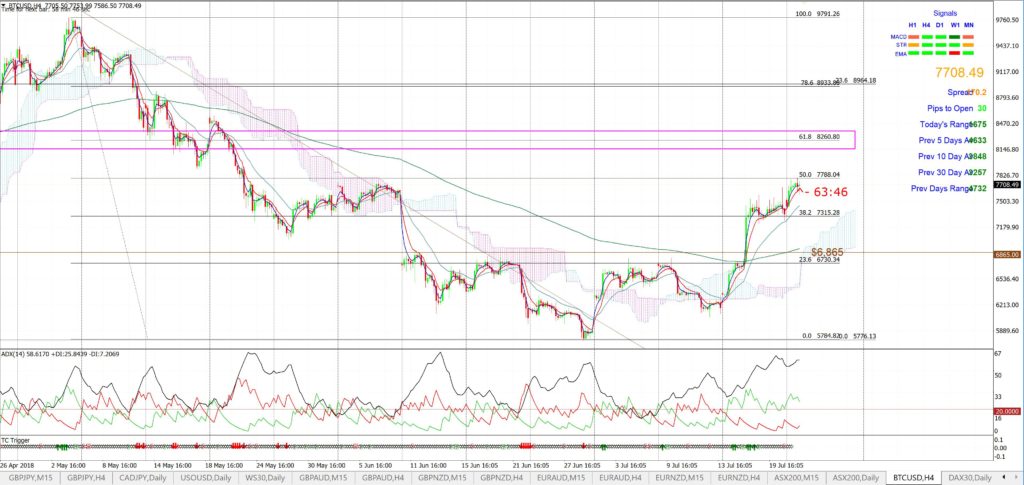
BTC/USD 4hr: Earlier last week I noted to TC members that BTC/USD was sitting at the 4hr chart’s 50% fib level and suggested watching for any move up to the popular 61.8% Fibonacci level (fib). This was the chart from that post:
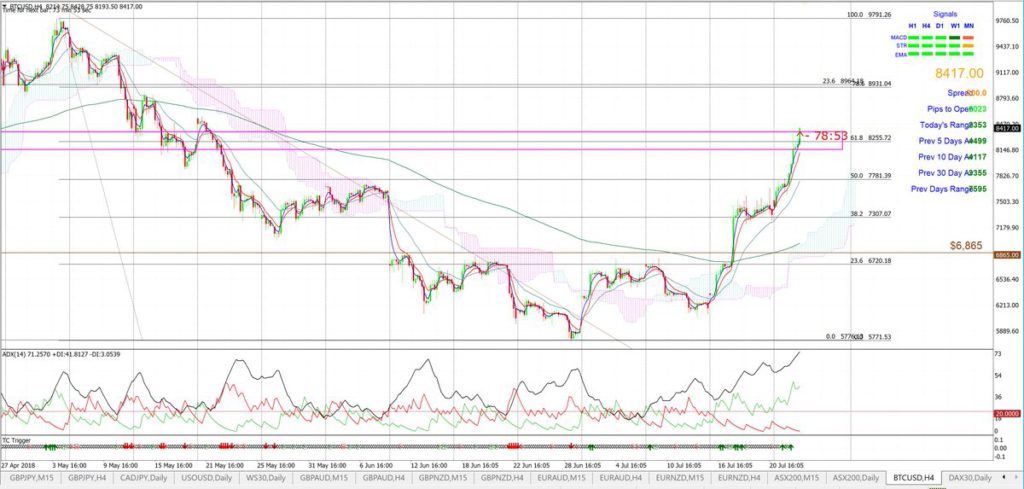
This is how the chart appeared the following day showing that price action did indeed push up to the ever popular 61.8% fib! The crypto gave a move worth over $650.00:
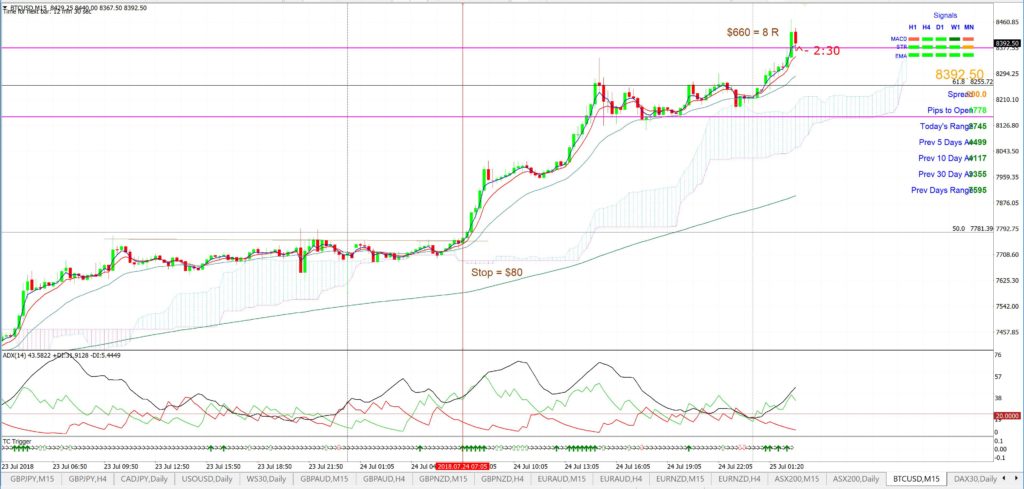
BTC/USD 15 min: This move also gave a decent TC signal worth 8 R (meaning the profit was 8 x the initial risk):
BTC/USD 4hr: revised trend lines:
The updated 4hr chart is below and shows price action consolidating within a new triangle under the recent 61.8% fib level. Any bullish triangle breakout will bring the 78.6% fib, near $9,000, followed by the 100% fib, near $9,750, into greater focus. The whole-number $10,000 would be the obvious next S/R level to monitor after that:
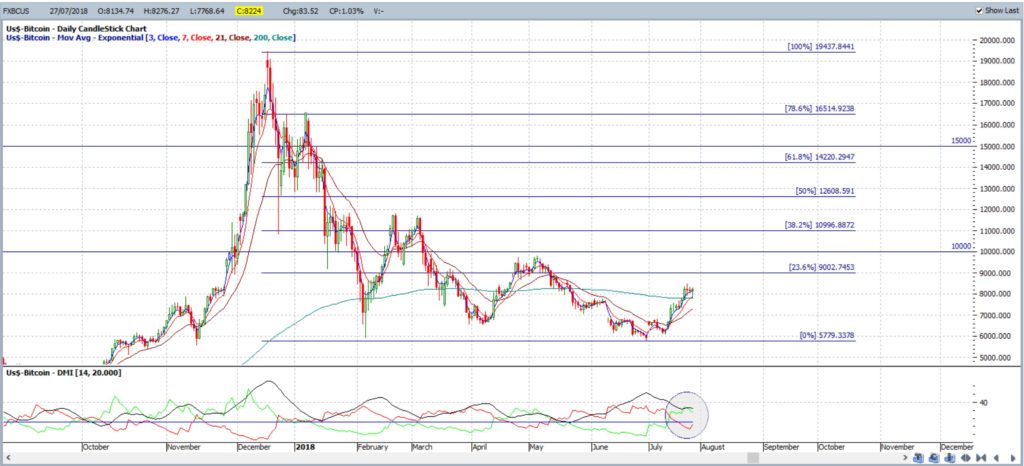
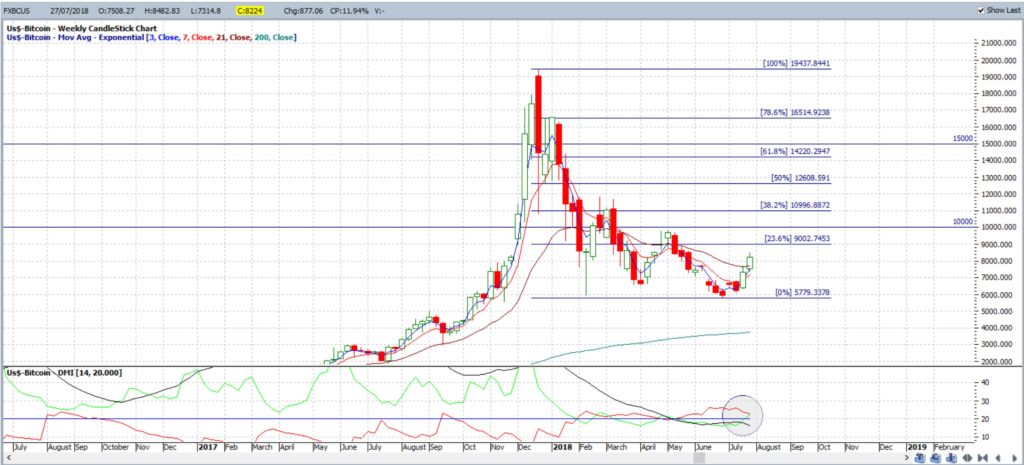
BTC/USD daily: Placing Fibonacci retracement on the whole of recent 2018 swing-low move shows that the 61.8% fib on this span is up near $15,000 S/R and this would be the next major target if the $9,750 level is broken. Other whole-number levels, especially the psychological $10,000, would act as S/R prior to this $15 K level though if bullish activity continues:
BTC/USD weekly: There is little momentum evident on the weekly chart at the moment however so watch the ADX for any move back above 20 to signal a potential new momentum move:
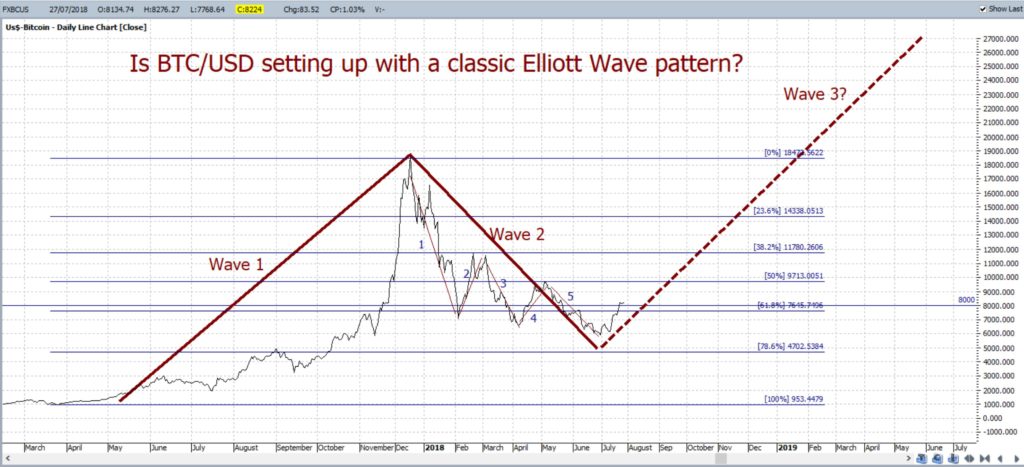
BTC/USD daily with Elliott Wave projection:: I still consider that BTC/USD could be shaping within a larger-scale Elliott Wave 5 pattern and this is significant as Wave 3, the potential next Wave for BTC/USD, is generally the longest and most powerful of the movement waves. The trend lines on the chart below have been adjusted slightly but the overall pattern remains valid for the time being:
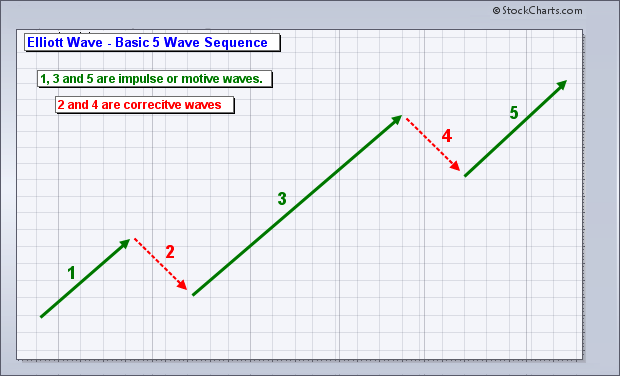
Outline of the Classic Elliott Wave Pattern:
BTC/USD daily with Fibonacci Extension targets:: Fibonacci Extension can help identify key levels that could be potential targets in any continued bullish recovery move beyond $15,000. The Fibonacci Extension levels that interest me are outlined below:
- $19,000 – 20,000: from the 100% fib of the daily chart.
- $28,000: from the 50% fib extension.
- $32,000: from the 61.8% fib extension.
- $38,000- $40,000: from the 100% fib extension.
- $50,000: from the 161.8% fib extension.
Summary: The following is a summary of the key levels in focus for any bullish recovery with BTC/USD:
- 4hr chart fib levels: the 78.6% fib, near $9,000, followed by the 100% fib, near $9,750. The whole-number $10,000 would be the obvious next S/R level to monitor after that:
- Daily chart Fib levels: the 61.8% fib, near $15,000.
- $19,000 – 20,000: from the 100% fib retracement on the daily chart.
- $28,000: from the 50% fib extension on the daily chart.
- $32,000: from the 61.8% fib extension on the daily chart.
- $38,000- $40,000: from the 100% fib extension on the daily chart.
- $50,000: from the 161.8% fib extension on the daily chart.


