The recent sell-off across stocks has many traders focused on Bonds to see if money is flowing into this safe-haven asset. In this post I consider charts of the S&P500 ETF: SPY, the Bond ETF: TLT, and the Interest rate proxy ETF: TBT as well as the VIX index. I note what these charts might be signalling to traders and, also, key levels to monitor.
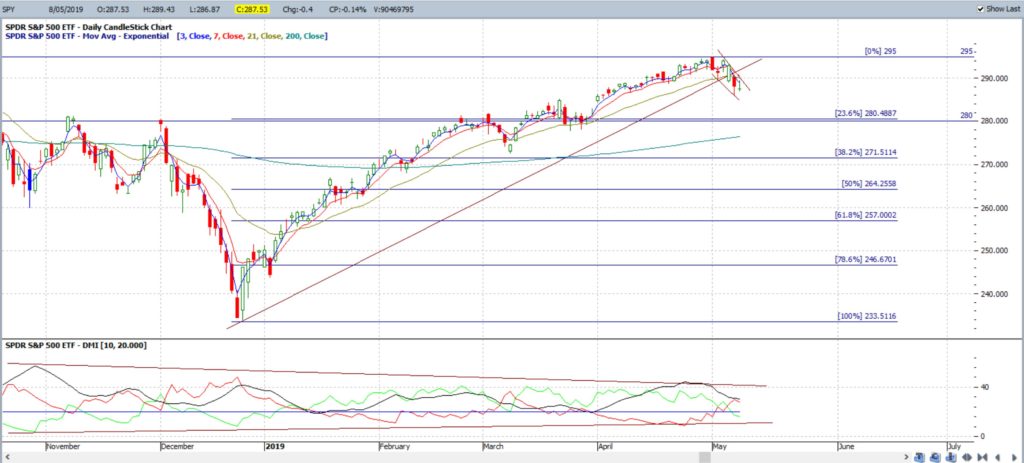
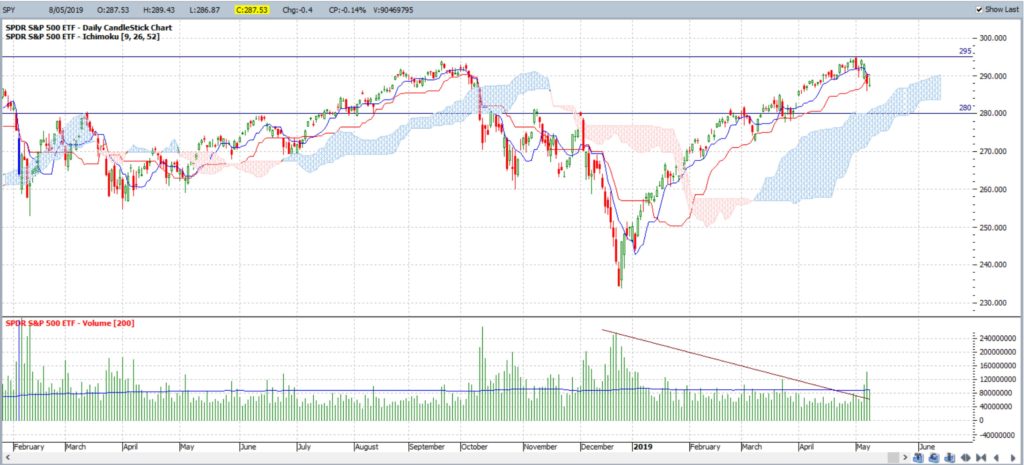
S&P500 ETF: SPY daily: the S&P500 is struggling under key resistance from the 3,000 level and the S&P500 ETF reflects this as well. Price action is shaping up in a Flag under this 295 / 300 resistance zone so traders need to monitor this chart for any new trend line breakout:
TLT: iShares Barclays 20+ Yr Treasury Bond ETF: Bonds, and bond ETFs like TLT, are considered safe haven assets and money generally flows into these assets when traders are anxious and pulling money out of stock markets in risk-off environments.
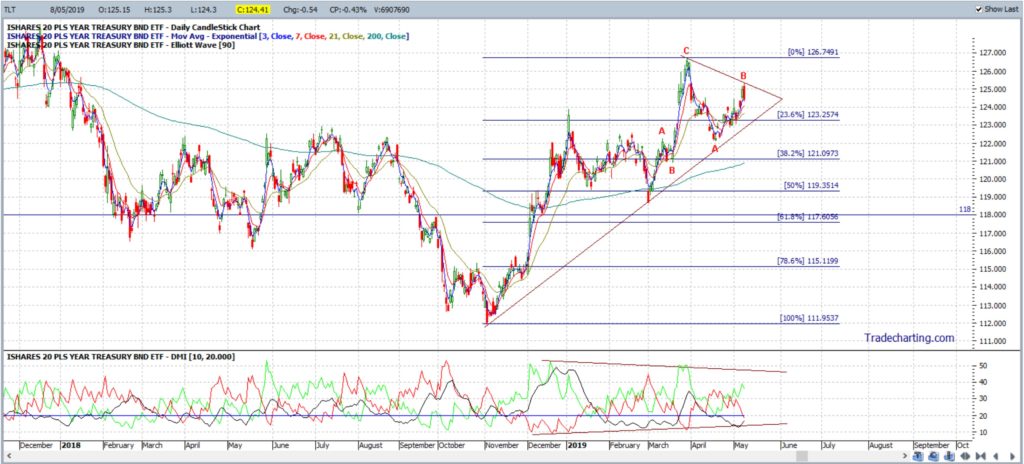
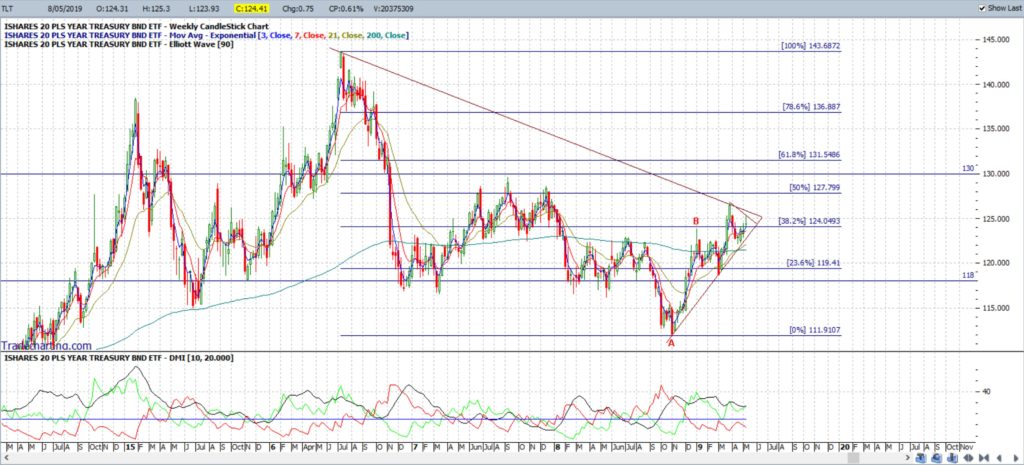
The daily chart of TLT shows current price action consolidating in a triangle or sorts:
- Any bearish breakdown would bring the 118 level into focus as this is previous S/R and is near the daily chart’s 61.8% Fibonacci level of the recent swing High. (see daily TLT chart)
- Any bullish breakout would bring a weekly chart bear trend line into focus with any weekly triangle breakout bringing 130 S/R into focus as this is near the weekly 61.8% Fibonacci level. (see weekly TLT chart)
TLT daily:
TLT weekly:
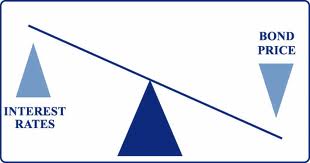
Recall that as Yields or Interest Rates rise then Bond prices would be expected to fall as per the relationship shown in this schema:
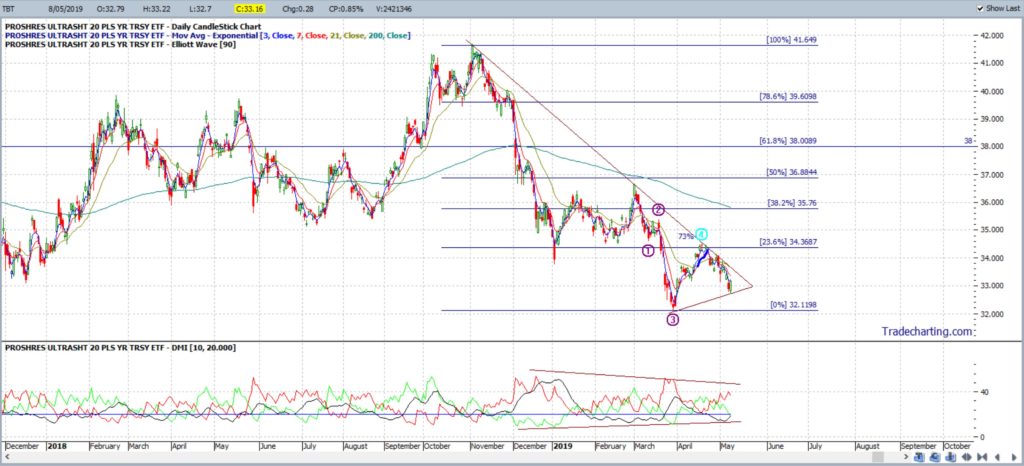
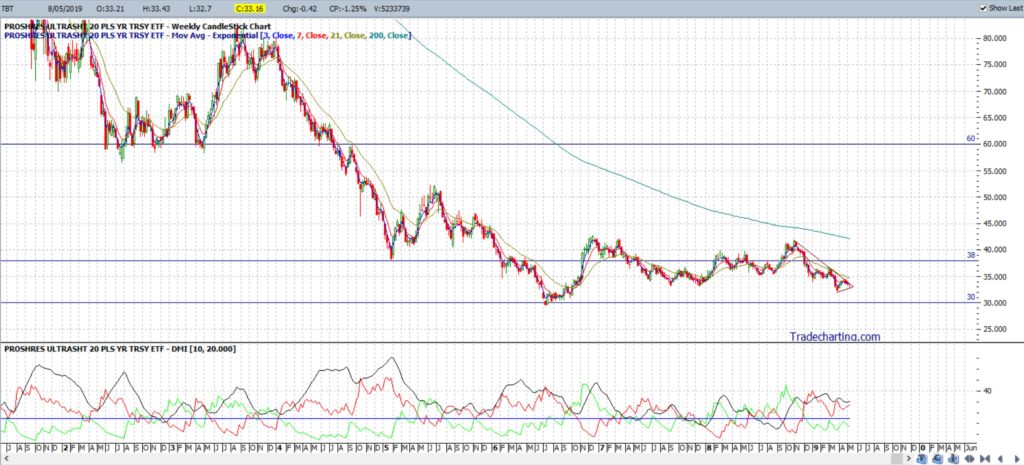
TBT: TBT is a proxy for Interest Rates as, per the schema above, this ETF provides 2x the inverse exposure to an index that tracks the performance of US Treasury securities with remaining maturities greater than 20 years. The daily chart of TBT shows price action consolidating in a triangle here too:
- Any bullish breakout would bring the 38 level into focus as this is previous S/R and is near the daily chart’s 61.8% Fibonacci level of the recent swing Low. (see daily TBT chart)
- Any bearish breakdown would bring the recent Low, circa 30, into focus. (see weekly TBT chart)
TBT daily:
TBT weekly:
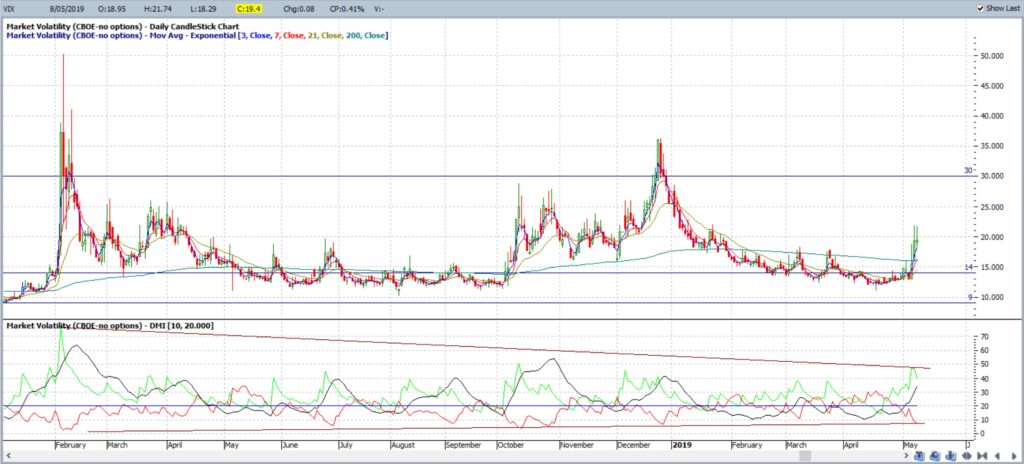
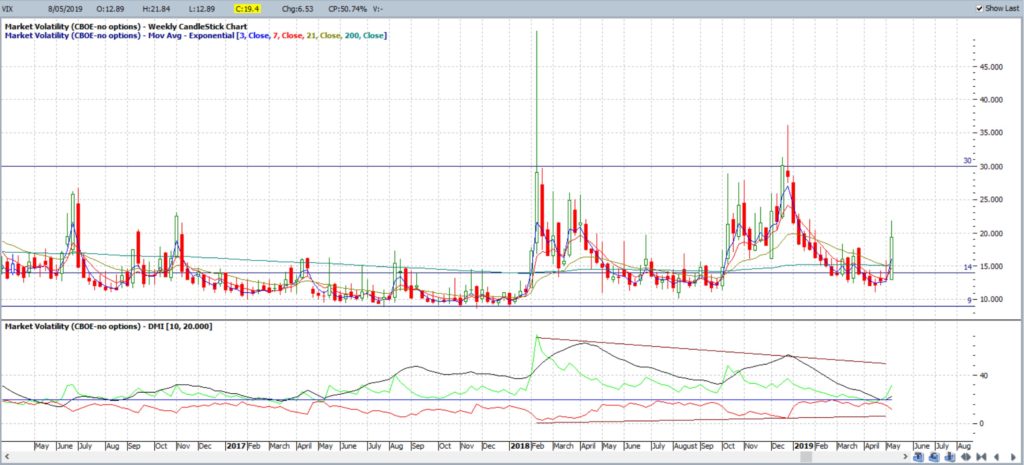
VIX: the Volatility, or Fear, index is still below 30 for now but has edged up above 14. Watch to see how the weekly candle closes:
VIX daily:
VIX weekly:
Summary: Whilst there is heightened interest in the Bond market with this recent stock market stall there isn’t too much that can be read into the charts just yet. The S&P500 ETF, SPY, bond ETF, TLT and rates ETF proxy, TBT, all show consolidation-style price action: SPY withing a Flag and TBT and TLT within triangle patterns. Traders would be best advised to wait for any momentum-based trend line breakout before being confident with any new directional move.


