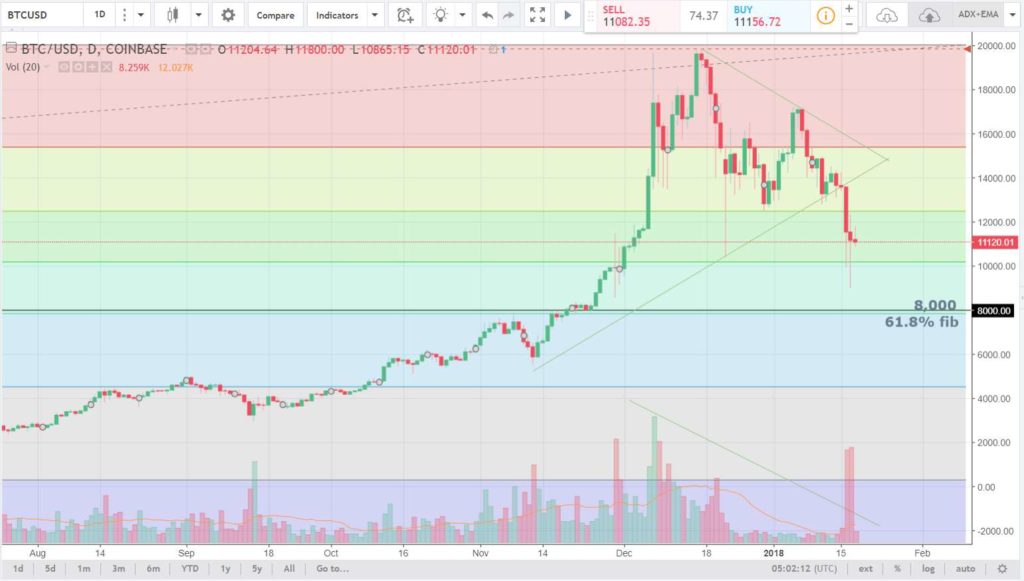
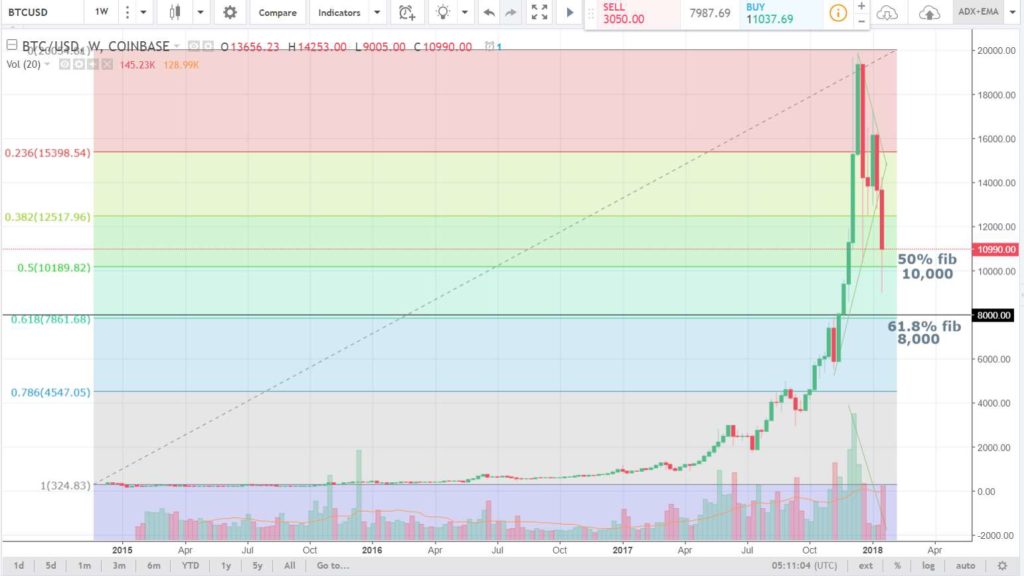
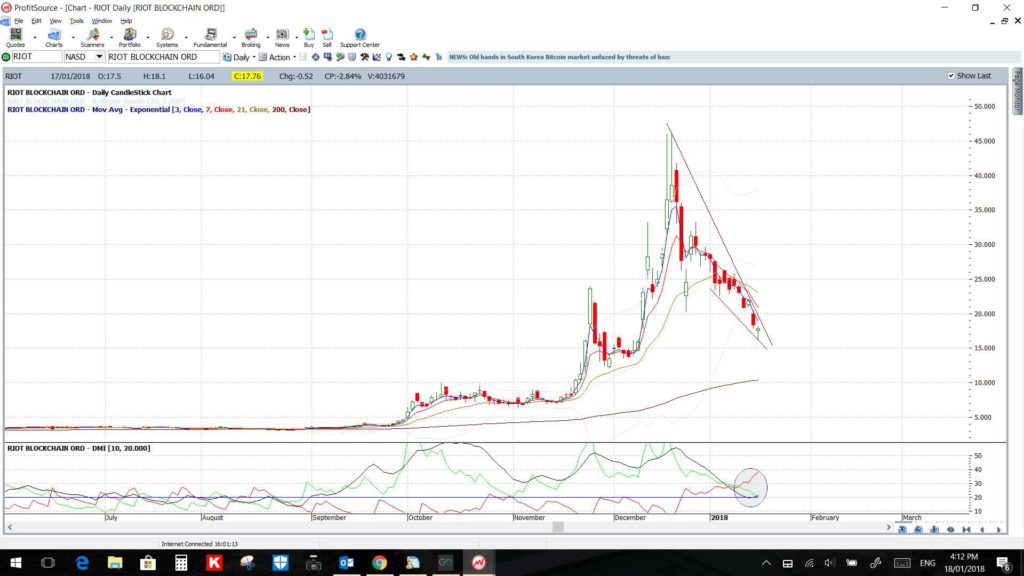
Bitcoin is currently down near the 50% fib retracement of the weekly chart’s swing-high move; circa 10,000. Price might slow as it navigates this psychological whole-number support level but I’m still watching for any test and hold above the 61.8% fib which is down near 8,000. RIOT is one stock that can be used as a proxy Bitcoin trade and it carved out a basing style daily candle on Wednesday so watch trend lines for any recovery effort here.
BTC/USD daily: still looking bearish but watch for any basing-style activity at the 50% fib near 10,000 or, a bit lower down, at the 61.8% fib near 8,000:
BTC/USD weekly: watch the major Fib levels for any basing-style activity:
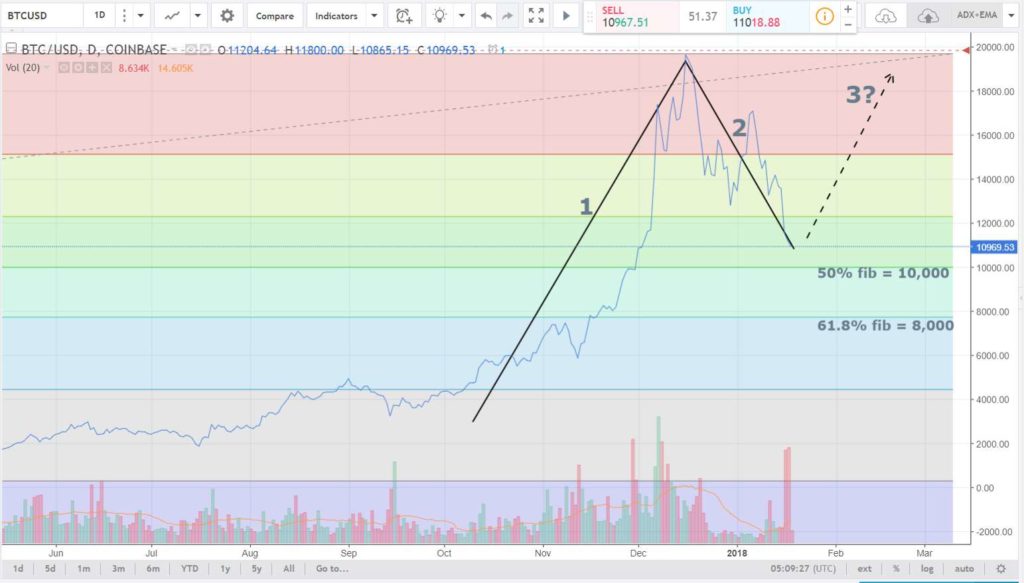
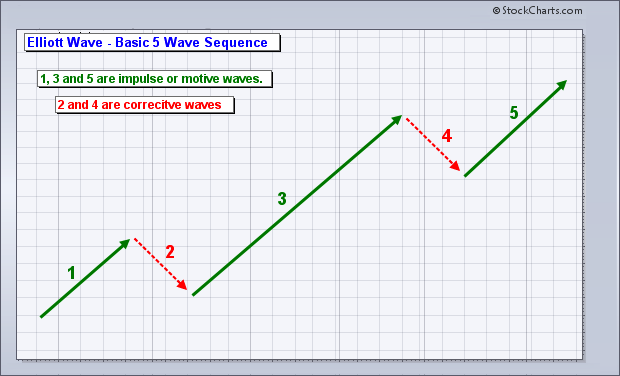
BTC/USD daily and Elliott Wave: any test and hold above either of these two major levels would be a very noteworthy technical achievement. I would then be looking to see if this goes on to conform to Elliott Wave style movement and embark on a Wave 3 move. Wave 3 moves are generally the biggest and highest momentum moves in the pattern and so this would be well worth watching for on Bitcoin!
Elliott Wave: this schema shows the 5 wave pattern for Elliott Wave moves and you can see that Wave 3 is the biggest of these moves:
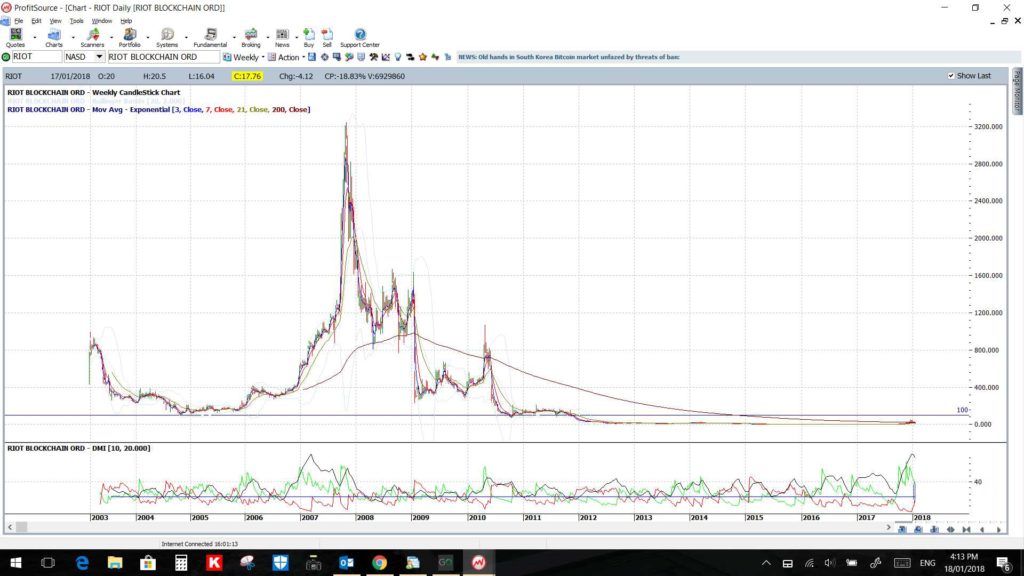
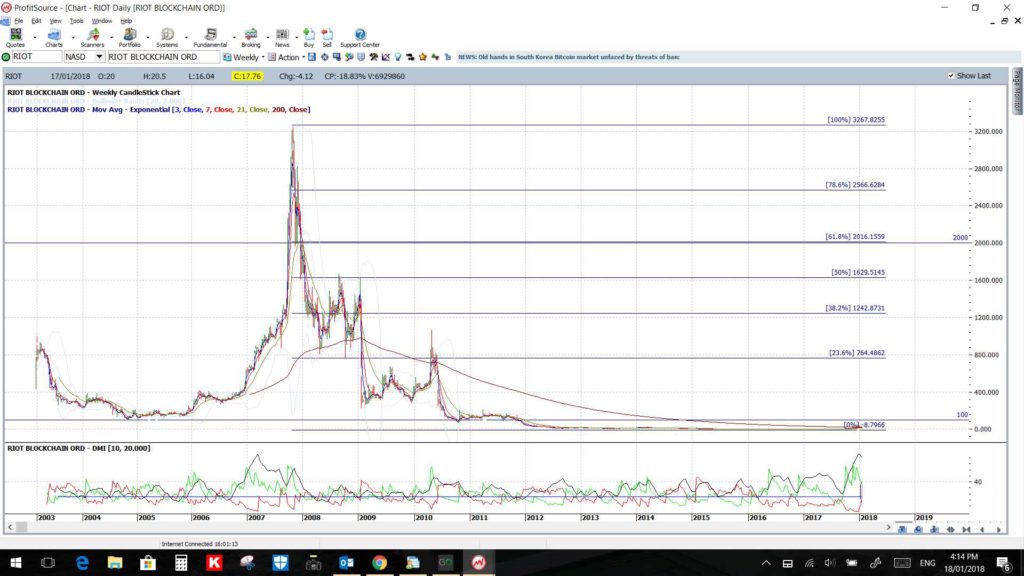
Proxy trade for Bitcoin: RIOT: Riot is just one proxy stock trade for cryptocurrencies and the charts for this stock are shown below. RIOT has history at much higher levels making for an easier pathway if there is to be any recovery attempt.
Riot daily: RIOT carved out a reversal style candle on Wednesday so watch the trend lines for any new breakout. Note that this is currently bearish but trading within a bullish-reversal descending wedge:
RIOT weekly: this has history at much higher levels:
RIOT weekly + Fibs: note that the 61.8% fib is up near the $2,000 level:


