I have been urging my followers to watch for any bullish uptick with $BTCUSD given the descending wedge pattern that has been developing on the daily chart for the last 14 months. Such patterns are highly predictive off bullish-reversal price action and, hence, the interest. There was a recent but tepid breakout, with some some further basing-style action, but not too much until a rather bullish trading session on Friday. This begs the obvious question of whether Bitcoin, and the entire crypto space, waking up from their slumber? This post offers updated charts of BTC/USD following my recent article published in the December issue of Your Trading Edge noting key levels to monitor for any bullish recovery activity.
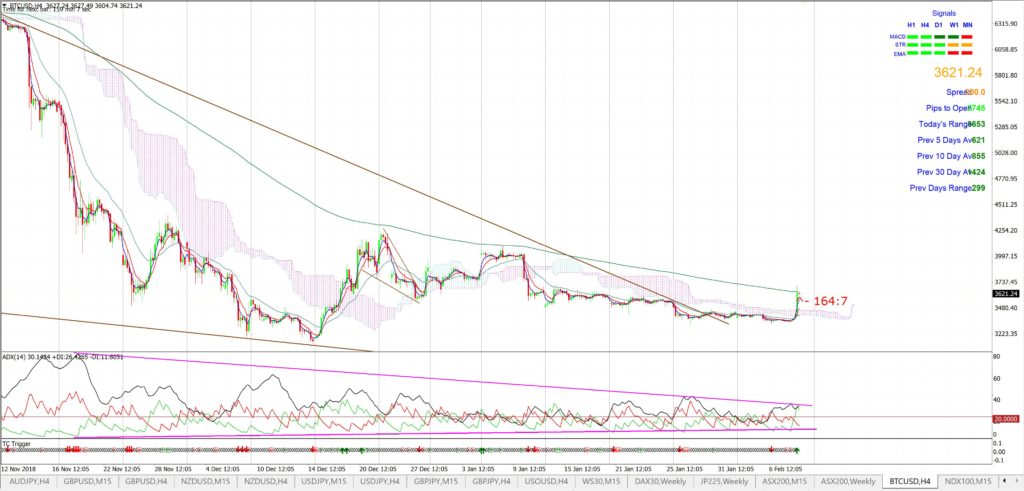
BTC/USD 4hr from Thursday 7th Feb: Price action drifted above the upper trend line two weeks ago but this was rather tame price action. Price action remained below the 4hr Cloud, however, and so this was the obvious resistance zone to watch as noted in my recent post. I often find that price action continues to chop sideways in a basing-style action following descending wedge breakouts before any potential bullish uptick and such basing-style action has been evident on BTC/USD for the last two weeks:
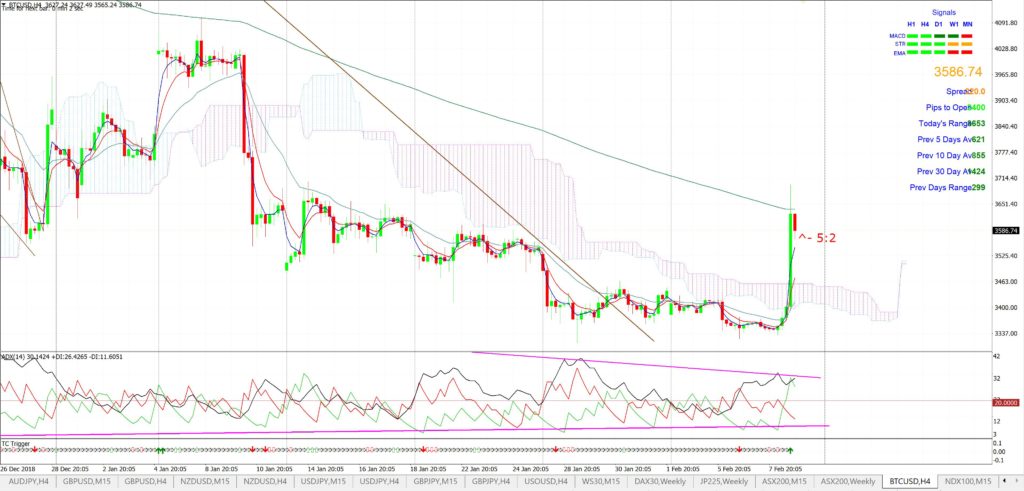
BTC/USD 4hr: Price action on Friday made a bullish breakout above the 4hr Cloud though and so I’ll now be watching for any follow-through.
BTC/USD 4hr: The 4hr 200 EMA is the obvious level to watch for any new make or break activity.
BTC/USD 4hr: Any bullish breakout above the 4hr 200 EMA would bring recent S/R levels of 4,000 and 4,300 into focus:
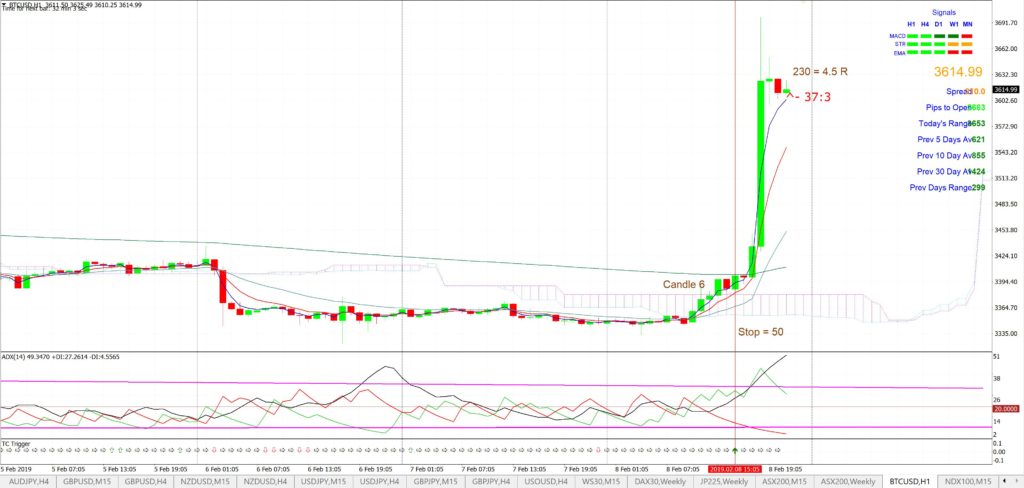
BTC/USD 60 min: Friday’s price action did not trigger any valid TC signal on the 15 min chart. The signal on the 60 min chart was one candle too late as well but maybe some latitude with this candle count rule would have been worthwhile!
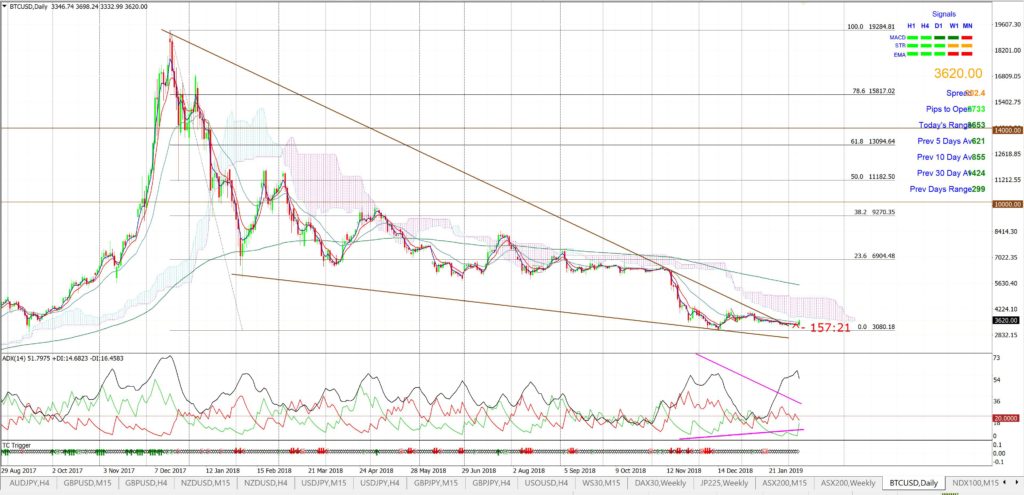
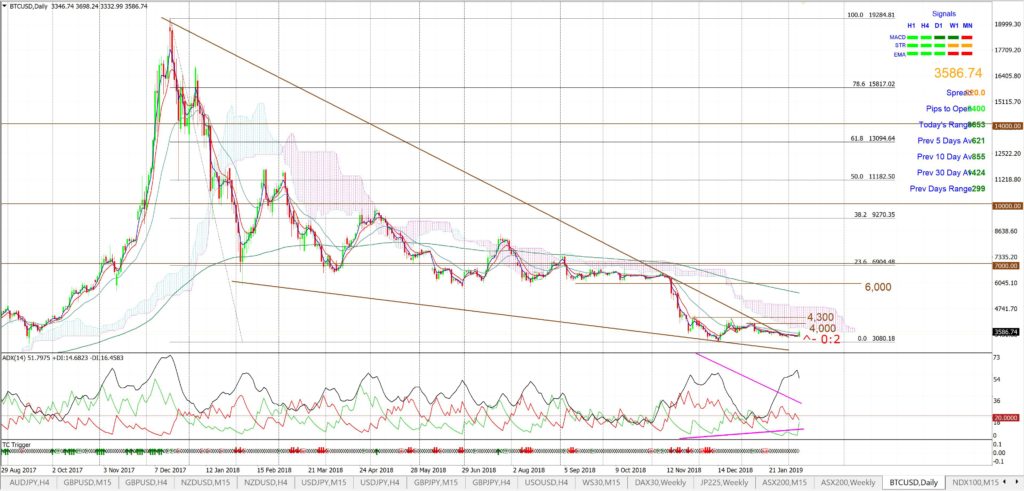
BTC/USD daily: The daily chart shows the broader perspective here given the enormous pullback since the 2017 Highs. There has now been a bullish-reversal descending wedge breakout so traders would be wise to to be open-minded about any potential for bullish follow-through. The next obvious resistance zone comes from a broad band of daily Ichimoku Cloud above current price:
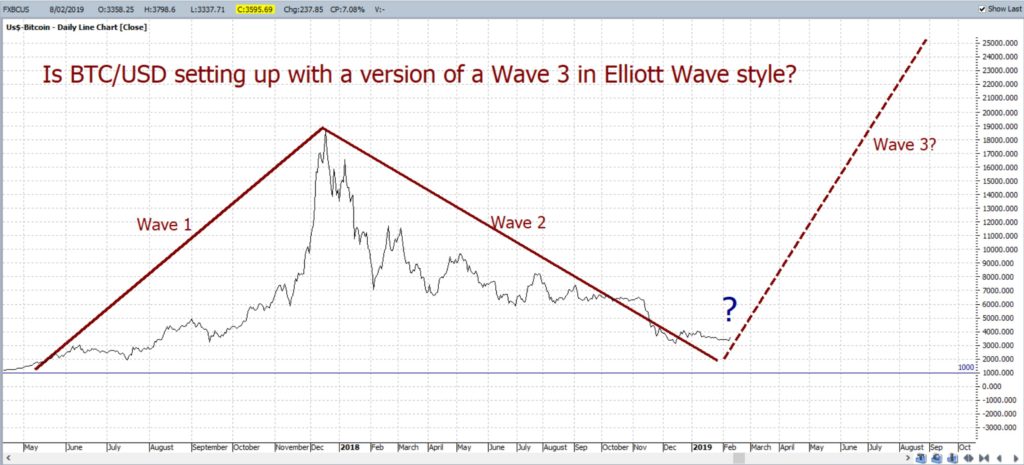
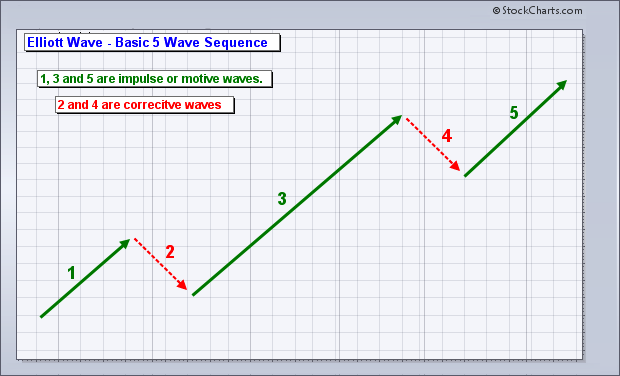
BTC/USD daily Elliott Wave: I am still wondering whether BTC/USD could be shaping within a larger-scale Elliott Wave pattern and this is significant as Wave 3, the potential next Wave for BTC/USD, is generally the longest and most powerful of the movement waves. The trend lines on the chart below have been adjusted slightly but the overall pattern remains valid for the time being:
Elliott Wave: As noted above, I’m still mapping price action to see if BTC/USD conforms to any type of Elliott Wave pattern. Watch out for any Wave 3 movement though as these are usually the longest and most powerful move!
BTC/USD Targets: Any recovery above the 4hr 200 EMA would bring all whole-number levels and the following S/R levels into focus (see daily chart below):
- $4,000
- $4,300
- $6,000
- $7,000
- $10,000
- $14,000
- $20,000: circa previous High.
Any bullish breakout and continuation beyond the $20,000 region would bring the following levels into focus as potential targets for Bitcoin price action (see levels on the chart below):
- The 50% Fibonacci extension: near $28,000.
- The 61.8% Fibonacci extension: near $30,500.
- The 100% Fibonacci extension: near $38,000 – $40,000.
- The 161.8% Fibonacci extension: near $50,000.
Summary:
I make no prediction about the next move for Bitcoin but watch, with interest, to see how price action evolves following the breakout from this recent descending wedge. Throughout this article I have identified key levels to monitor on Bitcoin, in case of any continued recovery, and these are summarised below:
- $4,000
- 4,,300
- $6,000
- $10,000
- $14,000
- $19,000 – 20,000: the previous High and 100% fib retracement on the daily chart’s 2017-2018 swing Low move.
- $28,000: the 50% Fibonacci Extension on the daily chart.
- $30,500: the 61.8% Fibonacci Extension on the daily chart.
- $38,000- $40,000: from the 100% Fibonacci Extension on the daily chart.
- $50,000: from the 161.8% Fibonacci Extension on the daily chart.
Disclaimer: I hold no position in Bitcoin or any cryptocurrency.


