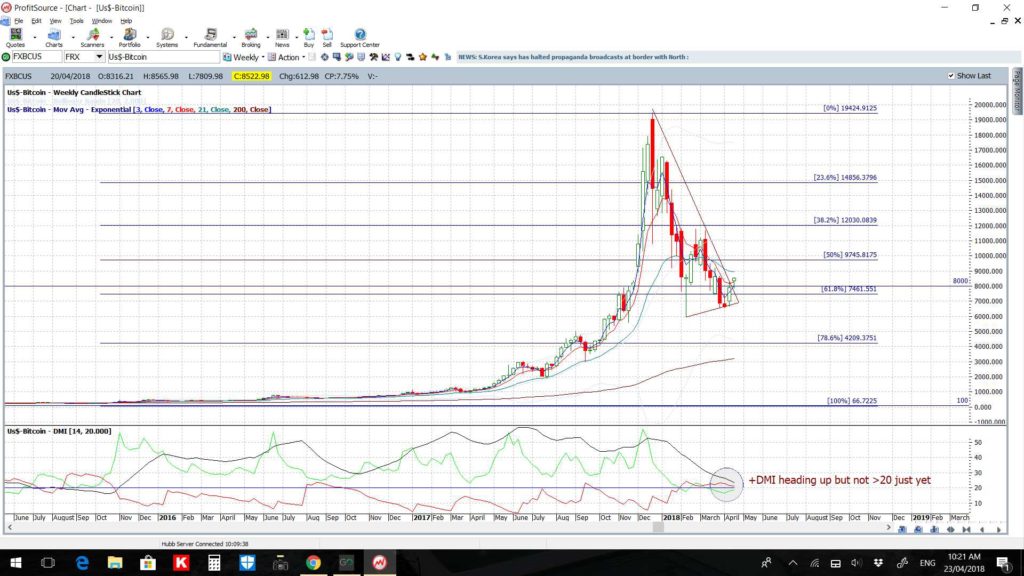
Those of you who have followed my reviews for some time will know that the key support level I’ve had in mind for Bitcoin is near the whole-number $8,000 level. This is because this is near the long term chart’s retracement level of 61.8%; a key Fibonacci level or rather, a level where the herd often tends to gather. Bitcoin Bulls and Bears have been fighting it out at this level for some weeks now with +/- swings of $2,000 either side of this key $8,000 level. Bullish momentum is starting to tick upwards though so I thought it timely to remind traders about key S/R levels to watch with this cryptocurrency.
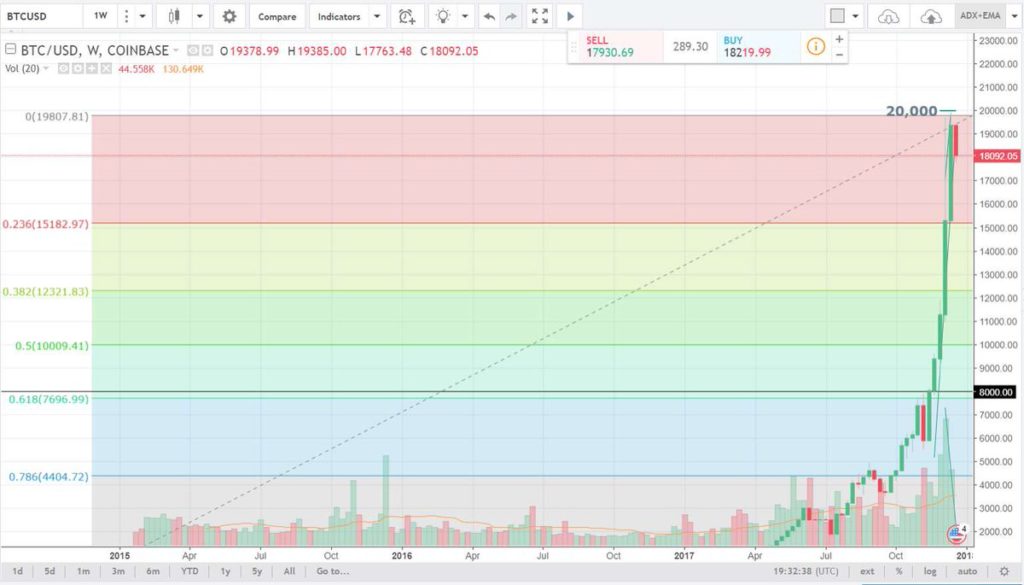
BTC/USD weekly: Bitcoin reached up to near the psychological whole-number $20,000 before the rally stalled. Trends do not travel in straight lines for ever so, with hindsight of course, it’s no surprise price action decided to takes its pause at this huge S/R level. As soon as that large bullish engulfing reversal candle formed I had the $8,000 level in my sights and my previous Tweets and posts can testify to that.
The BTC/USD weekly chart image from my Tweet of Dec 20th 2017, re-printed below shows the $8,000 level marked in as a major level of interest following this peak near $20,000. This $8,000 level stood out because it was the whole-number level near the 61.8% Fibonacci retracement level. This means that the $8,000 level was back down by an order of magnitude of 61.8% from its peak when compared to where the move started. Why the interest in the 61.8% Fibonacci level? It is simply because many traders place value on this charting tool and this particular level and it, therefore, gathers significance due to ”herd mentality’ behaviour. I have written a separate article about Fibonacci and this behaviour that can be found freely through this link. It comes of no surprise to me therefore that this $8,000 level is where Bitcoin headed to and where Bulls and Bears have been fighting it out over recent weeks.
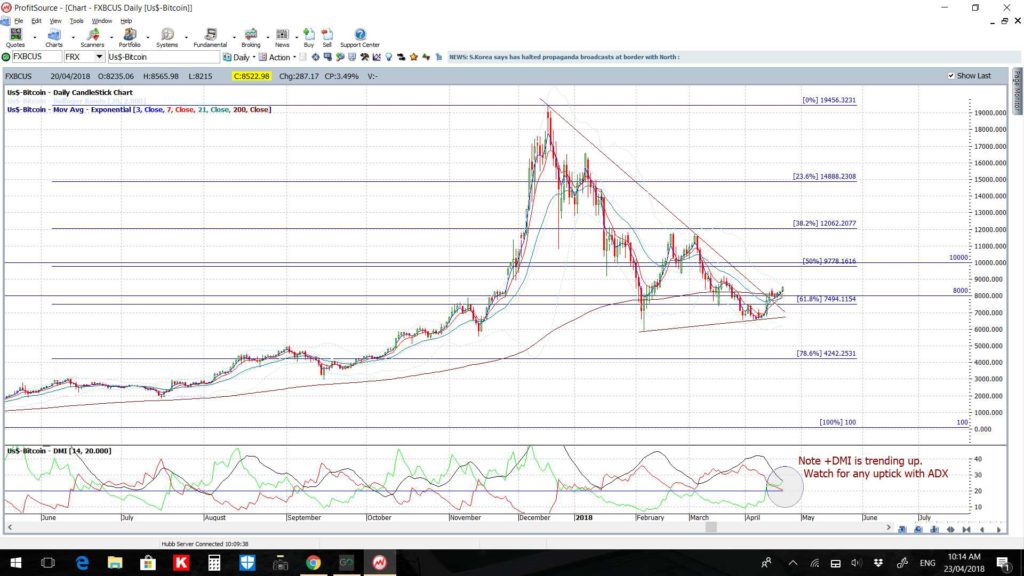
Bitcoin daily: Price action is currently above $8,000 and there is obviously no guarantee that it will stay above this S/R region. However, I am always on the lookout for clues about any potential next move and some clues are starting to shape up on the daily chart. I note that the bullish +DMI indicator is trading above the 20 level and edging higher so I will be on the lookout for any uptick with the ADX on this time frame. Any failure to hold above $8,000 would bring the recent low, near $6,000, back into focus:
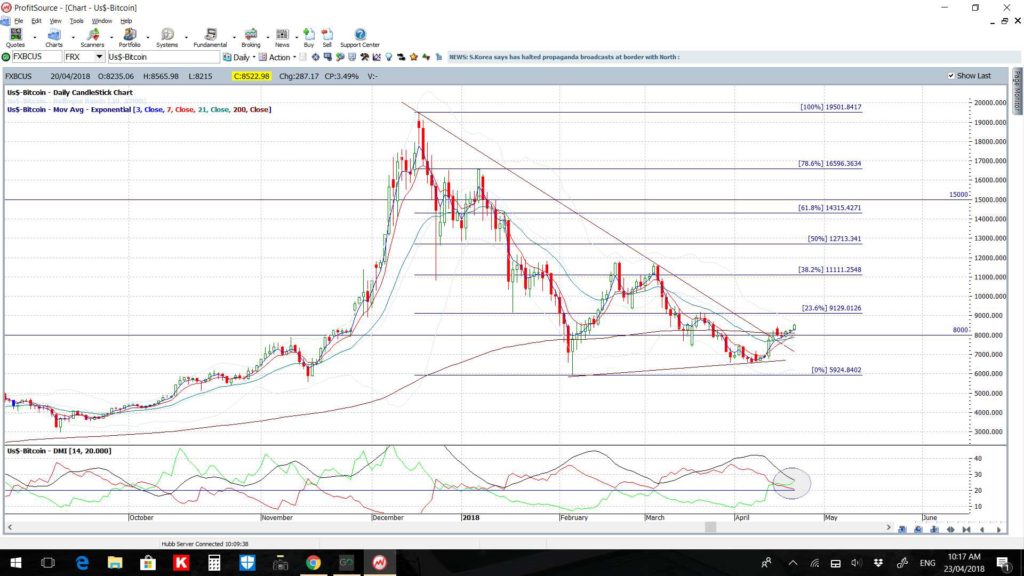
Bitcoin daily: forecast levels: So where to next for Bitcoin if this $8,000 level does hold? Any hold above $8,000 will be very significant as it would suggest that this currency pair is conforming to broadly accepted and understood technical trading norms. This would be a huge step toward carving out trading credibility for the currency; a currency that is often mocked as a ‘bubble’ and or a ‘con’ etc. To work out any potential bullish targets I have taken the Fibonacci tool and placed it on the last move lower, or what we call the swing low move. This move was from near $20,000 down to near $6,000. This tool then allows traders to read off percentage gain levels from this recent low, or base, near $6,000. The Fibonacci tool shows that a 61.8% recovery off the $6,000 low would put price up near $15,000. Thus, if price continues to hold, and even rally up from its current levels, then herd mentality would suggest you keep that level in mind as a potential target. The 50% fib is near $13,000 so that would be another target to spy along the way:
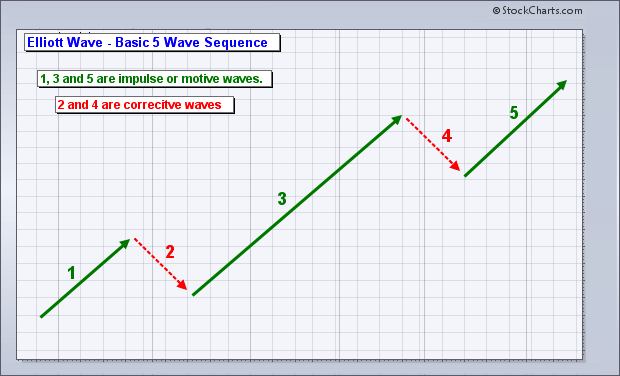
Elliot Wave: as I have previously reported, Elliott Wave Theory, in very simple terms, states that all market action follows a repetitive rhythm in the direction of the main trend in a series of five waves. The upward or advancing waves are 1,3 and 5 and the corrective moves occur in waves 2 and 3. This is really just another simple way of saying that trends do not travel in straight lines forever, something I mention often! The important feature to note here though is that Wave 3 is generally the strongest wave:
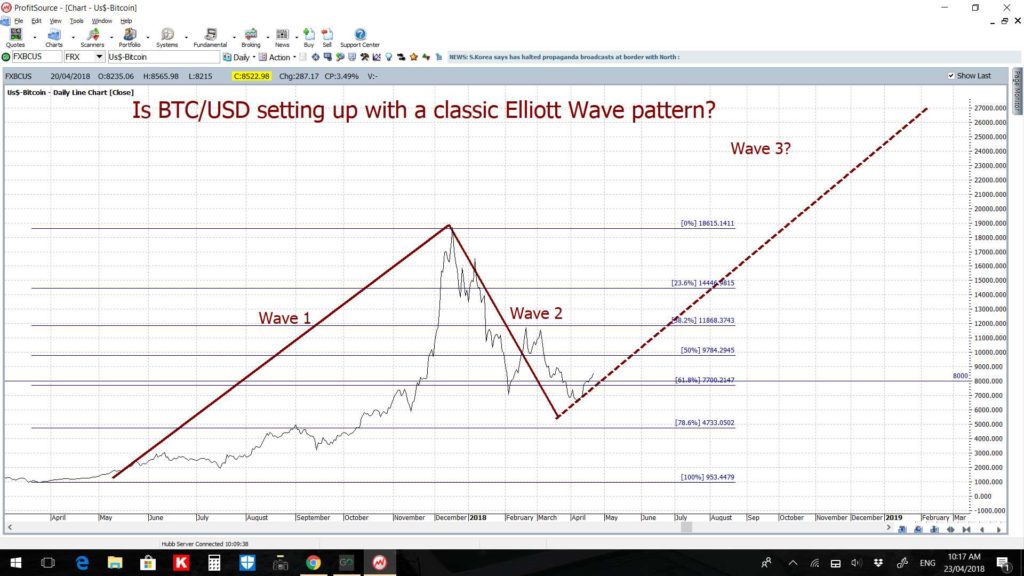
BTC/USD daily and Elliott Wave: I have been keeping track of Bitcoin’s progress or otherwise here and, apart from a slight trend line adjustment, I am still seeing potential for Bitcoin to be conforming to a classic-style Elliott Wave pattern where it has completed Wave 1 and Wave 2 and is trying to carve out a base to start a Wave 3 move. If Bitcoin conforms to this technical trading pattern then this will suggest huge gains are in order for the crypto. Have a look at my Elliott Wave pattern overlay and let me know what you think!
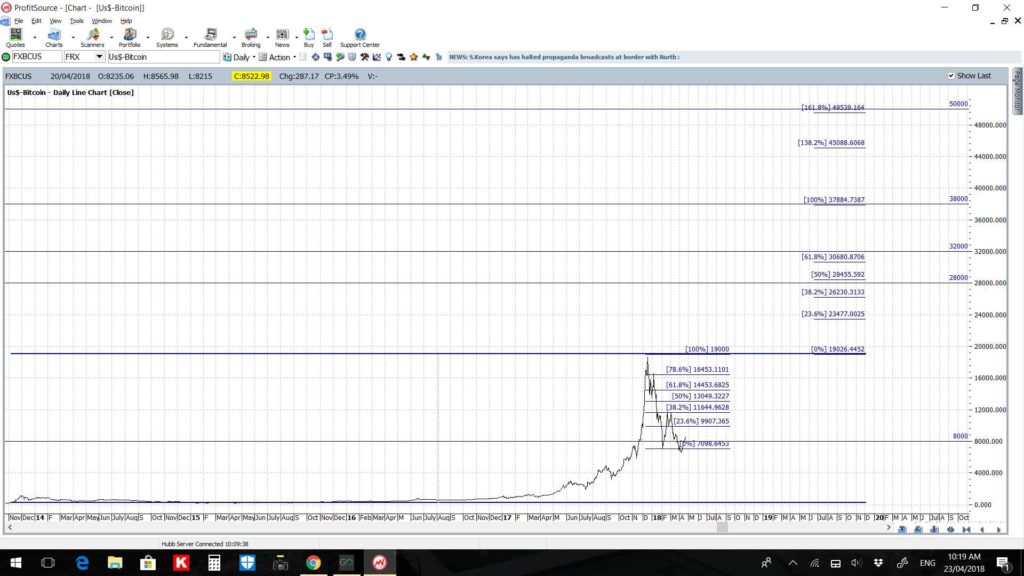
BTC/USD targets for any bullish continuation: I make no predictions about where price action for Bitcoin is going. I simply watch price action and overlay technical trading tools and theory to help identify key levels that could be potential targets. In the same way that Fibonacci retracement helped me to identify $8,000 as potential key support, Fibonacci extension tools can help to identify potential targets for any bullish continuation. The Fibonacci levels that interest me are outlined below:
- $13,000: from the 50% fib retracement on the daily chart (noted above)
- $15,000: from the 61.8% fib retracement on the daily chart (noted above)
- $19,000 – 20,000: from the 100% fib retracement on the daily chart (below)
- $28,000: from the 50% fib extension on the daily chart (below)
- $32,000: from the 61.8% fib extension on the daily chart (below)
- $38,000- $40,000: from the 100% fib extension on the daily chart (below)
- $50,000: from the 161.8% fib extension on the daily chart (below)
Summary: I am on record as identifying $8,000, back in Dec 2017, as a potential pullback target on Bitcoin with the help of technical analysis and, in particular, Fibonacci analysis. Since then, price did indeed pullback to hover around this major S/R region of $8,000 and has chopped either side of there for some weeks. The cryptocurrency is currently trading north of this level and, whilst there is no guarantee it will stay there, there are some technical clues suggesting that a bullish bias is brewing. In this post I have identified key levels to monitor on Bitcoin and these include:
Bearish Target:
- $6,000 as the recent Low printed in February of this year.
Bullish targets:
- $13,000: from the 50% fib retracement on the daily chart (noted above)
- $15,000: from the 61.8% fib retracement on the daily chart (noted above)
- $19,000 – 20,000: from the 100% fib retracement on the daily chart
- $28,000: from the 50% fib extension on the daily chart (below)
- $32,000: from the 61.8% fib extension on the daily chart (below)
- $38,000- $40,000: from the 100% fib extension on the daily chart (below)
- $50,000: from the 161.8% fib extension on the daily chart (below)


