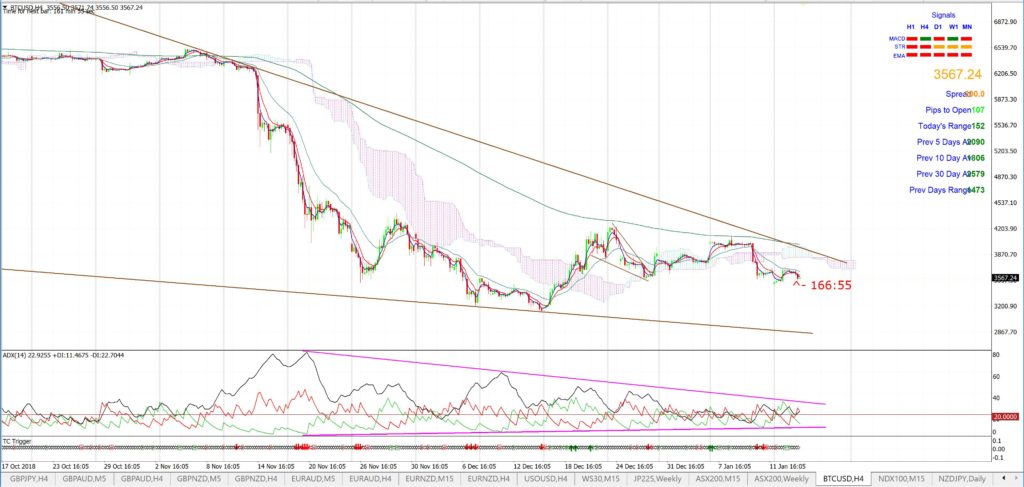
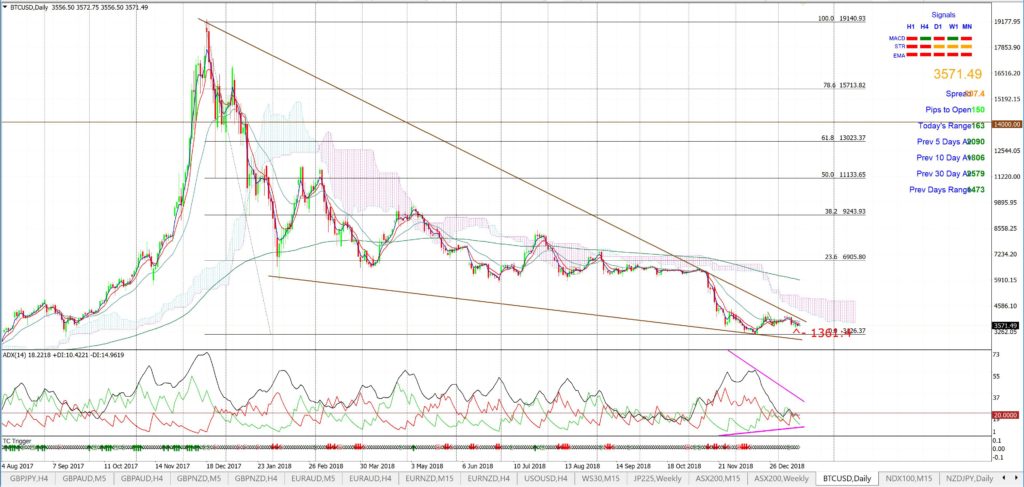
Bitcoin remains in focus as momentum and price action both decline within a descending wedge. The thought being that potential for a momentum breakout continues building within this, more often than not, bullish-reversal technical pattern. Traders should watch for any momentum-based trend line breakout.
BTC/USD 4hr: note the declining momentum here so watch for any ADX uptick with a trend line breakout. Note, also, how the upper trend line now aligns with the 4hr Ichimoku Cloud; confluence!
BTC/USD daily: this descending wedge has been building for 14 months now so the breakout, if and when it comes, could be quite volatile:
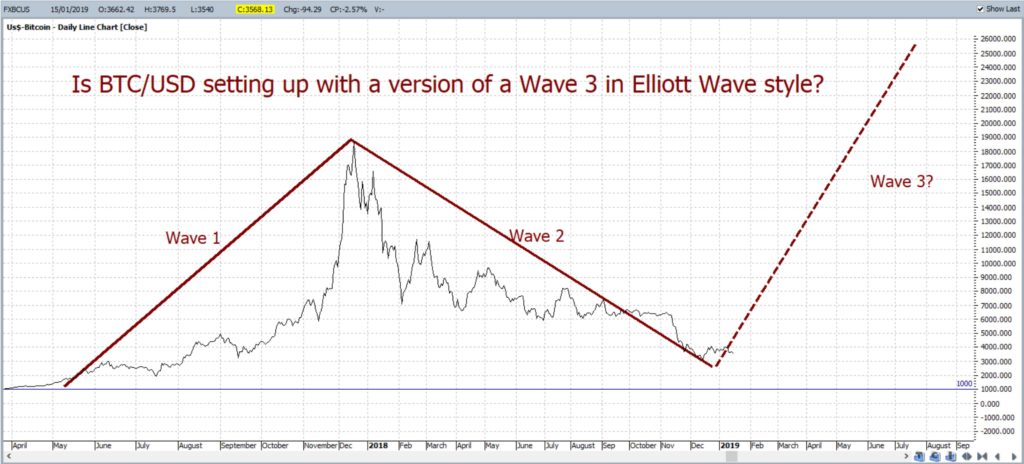
BTC/USD daily Elliott Wave: I am still wondering whether BTC/USD could be shaping within a larger-scale Elliott Wave pattern and this is significant as Wave 3, the potential next Wave for BTC/USD, is generally the longest and most powerful of the movement waves. The trend lines on the chart below have been adjusted slightly but the overall pattern remains valid for the time being:


