There have been two features I’ve been waiting to see form on the Bitcoin chart in order for the crypto-space to garner some technical analysis credibility and one of these has finally been achieved. That is, a test of the key $8,000 level and a weekly candle close above this level. The next feature is to see whether this $8,000 level can hold and so I will be watching the chart over coming sessions to see if this basing-style activity can be achieved.
This post follows on from one I wrote about Bitcoin a couple of weeks ago that is available through this link and back then I was looking out for any potential test of the key $8,000 level. Well, we’ve finally had that test and weekly candle close above the key level but it is what happens to the currency from here that I think will help to define the whole cryptocurrency space.
I remain interested in cryptos whilst fully aware that debate ranges from claims this is nothing more than a Ponzi scheme or akin to the Tulip mania to one where this is a legitimate and long-awaited disruption to traditional banking systems. I make no forecast here at all but still consider the Utility function of Blockchain might help to, ultimately, give credibility to all crypto-currencies. I listened to a great podcast during the week on this very topic and I highly recommend traders who are interested in cryptos to take a listen as well. The podcast was Episode 176 Investing In Cryptoassets with Jack Tatar on Futures Radio Show. I also note with much interest that the Reddit co-founder, Alexis Ohanian, has announced he is stepping down from day to day duties at the website to focus on Blockchain-related investment opportunities.
Technical Analysis of BTC/USD:
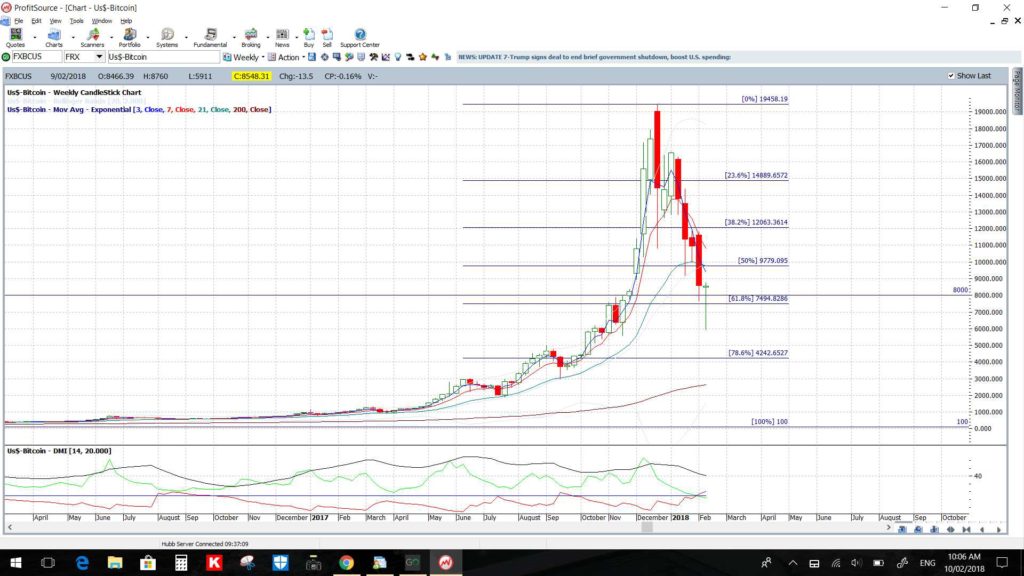
I have been at trading and investment meetings recently where people have stood and claimed, with a high degree of confidence, that cryptocurrencies are not legitimate trading vehicles because they do not conform to technical analysis. I beg to differ here! I am a keen enthusiast of Fibonacci as I find it to be a great register of the herd mentality that is operating on particular trading vehicles and at particular times. I have a separate page on my site where I chart Fibonacci related charts. I have been applying Fibonacci to the BTC/USD currency pair for some time now and noting that the 61.8% fib level, a very popular level, is down near the whole-number $8,000 level. Thus, I have been long waiting for any test and hold of that region which has finally be achieved in the last week:
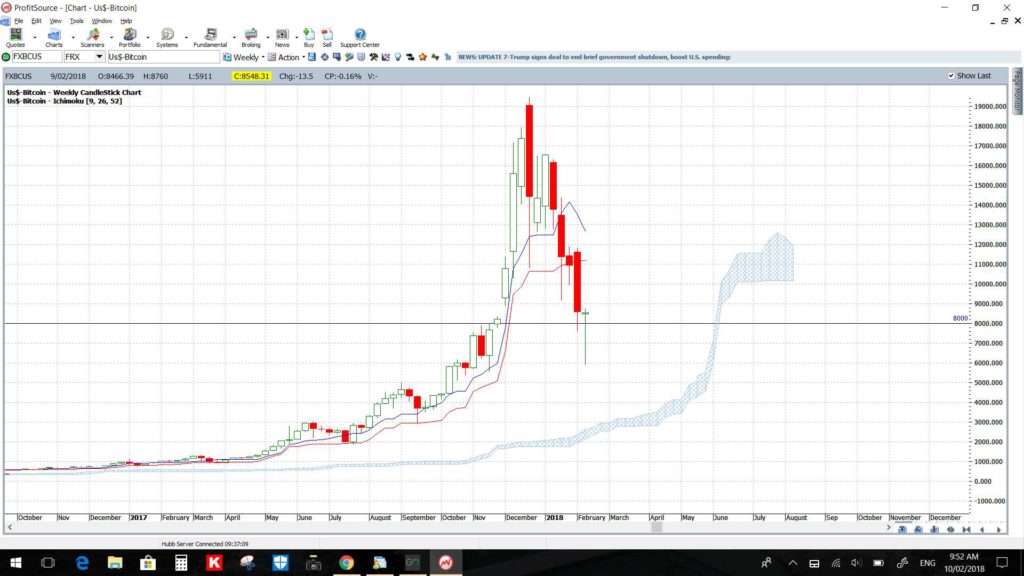
BTC/USD weekly: the weekly candle has held above the key 61.8% fib near $8,000. Price action is also above the weekly Ichimoku Cloud, another type of support zone:
There is another technical feature on the weekly chart that has formed up this week and this is a bullish-reversal Hammer candle which only goes to add confluence to this hold above the key 61.8% Fibonacci and $8,000 whole-number level:
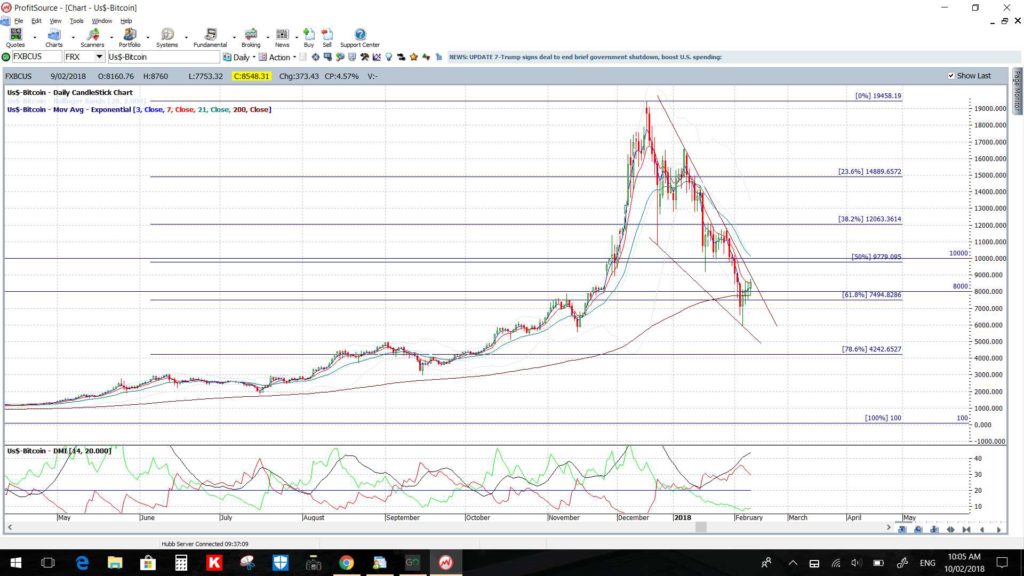
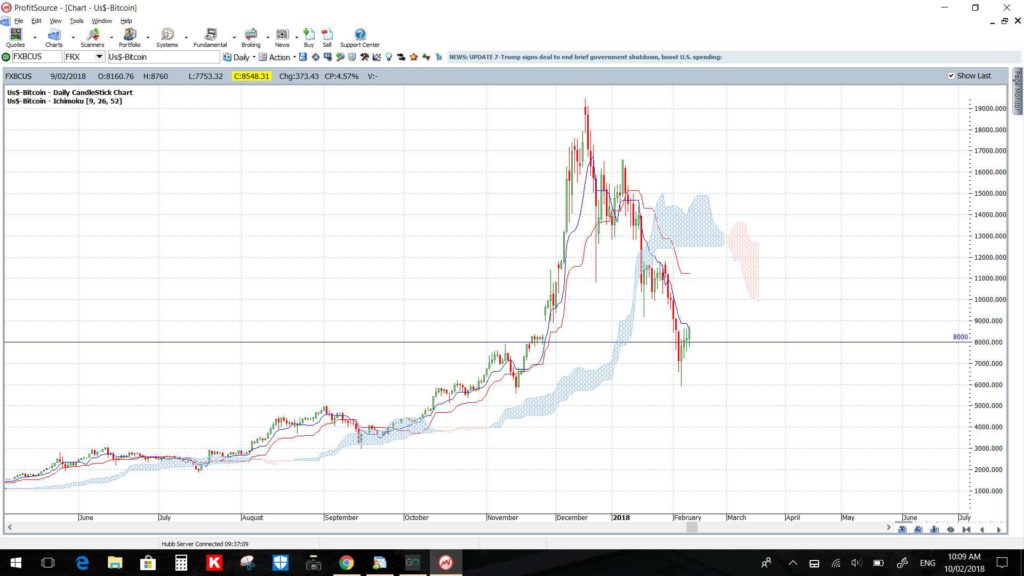
BTC/USD daily: the daily chart is offering us Flag-style trend lines to watch for any new make or break. Price action is below the daily Cloud though so any recover effort may not be smooth trading:
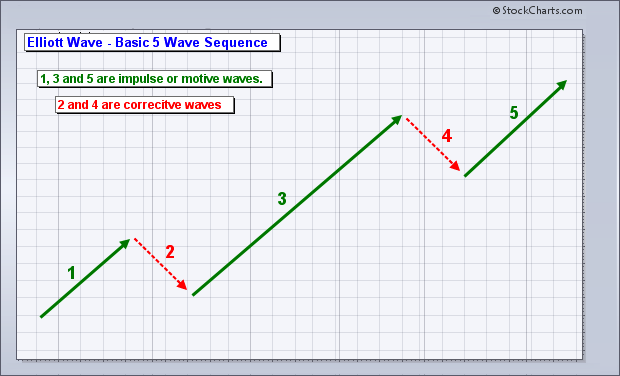
Elliott Wave: Elliott Wave Theory, in very simple terms, states that all market action follow a repetitive rhythm in the direction of the main trend in a series of five waves. The upward or advancing waves are 1,3 and 5 and the corrective moves occur in waves 2 and 3. This is really just another simple way of saying that trends do not travel in straight lines forever, something I mention often! The important feature to note here though is that Wave 3 is generally the strongest wave:
I am on the lookout to see whether BTC/USD is setting up to conform to just such a technical pattern and about to embark on a Wave 3 move. If so, this would suggest a rather bullish run could be ahead for the currency:
Summary: Bitcoin has tested the key 61.8% Fibonacci retracement level but managed to close the week above this and the whole-number $8,000 level. In doing so, BTC/USD also printed a bullish-reversal Hammer candle helping the currency to achieve two significant charting features thereby conferring some technical credibility. I will be watching to see if the currency can hold above the key $8,000 level and whether any Elliott Wave 3 behaviour develops from this point on.
Disclosure: I have been dabbling in this space by trading RIOT.


