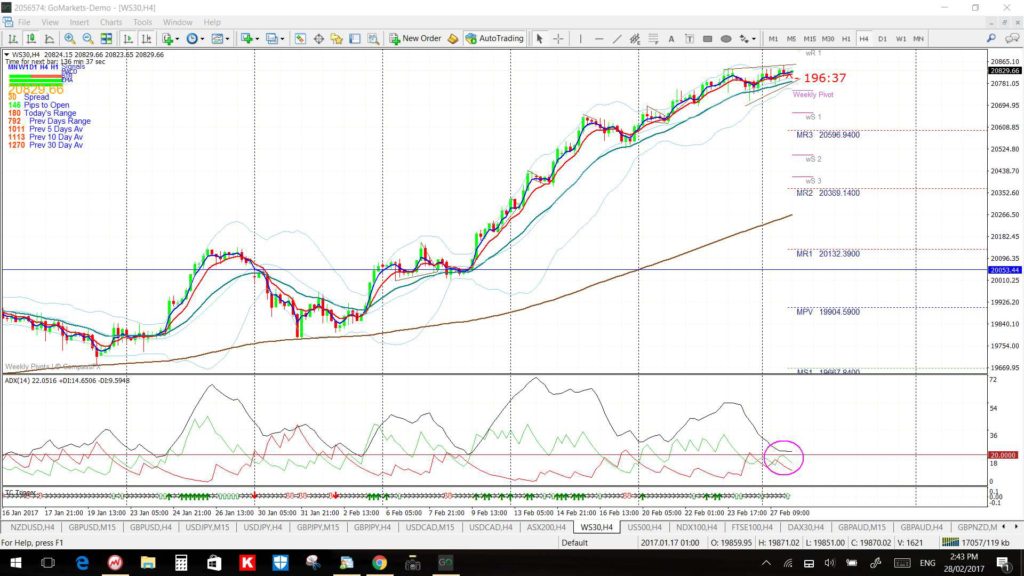
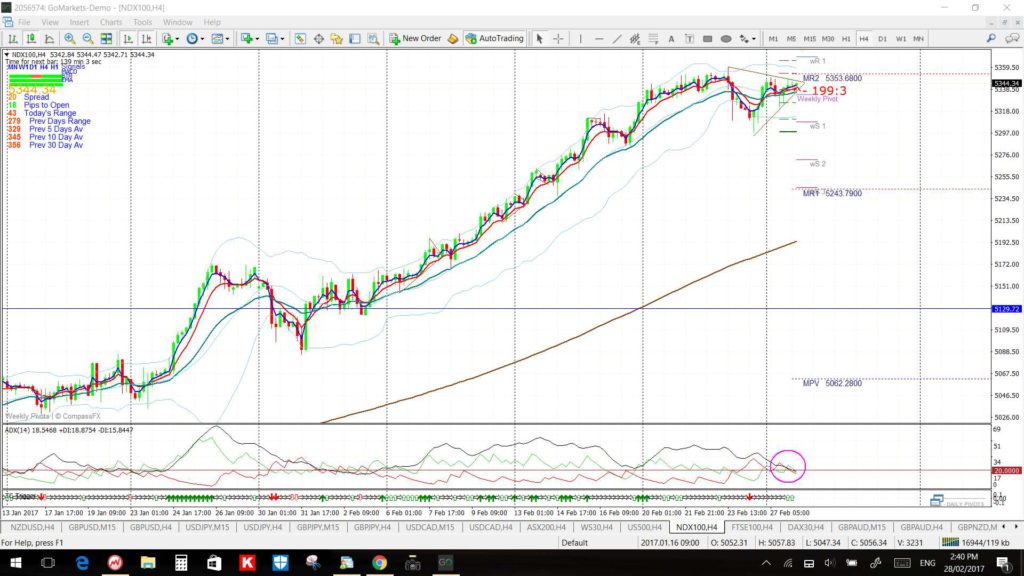
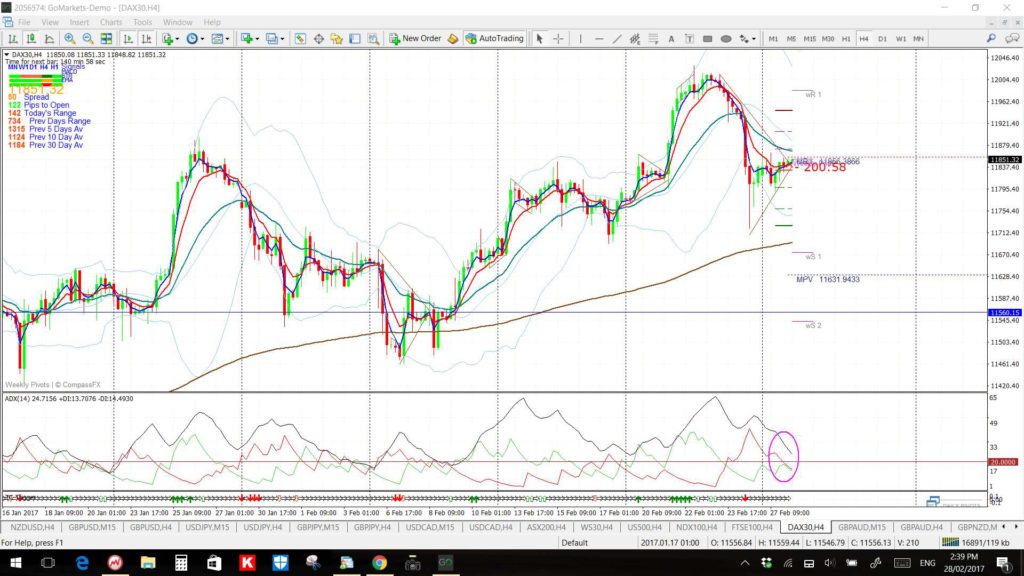
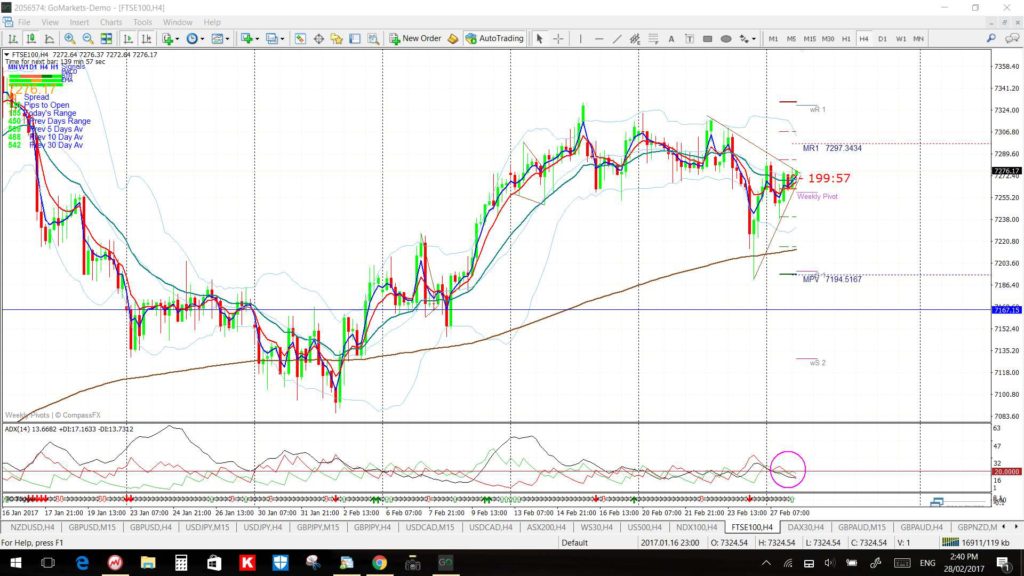
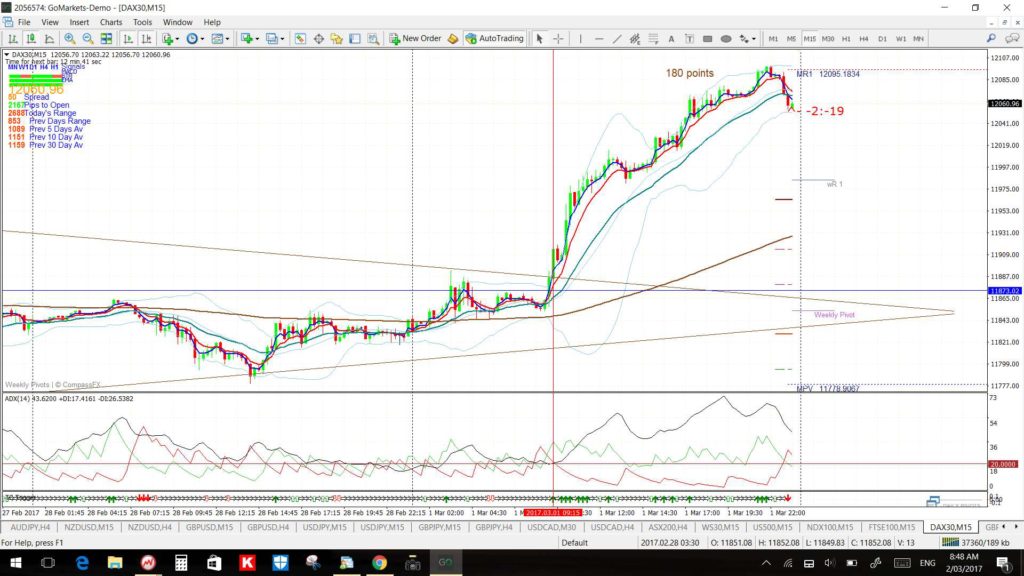
The best trends come out of sideways markets and the charts below are an example of this. These charts from February 2017 show some of the stock indices were consolidating in wedge or triangle patterns in the lead up to President Trump’s address to the joint session of Congress. There were significant breakout moves on these indices following this speech. These moves could have been easily caught on lower time frames and triggered with the added confluence of new 15 minute TC signals. See below.
These were the 4hr charts prior to the Trump speech:
S&P500 4hr:
DJIA 4hr:
NASDAQ-100 4hr:
DAX-30 4hr:
FTSE-100 4hr:
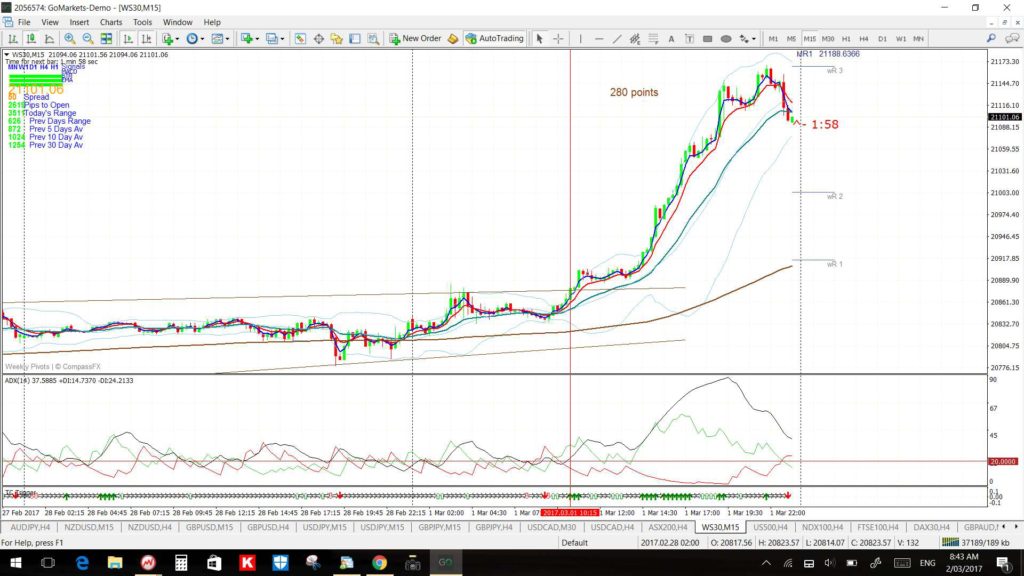
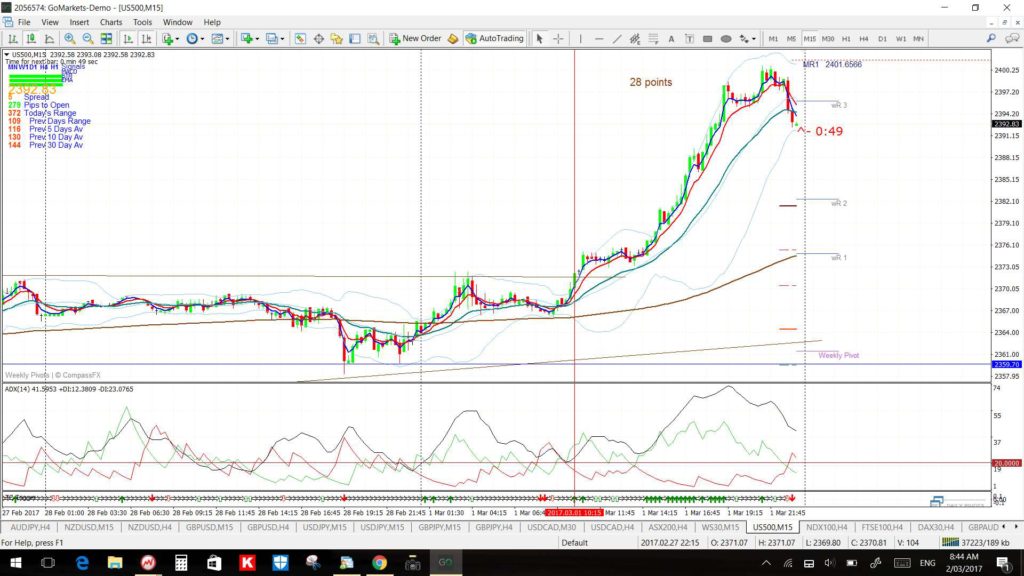
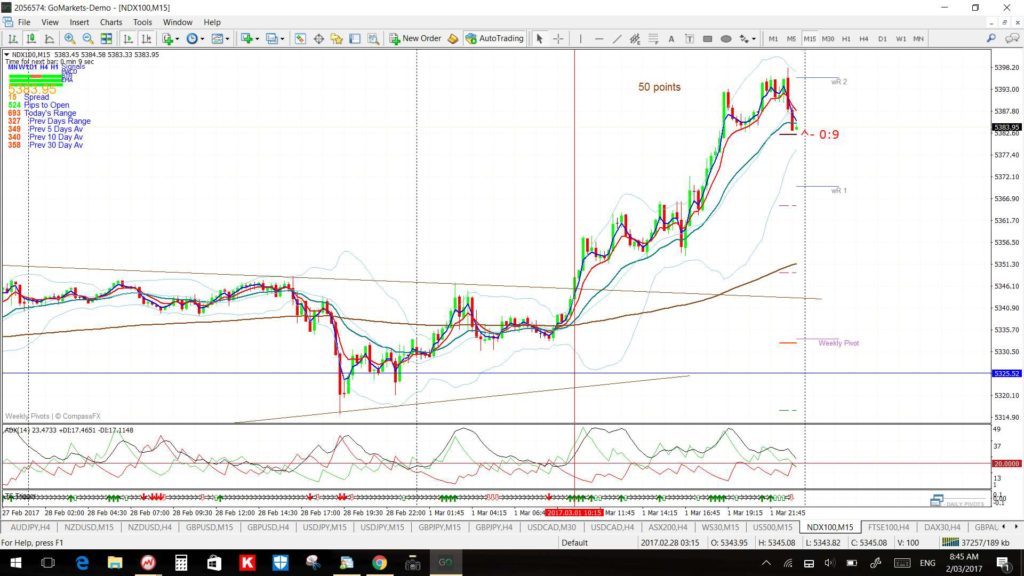
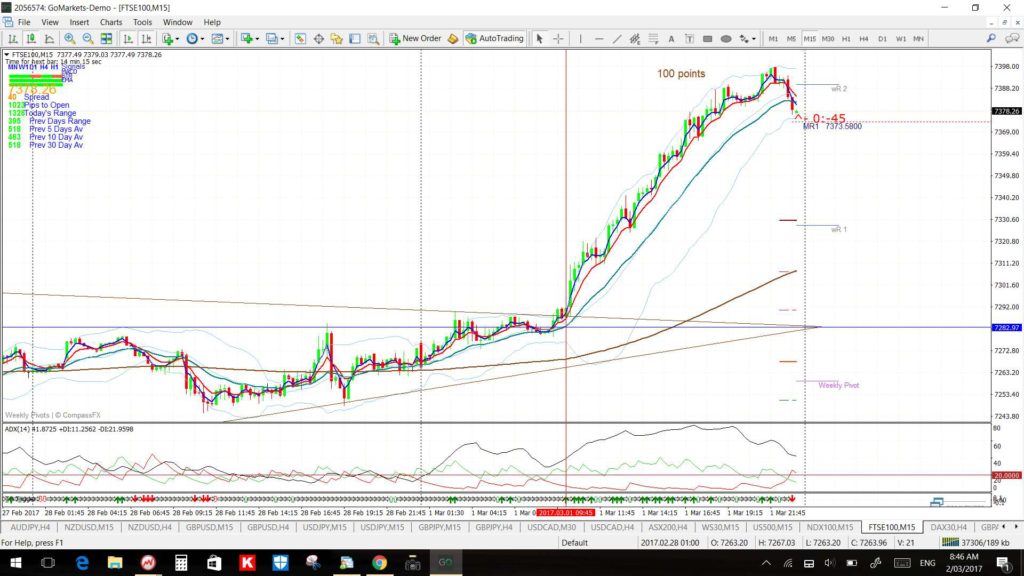
These are the 15 minute charts following the Trump speech showing the great trend line breakout trades that also triggered with new TC LONG signals. These trades offered great low risk but high rewards opportunities for those who could trade the European and US sessions:
DJIA 15 min: gave a 280 point move:
S&P500 15 min: gave a 28 point move:
NASDAQ 15 min: gave 50 points:
FTSE 15 min: gave 100 points:
DAX 15 min: gave 180 points:


