The topic for this article addresses the technical analysis concepts of Support and Resistance. I was chatting recently with the Sydney Chapter President of the ATAA, Darryl Nagel, about a new ATAA Blast article and I mentioned that I wanted to try and find something that gave a good example of Technical Analysis in action, after all, the ATAA is an association for Technical Analysts! I said I’d have a look through my charts and get back to him, and, I didn’t have to look too far! As you can see, I only got as far as the letter B in the alphabet before an example of Technical Analysis in action turned up. The charts below are of Beacon Lighting Group and the price, at the time of writing this article on March 2nd, was $2.58.
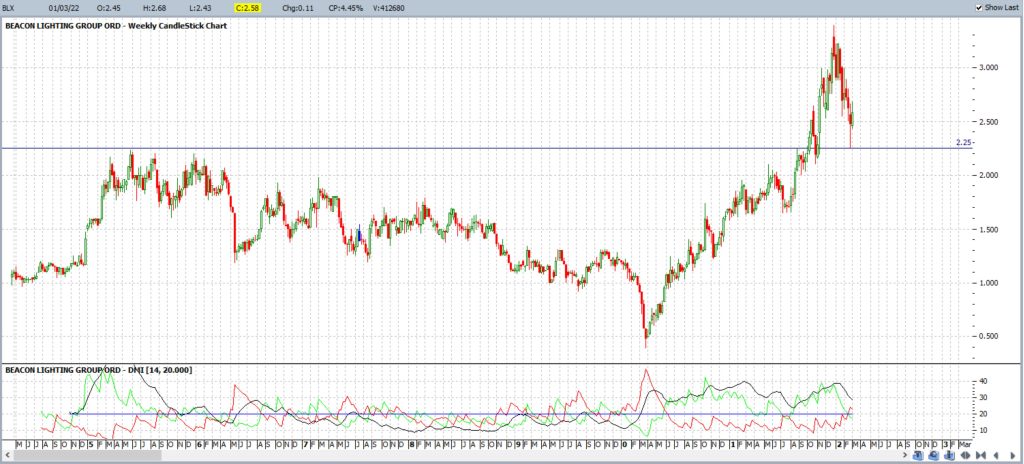
Beacon Lighting Group (BLX: ASX) listed on the ASX in 2014 and the chart In Figure 1 shows that price opened up near $1 and rallied to just under the level of $2.25 by mid-2015, a period of about one year. Price peppered along under that level for almost another year before retreating to a low near $0.50 in early 2020, at the peak of the COVID-19 inspired stock market pullback. The $2.25 level was one clear Resistance zone during this entire period.
Fig 1: BLX weekly
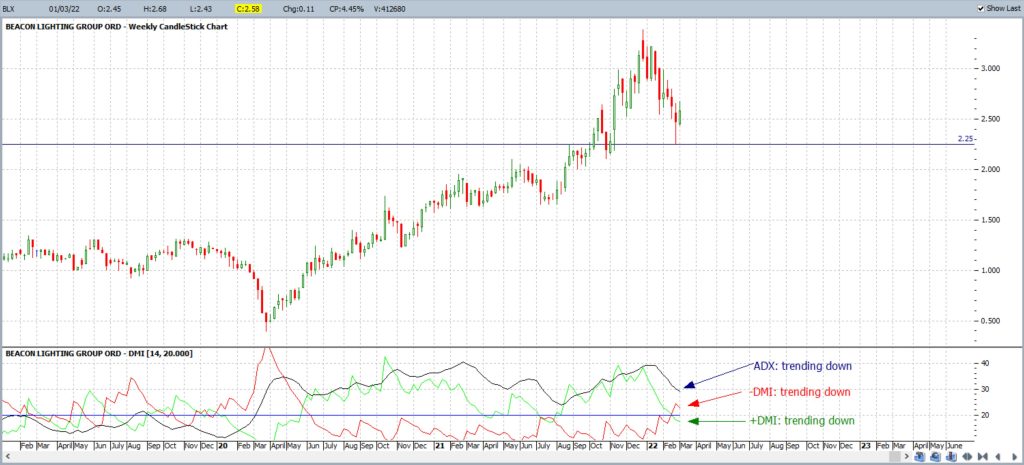
Price action for BLX has been in recovery mode since that COVID-19 inspired pullback and has rallied for the last two years, as you can see in Figure 2. In fact, there was a weekly close above the $2.25 Resistance level for the week ending 8th October 2021. Price has managed to stay above $2.25 for much of the time since that breakout and rallied to a High of just under $3.50 in December 2021. Price has retreated since then though and you can see that it has pulled back and recently tested that key level of $2.25.
It is not a huge surprise to see this level of $2.25 being tested after it was broken in late 2021. The big question now, though, is whether this will hold. In other words, will this $2.25 level evolve from being Old Resistance into New Support?
Fig 2: BLX weekly showing $2.25 S/R region
One charting tool that I use to help me gauge the level of stock price activity and momentum is the ADX indicator. I have highlighted the ADX indicator on the chart in Figure 3 to show that there is not a lot of momentum evident with BLX at the moment. Note how there is a decline in the ADX momentum indicator as well as with both the +DMI and -DMI. There may be a period of some sideways consolidation activity with price action around $2.25 whilst the market digests this level and decides which way to move from here.
There are certain ADX features to monitor from this point on as price action negotiates around this $2.25 level:
- Bullish scenario; if price action holds above $2.25, or even rallies up from this level, and if this activity evolves with an uptick in the ADX indicator (black line) and the +DMI indicator (green line) then this would suggest that the $2.25 level has evolved into new Support.
- Bearish scenario; if price action breaks below $2.25 and if this break evolves with an uptick in the ADX indicator (black line) and in the -DMI indicator (red line) then this would suggest that the Support level of $2.25 has failed.
Fig 3 BLX weekly showing current declining momentum
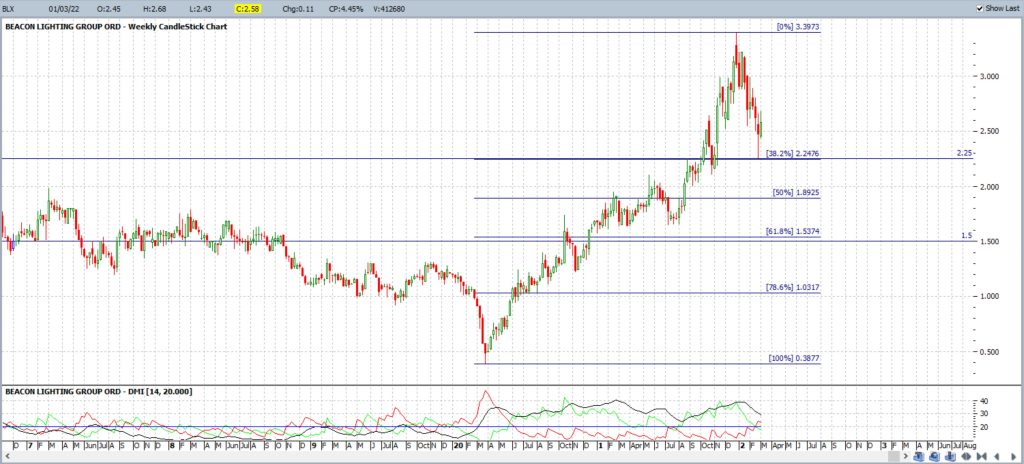
Any bearish scenario that evolves, that is, if price breaks below $2.25 on increased momentum, would have me looking down to the $1.50 level. How did I arrive at this level? Good question. I use a Fibonacci retracement tool to help me map retracement levels when there is a pullback in price action. Applying the Fibonacci retracement to the BLX chart for the swing High move, from early 2020 to late 2021, shows that the popular 61.8% retracement level is down near the whole number level of $1.50. The chart in Figure 4 shows that this $1.50 level has also been an area of previous price reaction and this can be seen throughout the period from mid-2017 through to late 2018 as well as for the middle months of 2020. Therefore, if price action was to break below $2.25, I would be looking to see if $1.50 might act as a new Support level.
Fig 4: BLX weekly with Fibonacci Retracement
Final comments:
There are certainly no guarantees with Technical Analysis, rather it is an approach that can help traders to try and make sense of the price action of different trading instruments. The chart of Beacon Lighting Group shows that a previous resistance level of $2.25 was broken in late 2021 and price is currently attempting to hold above this region in an effort to carve out ‘New Support’ from this ‘Old Resistance’. It’s not surprising to see some market uncertainty as price action hovers near this key level but the big question remains whether this Old Resistance level of $2.25 will become New Support. I suggest you keep an eye on that $2.25 level, as well as the ADX, to try and gather clues about where Beacon Lighting Group price action is headed from this point forward.


