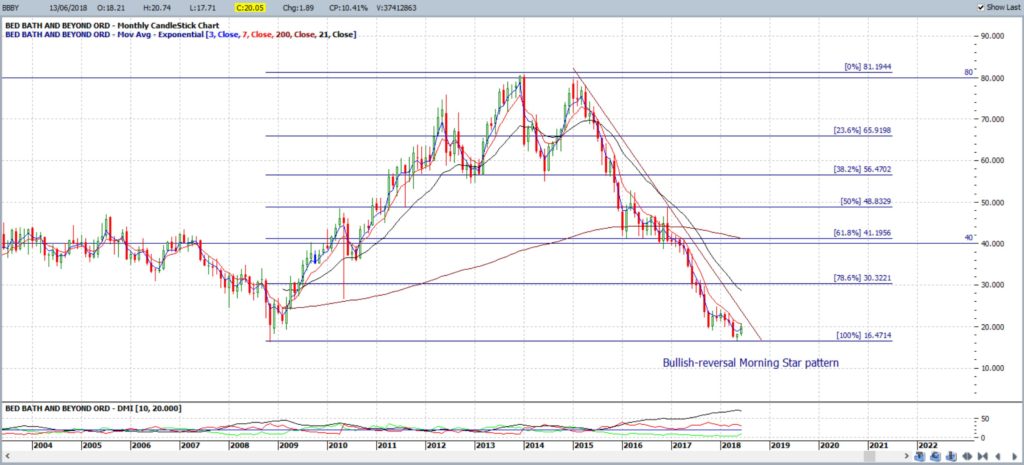
Bed, Bath and Beyond (BBBY: NASD) has been in decline for the last three years or more but price action is currently poised near the 2008 Lows and printing a bullish-reversal monthly chart pattern. This might be one to keep in mind if there are any further clues suggesting an attempt at recovery. A rather timely post I think given US Retail Sales just came out with an upbeat data print!
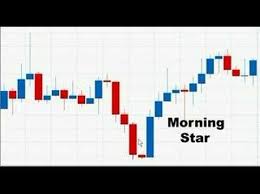
BBBY monthly: price action might be trying to base at the 2008 Lows and is currently printing a bullish-reversal Morning Star pattern. Watch to see how the monthly candle does eventually close but, if the pattern is confirmed, then watch for any bullish follow-through:
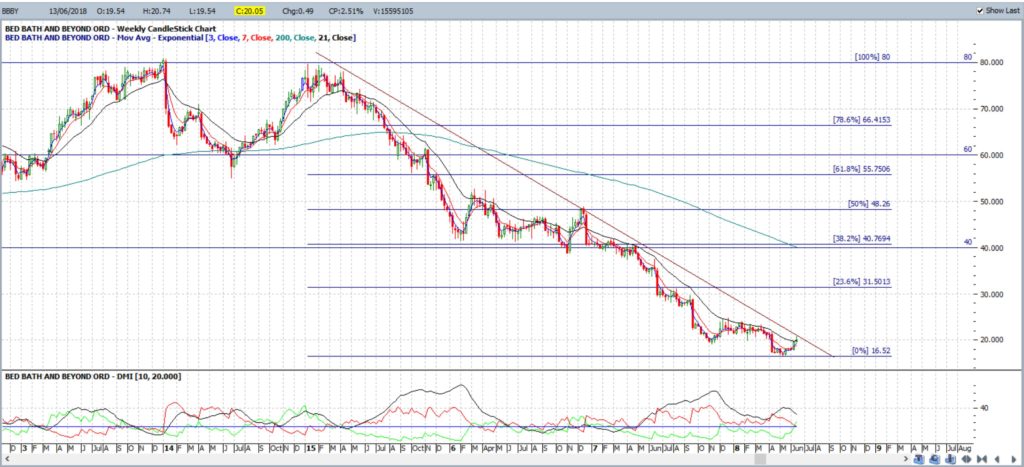
BBBY weekly: keep an eye on this bear trend line for any new breakout. Any breakout to the upside would have me looking for a move back to the $60 level as this is previous S/R and near the weekly 61.8% Fibonacci:
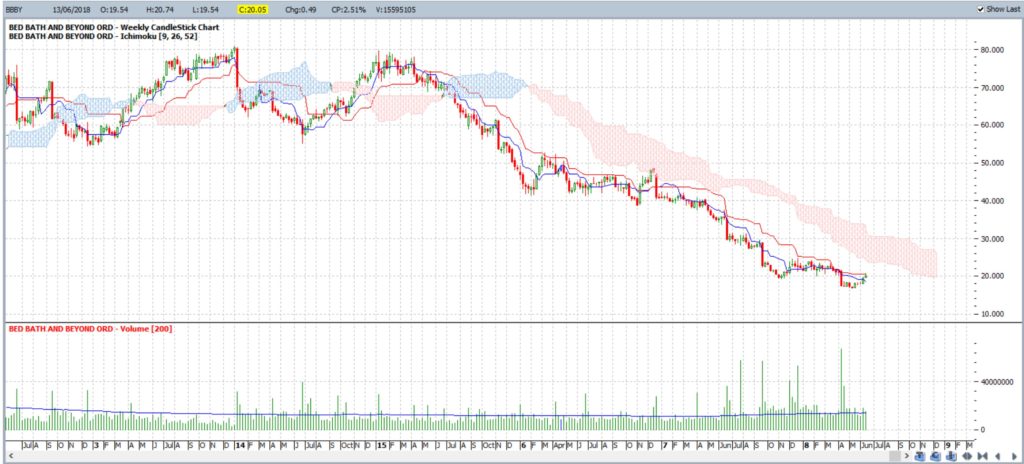
BBBY weekly Cloud: watch for any move back above the weekly Ichimoku Cloud and uptick with Volume:
Summary: BBBY might be trying to base at the 2008 Low and is currently printing one bullish-reversal clue; that of a monthly Morning Star pattern. Watch for any new break above a bear trend line and the weekly Cloud to support some bullish recovery effort.


