Australian stocks have joined in the global sell off seen over the last few trading sessions. US Fed comments about stocks being over-valued, some weak local bank earning reports and an uptick with the national unemployment rate have combined to un-nerve Australian investors. In this post I highlight the key technical support levels to watch on the two main stock indices, XAO, the All Ordinaries or top 500 stocks and XJO, the ASX-200 or top 200 stocks as well as on the ASX-200 ETF, STW.
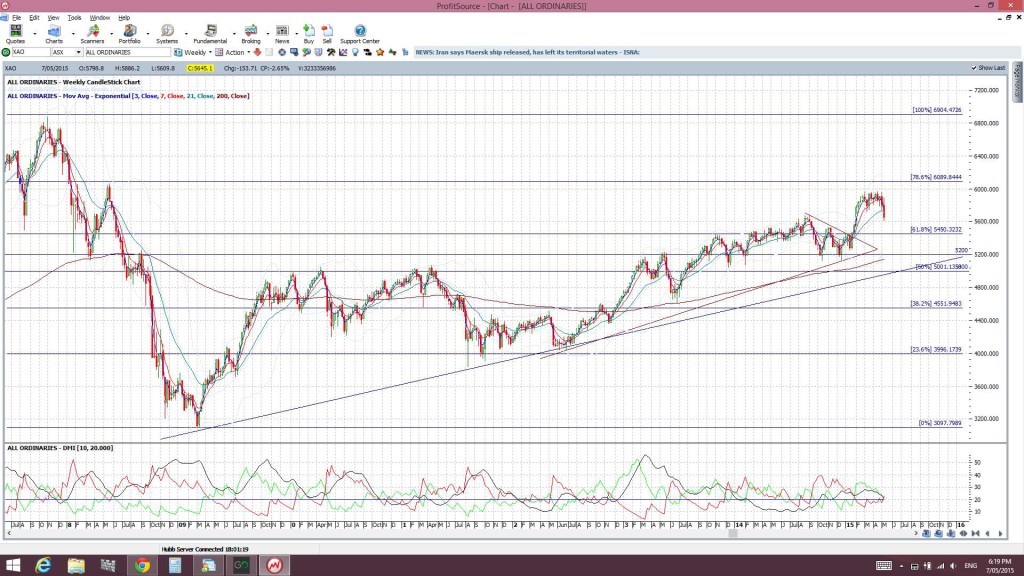
XAO All Ordinaries weekly: This chart shows how price is retreating following the bullish January triangle breakout. Price had rallied up to near the 6,000 level but has subsequently pulled back. Support levels below current price include the whole-number 5,600 level and, then, the 61.8% fib of the 2008-2009 bear move that is down near 5,450. The next support below this level is down near 5,200:
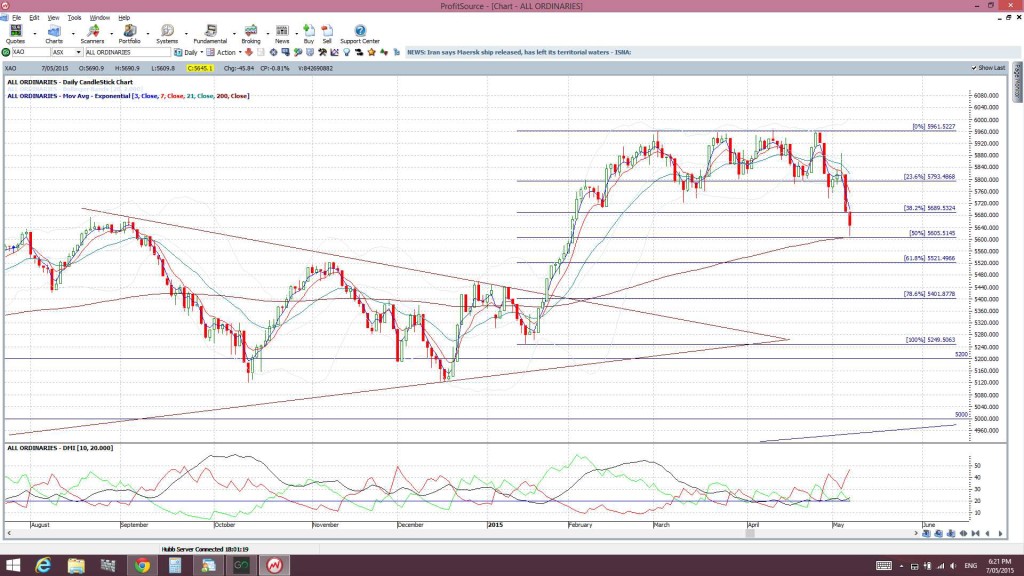
XAO All Ordinaries daily: applying fib levels to the recent bull run shows that price has pulled back to test the 50% fib level near 5,600 but that the 61.8% fib of this move is down near 5,520.
Thus, the four key support levels to watch on the XAO, derived from weekly and daily chart Fib and S/R levels, include: 5,600, 5,520, 5,450, and then 5,200.
XJO ASX-200 weekly: This chart also shows price retreating following the bullish January triangle breakout. Price had also rallied here up to near the 6,000 level but has subsequently pulled back. Support levels below current price include the whole-number 5,600 level and then the 61.8% fib of the 2008-2009 bear move that is down near 5,420.
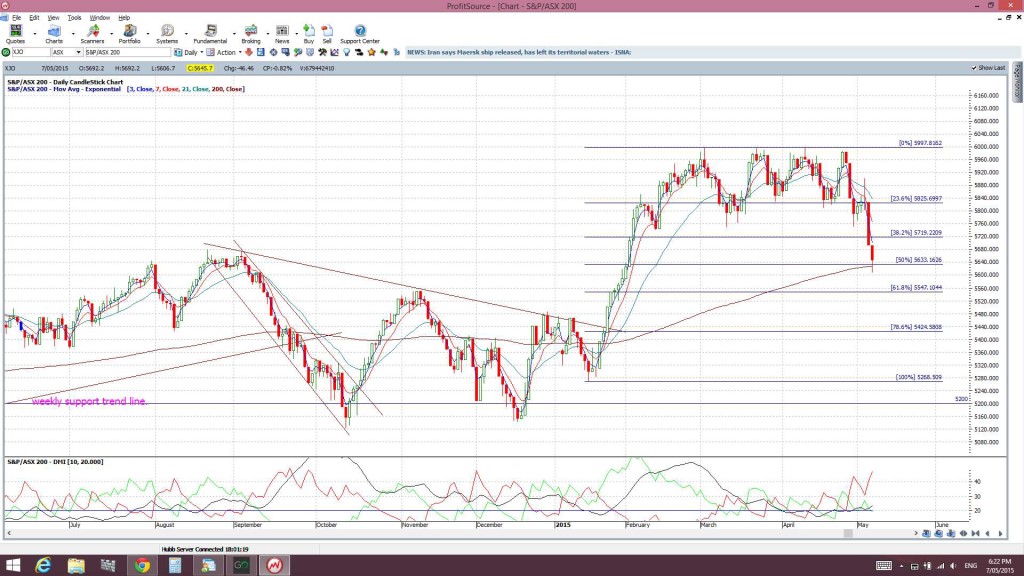
XJO ASX-200 daily: applying fib levels to the recent bull run shows that price has pulled back to test the 50% fib level near 5,630 but that the 61.8% fib of this move is down near 5,550.
Thus, the four key support levels to watch on the XJO, derived from weekly and daily chart Fib and S/R levels, include: 5,630, 5,600, 5,550 and 5,420.
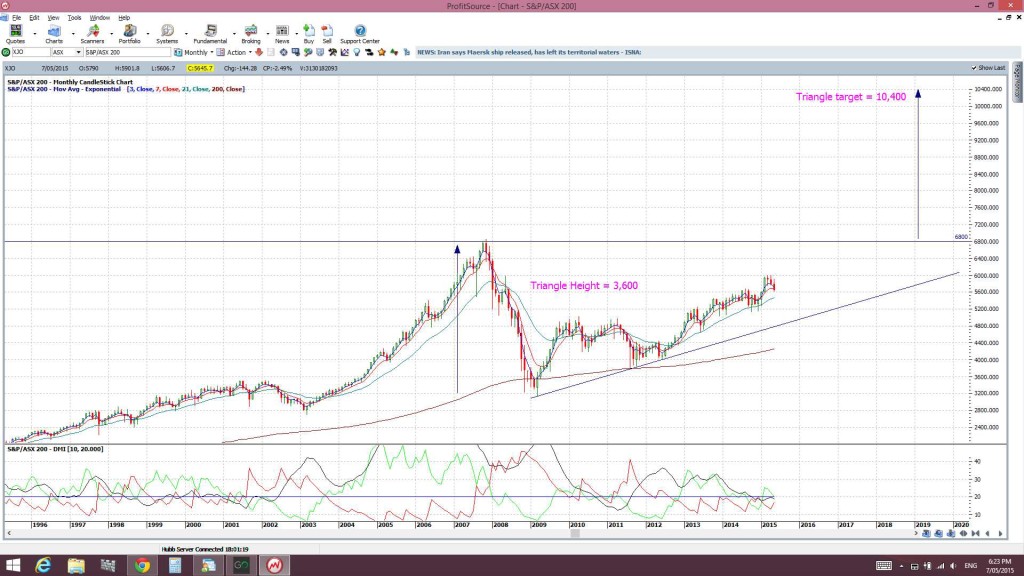
XJO ASX-200 monthly: I am still seeing this XJO move as part of a longer-term bullish ascending triangle on the monthly chart time-frame:
STW: ASX-200 ETF weekly: this chart shows how the ETF has pulled back to the 61.8% fib of the 2008-2009 bear move, a level near $52.50. Any break and hold below this level would suggest a test of the 78.6% fib near $48. This is also a region or previous support/resistance:
Summary: Price action has fallen back from strong 6,000 resistance on both the XAO and XJO indices. The next key support levels to watch from now, if bearish sentiment continues, include:
- XAO: 5,600, 5,520, 5,450, and 5,200.
- XJO: 5,630, 5,600, 5,550 and 5,420.
The lower levels to watch on the ASX-200 ETF include:
- STW: $52.50 and $48.
Continued bearish sentiment and a break of these key support levels on the XAO, XJO and the STW ETF would have me looking for further support levels but I will wait until such time occurs.


