The Aussie market closed higher today but still couldn’t manage a monthly March candle print above the key 6,000 level. This is no great worry but it would have been a nice psychological boost. However, the print of a monthly bearish-reversal ‘Hanging Man’ candle at this key resistance level may cause traders some market jitters.
XJO monthly: ASX-200: Yes…it has printed a bearish-reversal monthly candle at key resistance BUT check out the ADX indicator. This is looking encouraging to me and so I’m prepared to accept that this bearish monthly candle may just be due to some nerves at this huge psychological 6,000 level:
The chart above also shows that I’m seeing this index tracking in a bullish ascending triangle pattern, much like the US indices of the S&P500, DJIA and NASDAQ. Thus, I’m on the lookout for overall continuation here although perhaps not in a straight line. There are a few ETFs that might be worth keeping in mind if this broader ASX-200 index tries to navigate new highs.
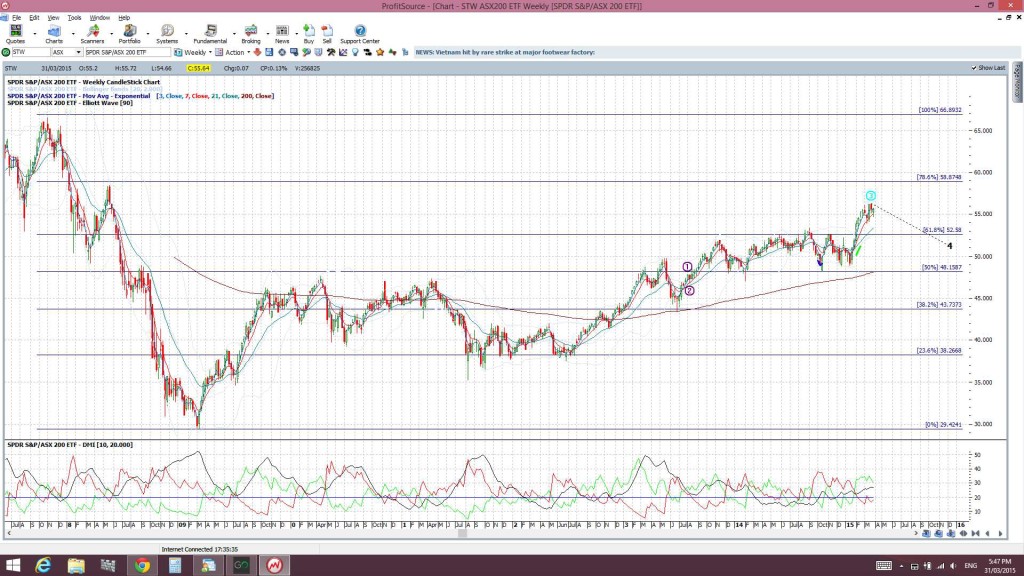
STW weekly: this ETF is based on the ASX-200: watch for a hold above the 61.8% fib and the $52.50 level:
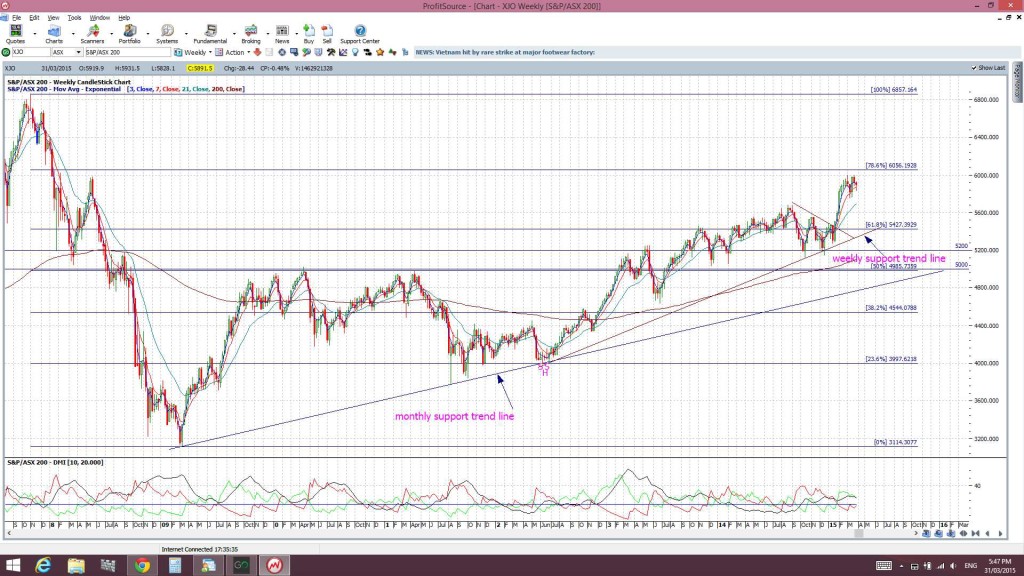
S&P/ASX-200: XJO weekly: this is the ASX-200 on a weekly time frame. Note how price is struggling at the next fib level of 78.6%. Any close and hold above this level would support bullish continuation and the STW ETF would enable traders to capture this move:
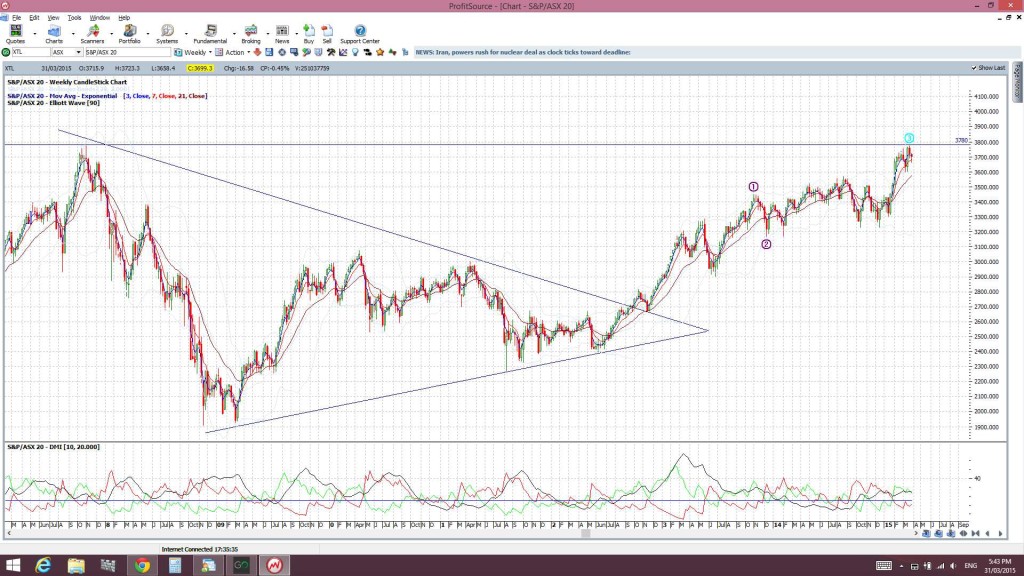
S&P/ ASX-20: XTL: this index is of the top 20 Aussie stocks: Note how price is testing the region of an all time high up at 3,780. A close and hold above this level would support continuation:
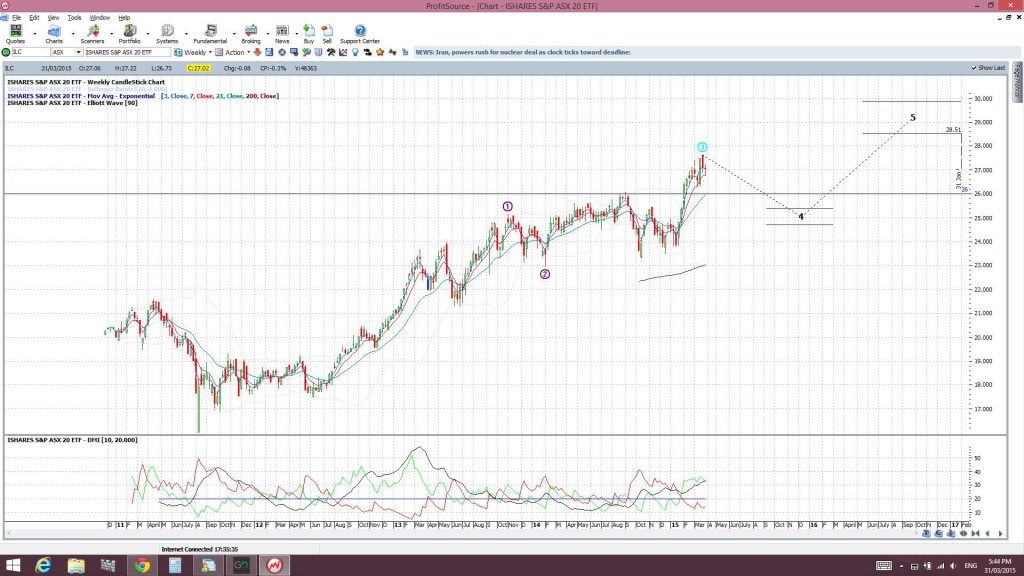
ILC weekly: this ETF is based on the S&P/ASX-20 and shows that there has already been a bullish breakout. Watch for any test of, and hold above, the $26 level. Especially if the index cracks the 3,780 level:
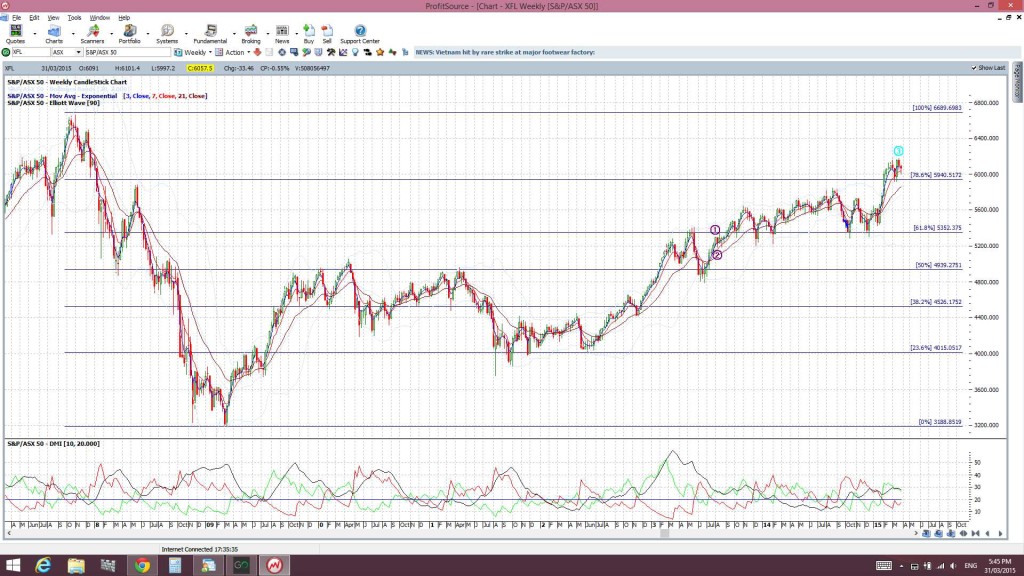
S&P/ASX-50: XFL: this is the ASX top 50 index and the chart shows that the index has broken the 6,000 level and is holding above support and the 78.6% Fib. This suggests continuation to the next fib of 100% near 6,700:
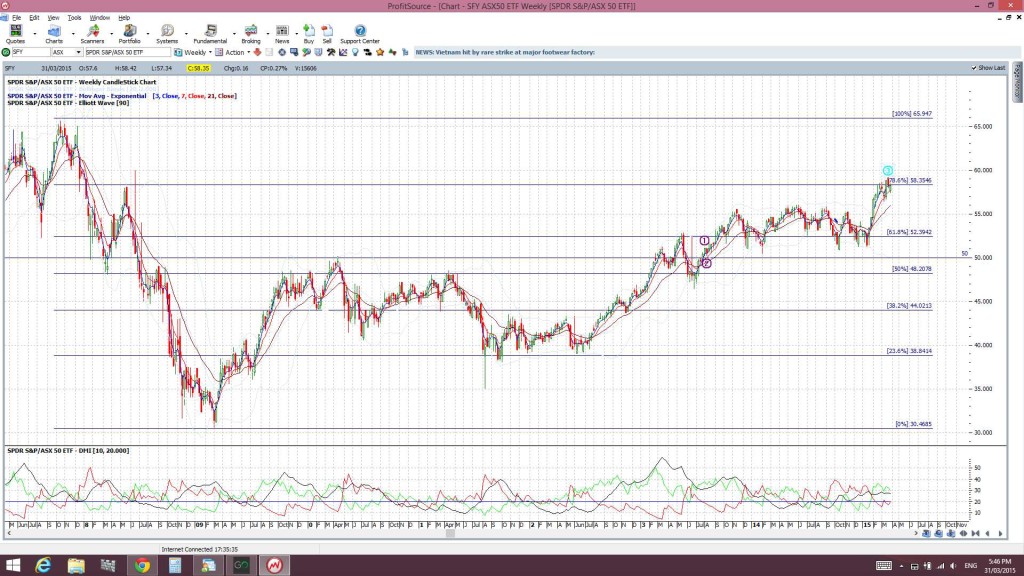
SFY: This ETF is based on the S&P/ASX-50 index and shows price action just below the 78.6% fib level. Watch for any continuation on the index and, then, for any hold above the 78.6% fib and $58.50 level:
Summary: There are three ETFs to enable traders to capture bullish market action on the Aussie stock market:
- STW: to track the S&P/ASX-200
- SFY: to track the S&P/ASX-50
- ILC: to track the S&P/ASX-20


