


Thurs 29th May (4 pm)
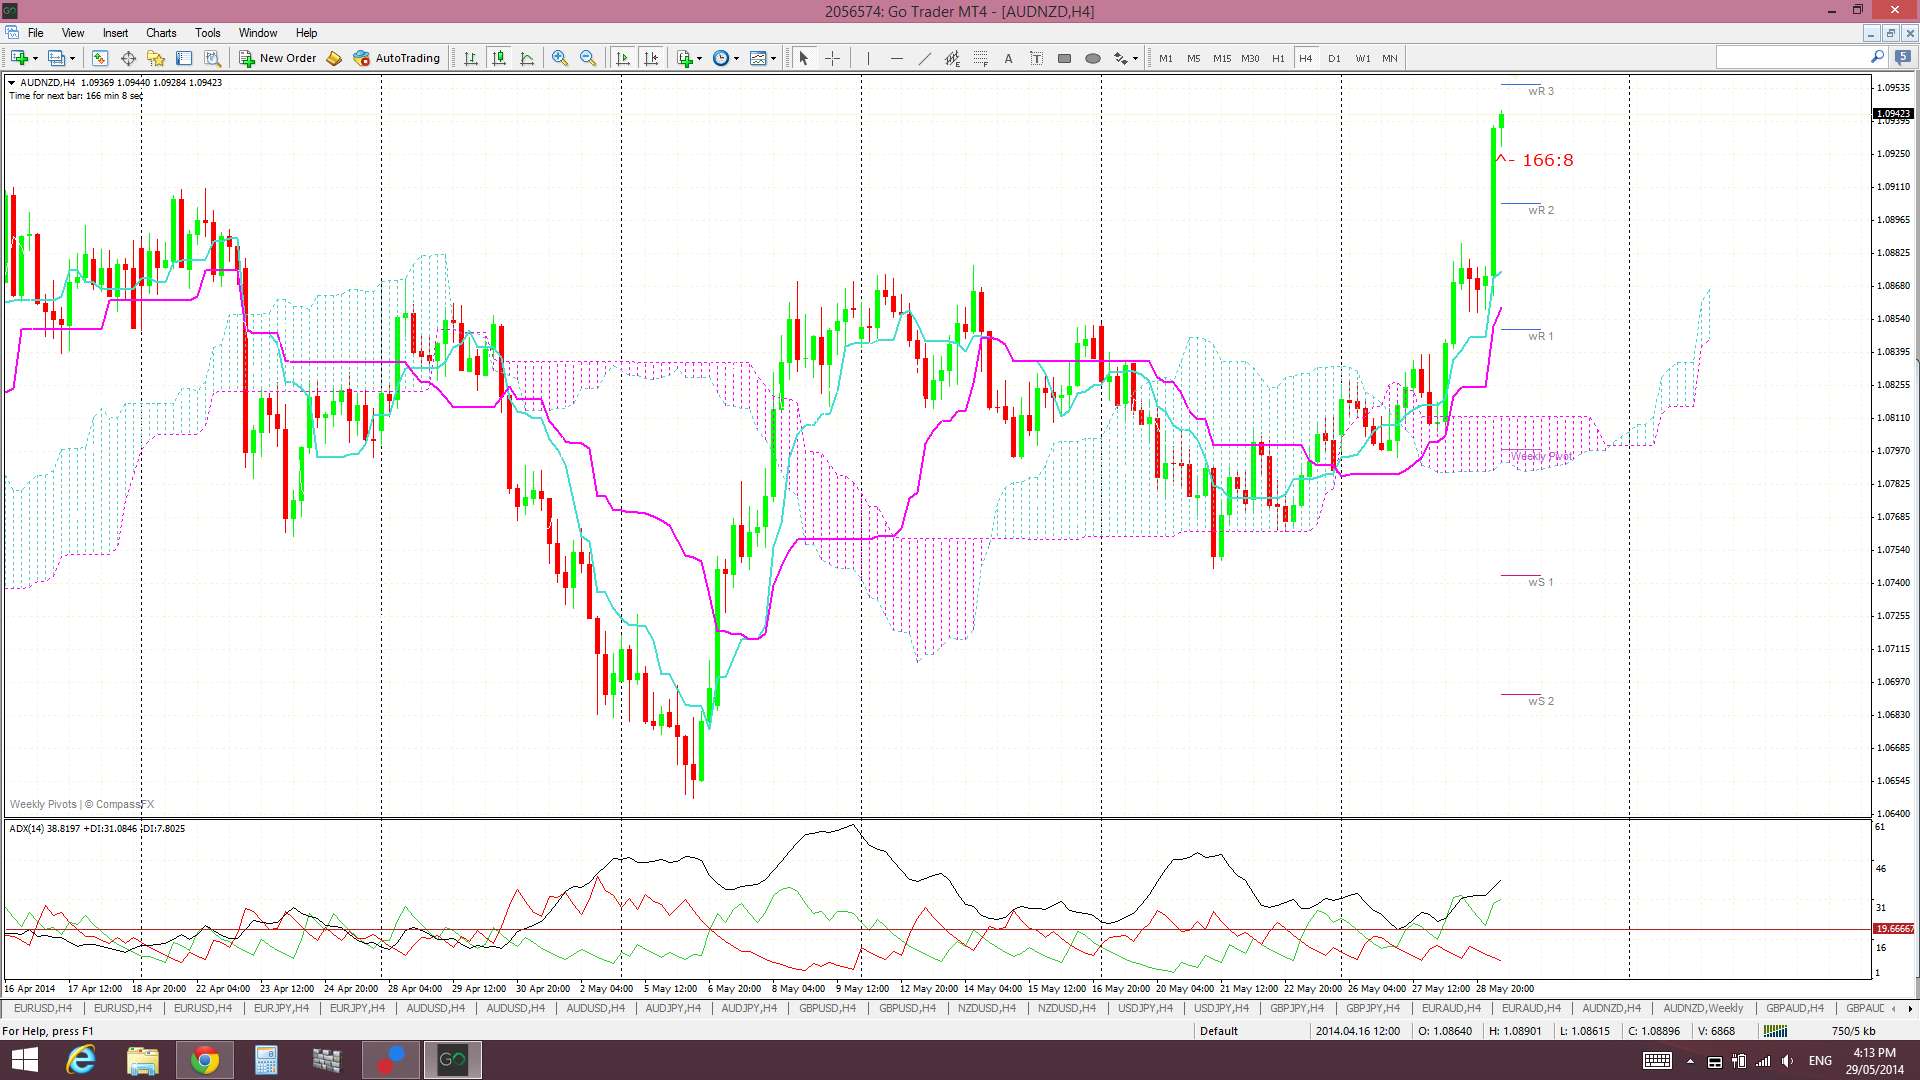
I am back from 2 days of much driving and I see the AUD/NZD has made a break of the key 1.09 S/R level that is the neck line of the ‘Double Bottom’. I have been writing for many weeks now in my various w/e and daily analysis reports for traders to watch the AUD/NZD for any close above the 1.09. My first comprehensive analysis of this was posted on April 7th. This time may now be here!
A/N 4 hr:
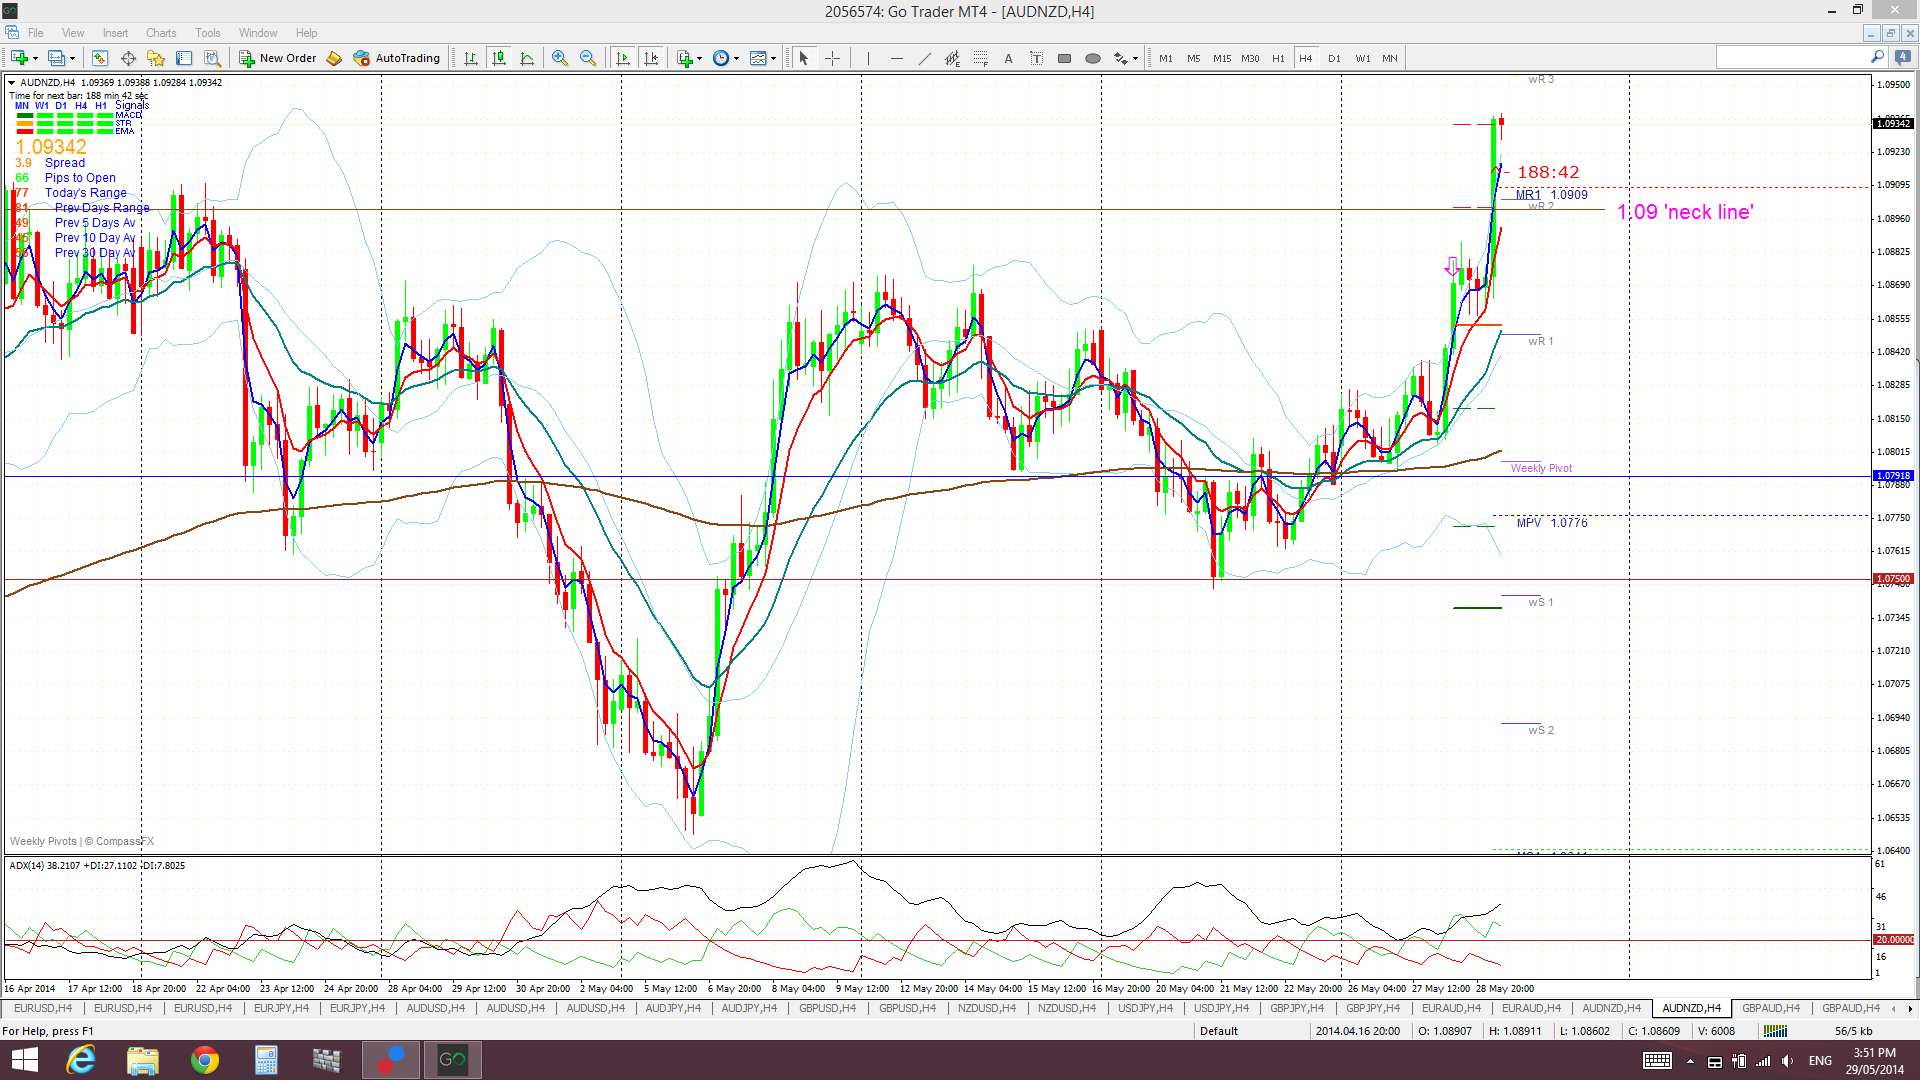
The question now that all traders will be asking is whether this particular break marks the long-awaited change in polarity for the AUD/NZD or is this merely another false breakout like the previous ones? Traders need to wait for the daily candle candle close tomorrow so as to confirm this possible directional change on the AUD/NZD.
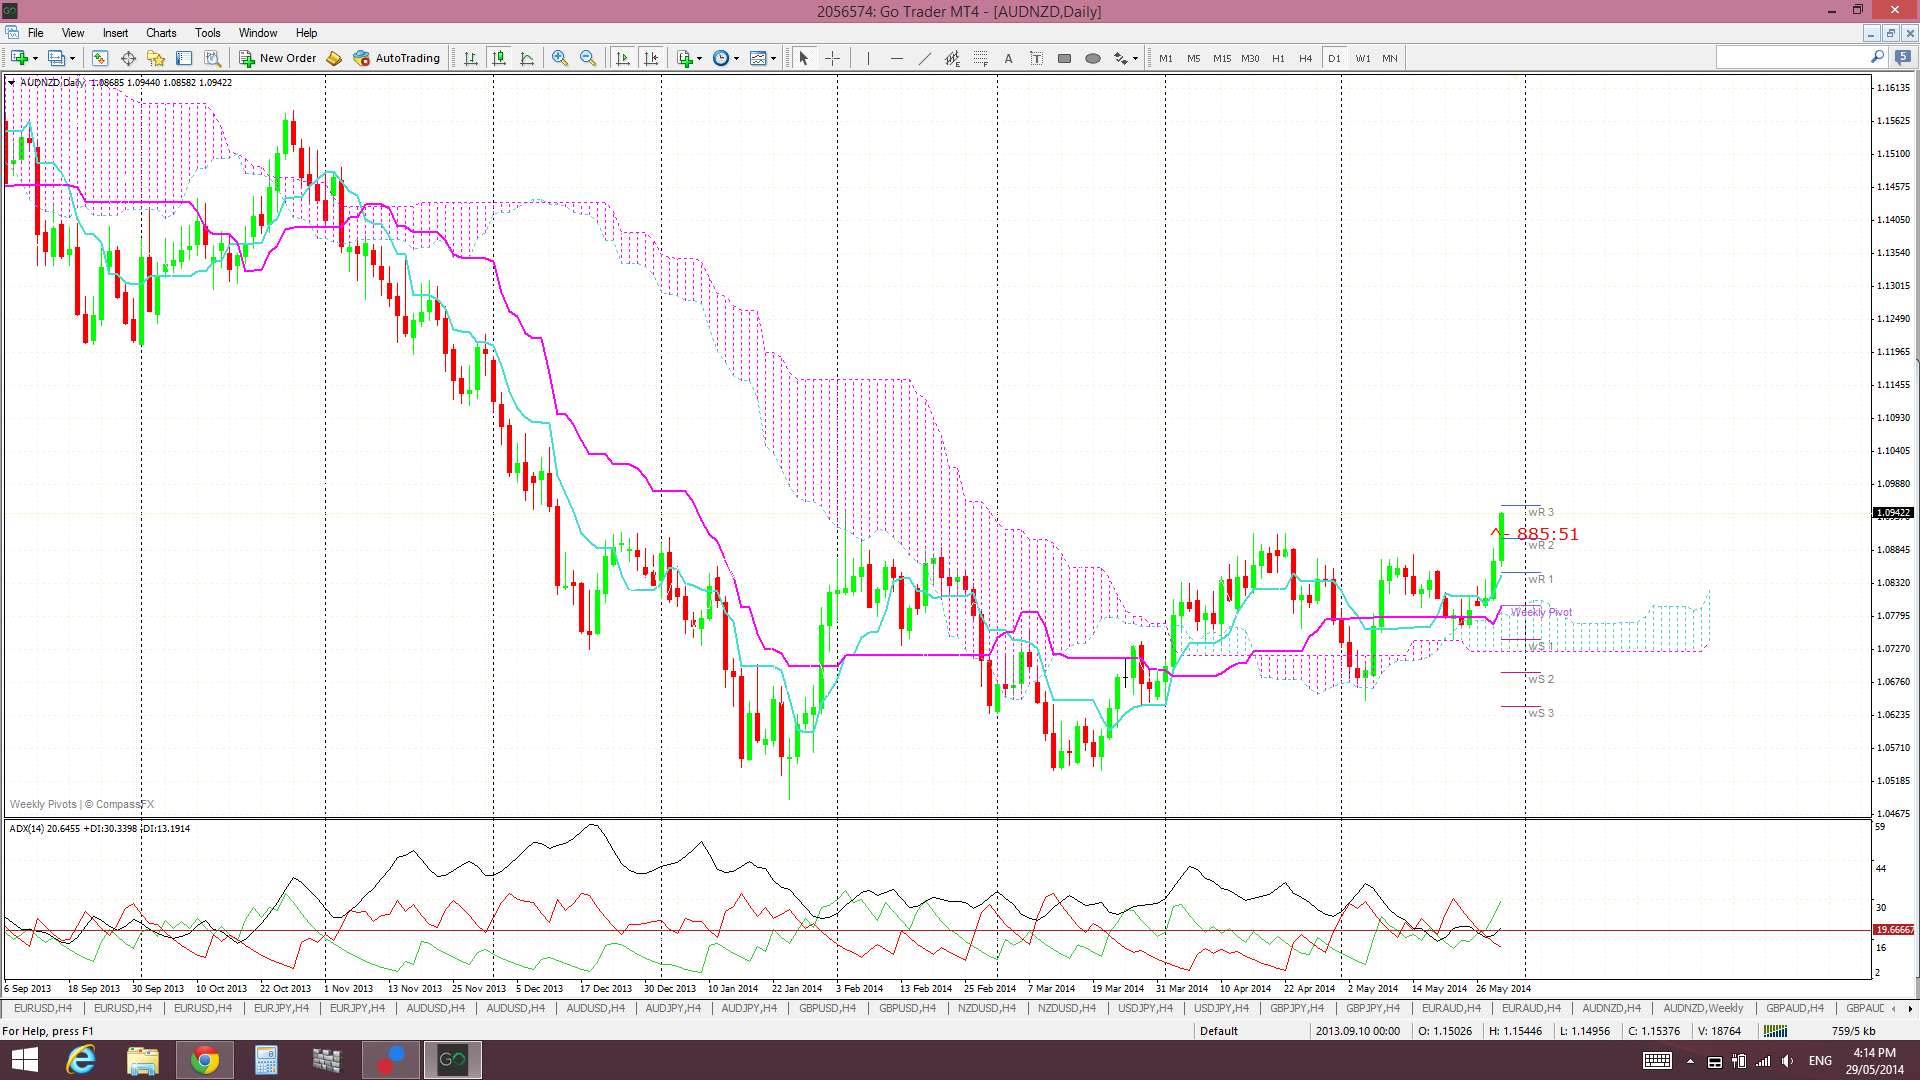
The 4 hr chart above does, indeed, show the occasional candle close above the 1.09 level on the 4 hr time frame. The daily chart below, though, shows that there has not been a daily candle close above this key 1.09 level since last year, that is, since prior to this latest ‘Double Bottom’ formation. Thus, the key issue here now is to wait until the daily candle closes tomorrow to confirm whether this break will be more likely to hold above the 1.09 and suggest a new direction for the AUD/NZD. A failure to close above the 1.09 on the daily chart will have us back in watch and wait mode:
A/N daily:
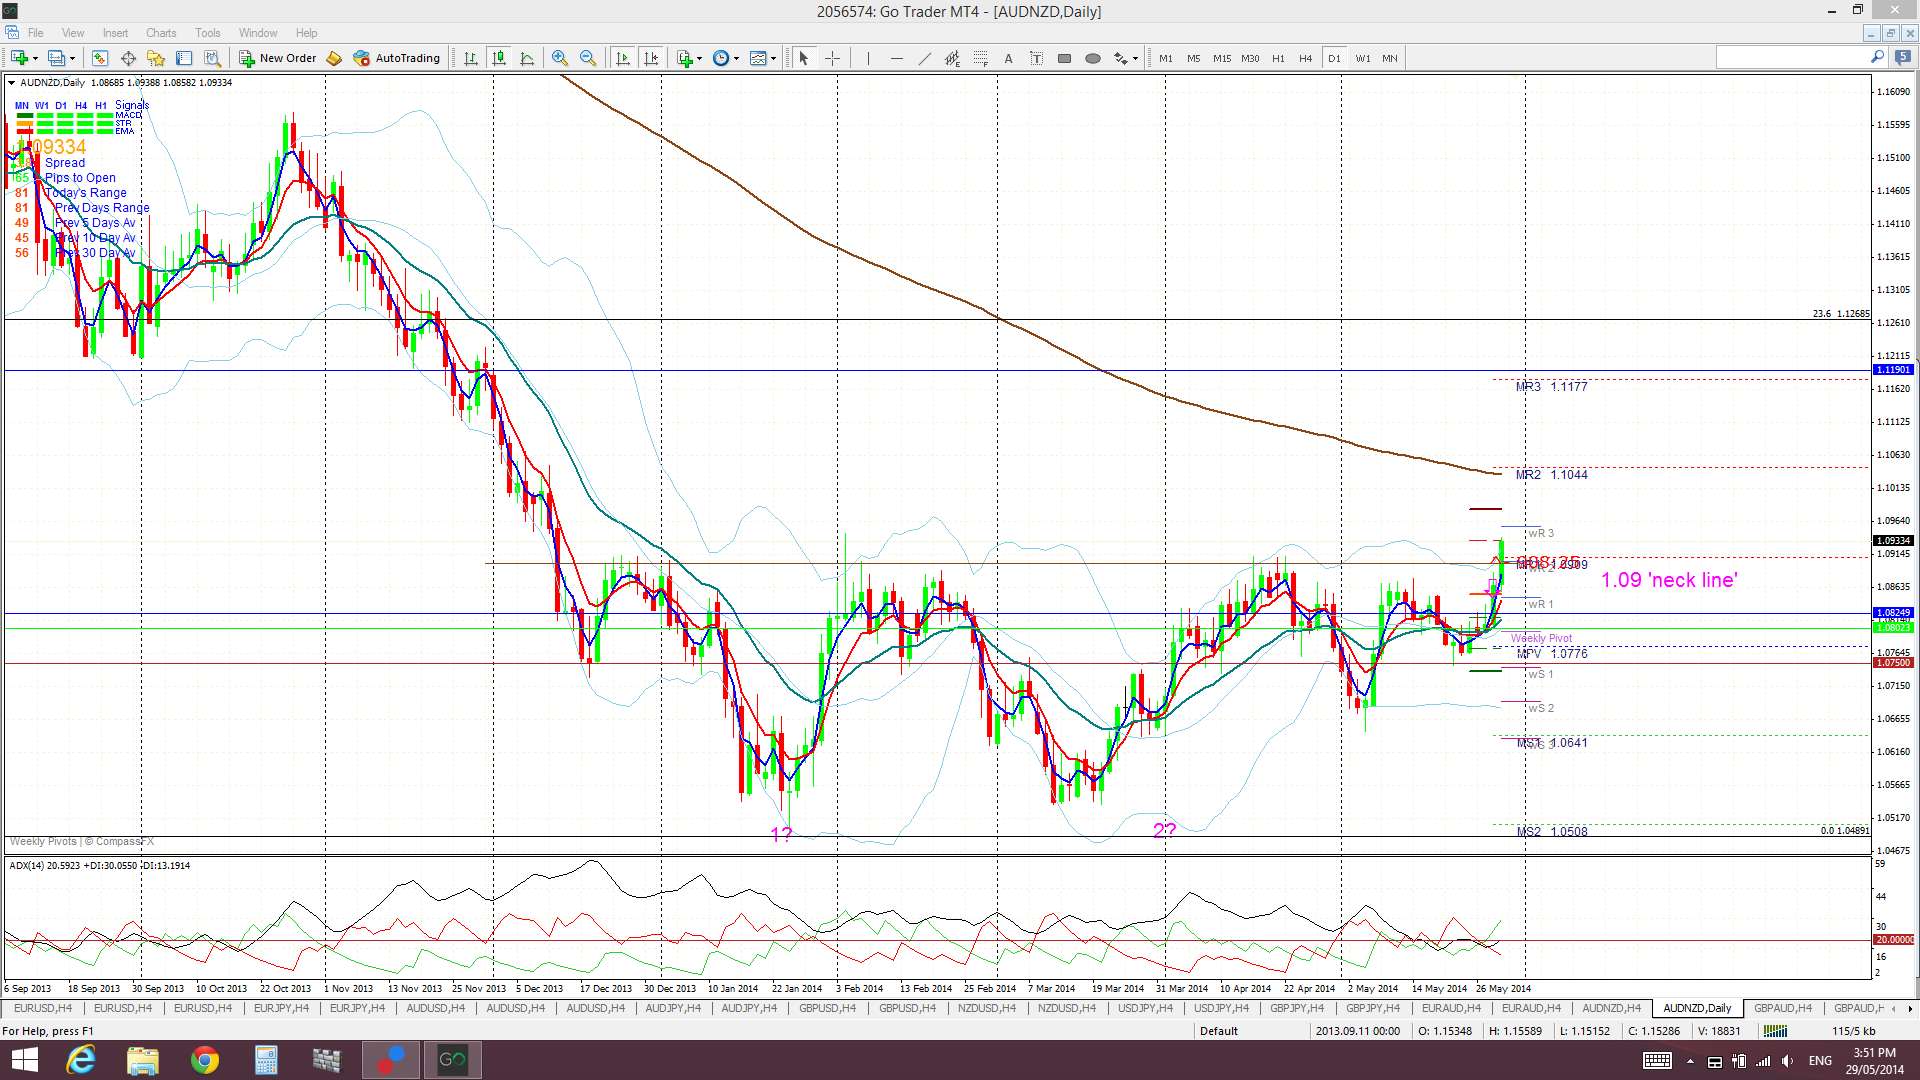
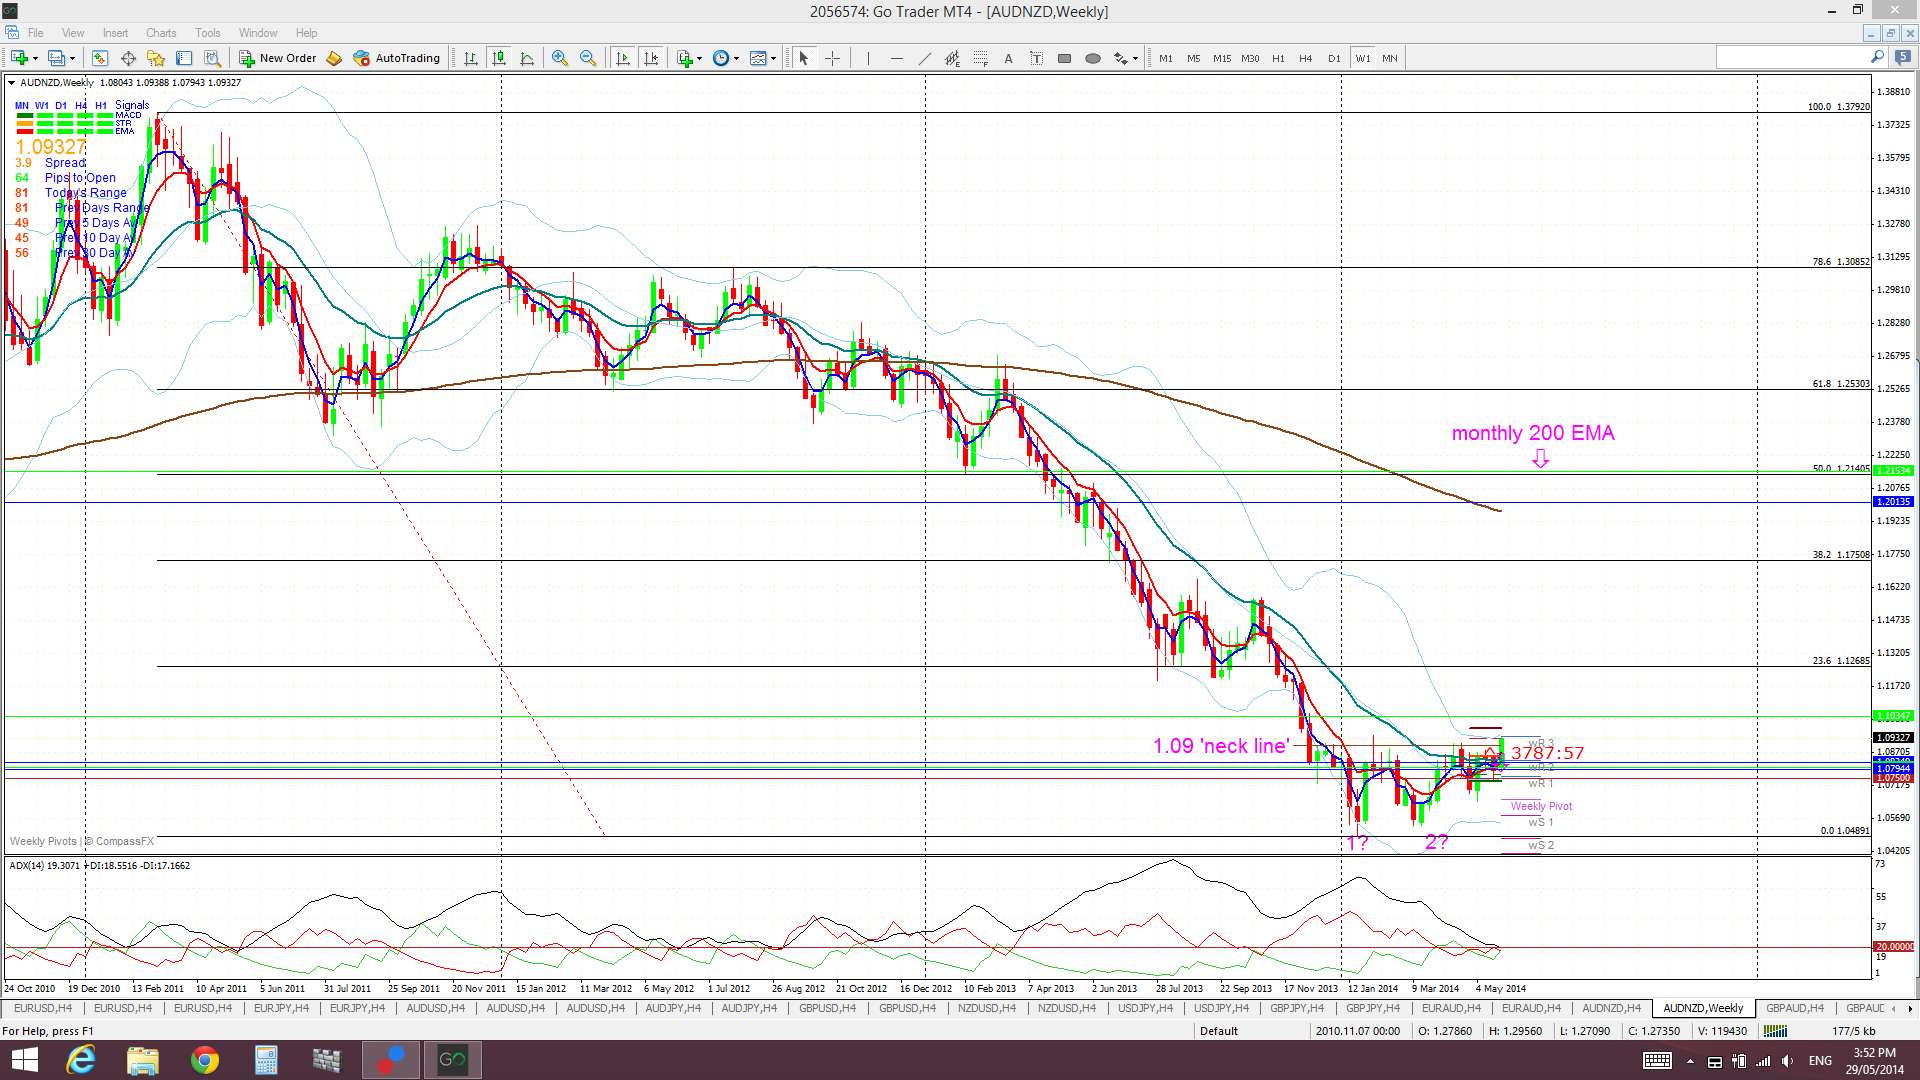
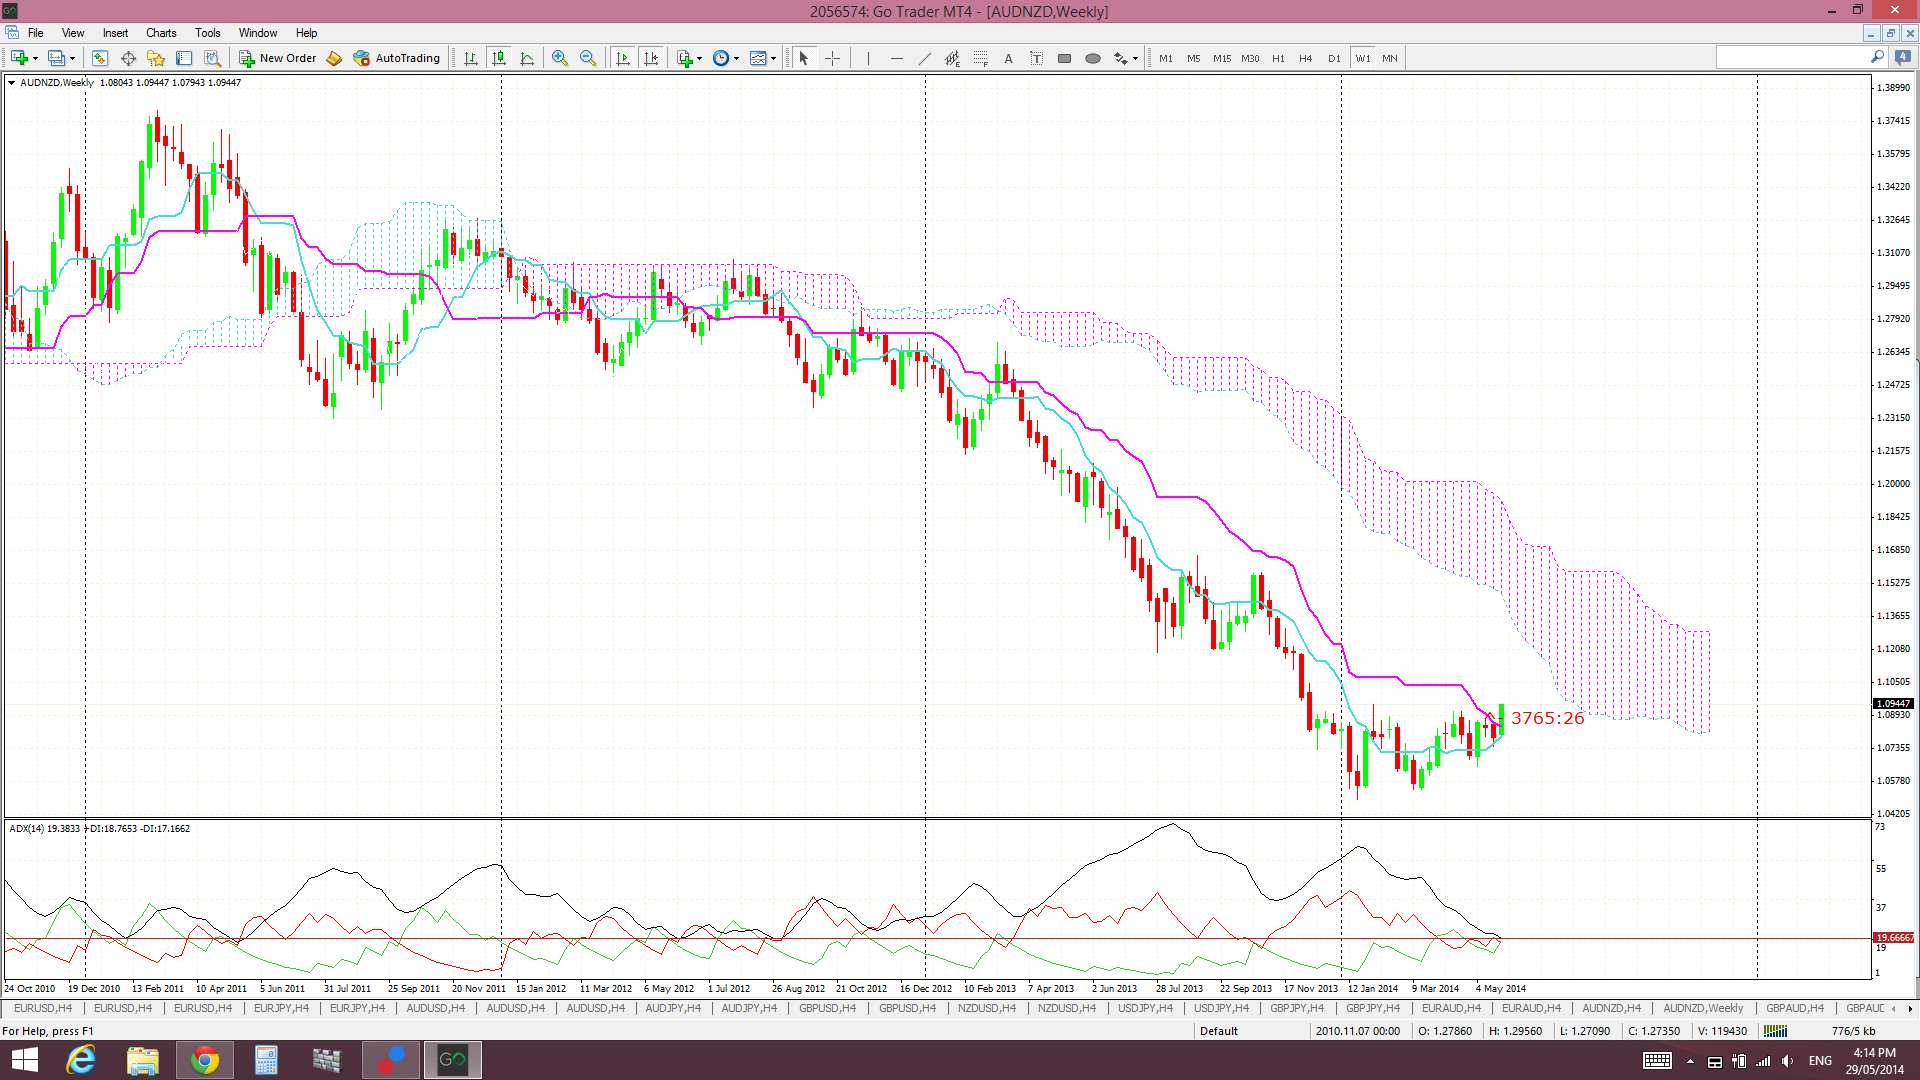
Targets for any bullish continuation, should the daily candle close above the 1.09 level, are best determined from the weekly chart. The weekly chart shows an area of congestion up near the 1.2 region. This is the region of the monthly and weekly 200 EMAs and the 50% fib level of the 2011-2014 bear move. This would be an area for a possible take profit and may seem ambitious as it is almost 1000 pips away:
A/N weekly:
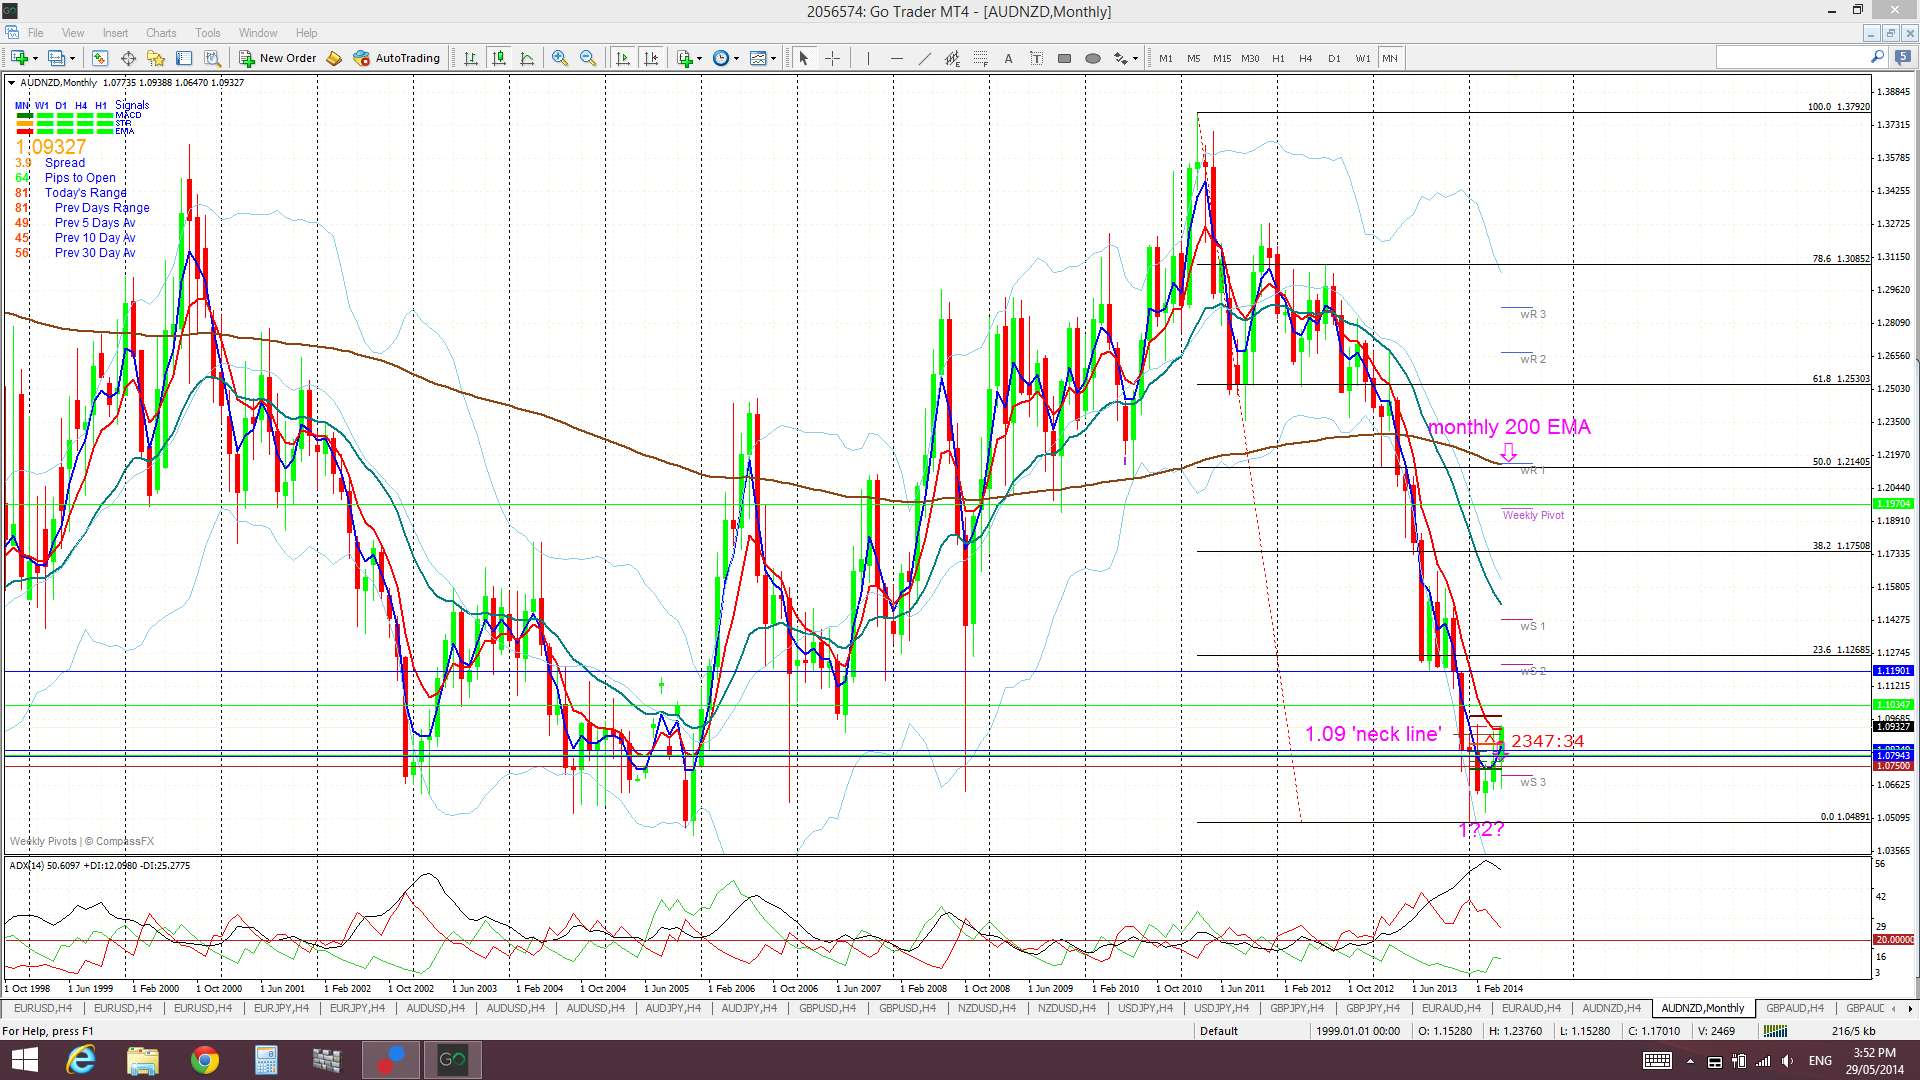
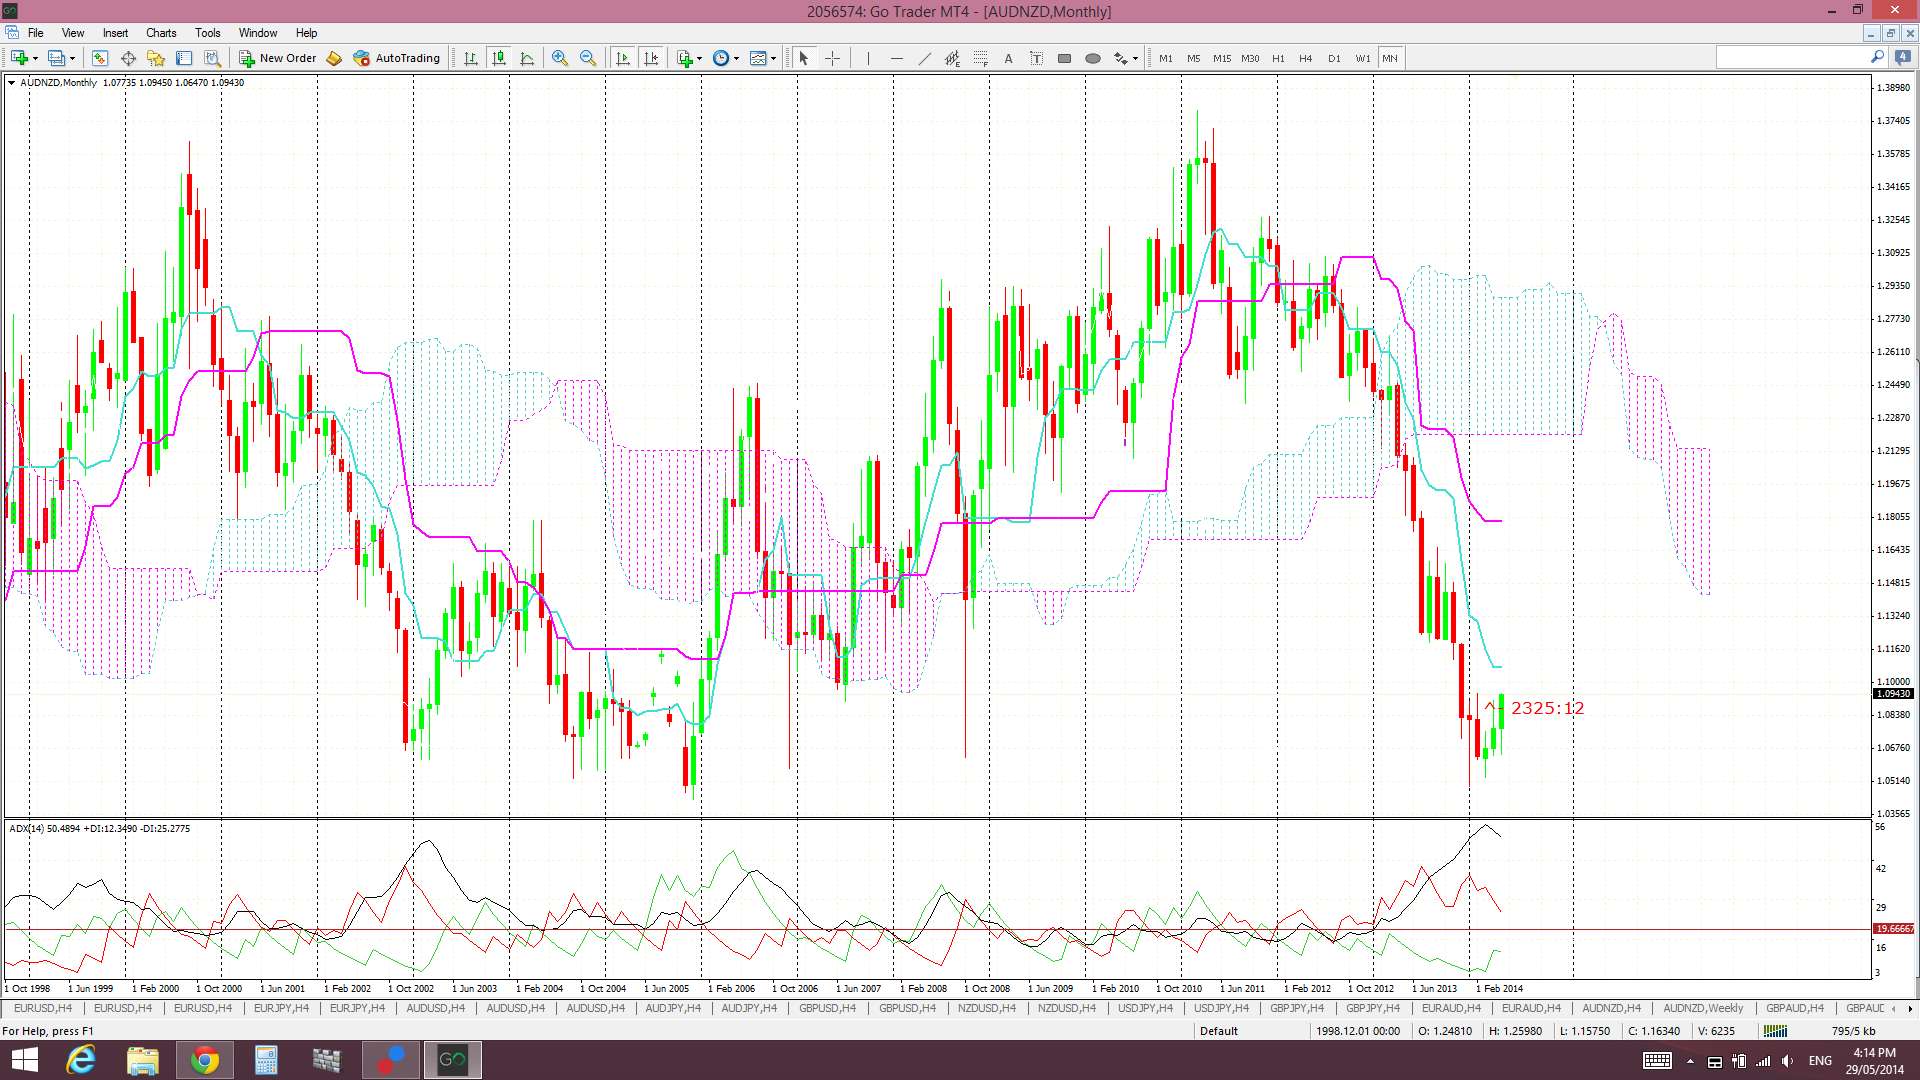
The monthly chart shows that there is even more room for this trade to move if the polarity change does take a firm hold:
A/N monthly:
AUD/NZD and the Ichimoku Cloud: The AUD/NZD is trading above the Ichimoku Cloud on the 4 hr and daily time frame and, thus, supports a ‘long’ trade position here. Price is below the Cloud on the weekly and monthly charts so those regions may prove to be some resistance. The weekly Cloud band is before the 1.2 region but the monthly Cloud band is above the 1.2 region.
A/N 4hr Cloud:
A/N daily Cloud:
A/N weekly Cloud:
A/N monthly Cloud:
Summary: watch for a daily AUD/NZD candle close above the 1.09 neck line S/R level of the ‘Double Bottom’ before taking any ‘long’ trade position. ‘Stop’ should be below the 1.09 level. Possible take profit is at the 1.2 region. This is a trade with a potentially huge reward for rather low risk. I would expect this 1.09 level to be tested before any bullish continuation here and I will place an order to long at 1.09.